

黄河流域生态保护和高质量发展战略与京津冀协同发展、长江经济带发展、粤港澳大湾区建设等国家战略共同构成中国区域发展新格局的重要支撑[1-2]。交通作为区域发展的基础与国土空间格局塑造的重要作用力,在黄河流域生态保护与高质量发展过程中具有基础性地位。2021年10月,中共中央、国务院印发的《黄河流域生态保护和高质量发展规划纲要》提出了“加快形成以‘一字型’、‘几字型’和‘十字型’为主骨架的黄河流域现代化交通网络”的发展目标,明确了交通在支撑黄河流域高质量发展过程中的着力点。与此同时,在构建国内大循环与供给侧结构性改革背景下,提升供给体系对需求的适配性问题逐渐受到重视。适时评估交通基础设施发展格局及其对需求侧的支撑程度(适配性)对于优化黄河流域交通基础设施资源配置、提升交通对黄河流域高质量发展的空间适配性具有重要价值。
自2019年黄河流域生态保护和高质量发展战略提出后,围绕黄河流域的相关研究呈现方兴未艾之势,包括从战略与发展路径层面对黄河流域生态保护与高质量发展的系统探讨[1,3⇓-5],围绕资源与生态[6-7]、城镇化与城市群[2,8-9]、产业[9-10]以及人居环境[11]等分主题方面的探讨。交通在支撑产业与人口集聚、促进黄河流域资源优势转化为经济优势方面发挥着至关重要的作用[12-13]。黄河流域在其自然地理结构形成的第一地理本性基础上,借助第二地理本性——交通与要素聚集形成区域发展优势成为关键[14]。然而,已有黄河流域研究文献对交通的关注较少,主要集中在黄河流域发展战略与路径层面探讨中对交通作用的论述[15],部分学者对黄河流域区域交通与经济发展的空间关联格局以及铁路网络高质量发展布局进行了专门探讨[16-17]。交通基础设施供给能力与需求压力随着经济社会的发展而不断变化,在供需适应、协调以及匹配等方面都呈现出一定的地域分布规律,探索交通与经济社会的空间适配性既是提升黄河流域空间治理效能的重要手段,也是实现流域高质量发展的重要基础。
长期以来,科学评估地域交通供给条件及其对经济社会发展的支撑状况一直是经济地理学的核心议题。常用评估指标包括距离成本[18]、可达性[19⇓-21]以及交通优势度[22]3类。距离成本和可达性指标有效刻画了交通网络发育程度,由于其对地理位置的权重考量过大,在全面反映交通设施供给条件的优劣方面具有片面性[23]。金凤君等[22]在此基础上从质、量和势3个方面提出了集成性交通优势度概念与评价模型,更为全面地揭示区域交通供给条件的优劣,在全国、省域、城市群、主体功能区等多尺度区域得到了广泛应用[22,24⇓⇓-27]。然而,已有研究整体仍侧重于供给侧交通优势度水平及其空间格局的揭示,缺少对交通供需空间适配性的探讨。部分研究从投入产出角度对区域交通资源配置效率进行了综合评估,虽可从交通资源投入冗余或产出不足方面识别低匹配区域,但由于其对交通成本统一化处理,无法精准揭示不同属性交通供需特征[28]。黄河流域地跨东中西三大地带,流域自然地理、区位条件以及经济社会发展基础等因素差异巨大,厘清黄河流域交通供给及其对县域发展的适配水平与差异对于优化黄河流域交通资源配置具有重要的理论与现实意义。
鉴于此,本文基于黄河流域现状综合交通运输基础数据,以县域为单元,从交通优势度方面综合解析黄河流域县域交通供给水平及其空间格局,并引入空间适配性与回归残差方法,探讨交通与县域发展质量的空间适配格局与资源配置方向,以期服务于黄河流域交通基础设施布局与高质量发展决策。
1 研究区域与数据
1.1 研究区域
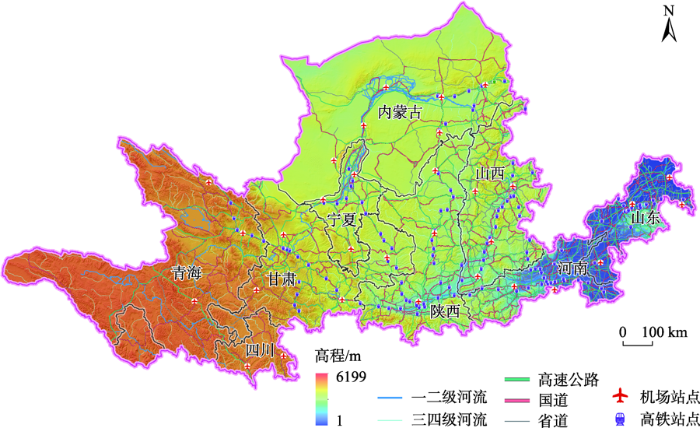
黄河流域研究范围的确定是在保留县级单元完整性的前提下,将自然流域与黄河经济社会影响范围纳入,即在黄河水利委员会划定的自然流域范围基础上,加入黄河下游引黄灌区(图1)。研究区域土地面积128.50万km2,共涉及9个省(区)、74个地级市(自治州、盟)和498个县(区、县、县级市、旗)。本文将市辖区单独考虑,即以县(县级市、旗)与合并后的市辖区作为分析单元,共计392个。根据第七次全国人口普查数据(简称“七普”),黄河流域常住人口18945.83万人,占全国总人口的13.38%;2020年地区生产总值125223.5亿元,占全国的11.94%。
图1
1.2 数据来源
本文用到的数据包括交通基础设施与社会经济统计数据两大类。公铁路网数据来源于高德电子地图,铁路站点与机场分别通过中国铁路12306官网和《从统计看民航(2020年)》获取名录基础上拾取百度坐标得到。社会经济数据来源于《中国县域统计年鉴(2021)》《中国城市统计年鉴(2021)》《中国县域建设统计年鉴(2020)》、各省(市)统计年鉴及各市、县(区)统计公报。常住人口数据来源于“七普”数据,碳排放数据来源于中国碳核算数据库 (
2 研究方法
2.1 交通优势度
式中:TDi为县域i的交通优势度值,
(1) 交通路网密度(Di)。指各级公路里程与所在县域土地面积的比值,表征的是公路设施网络对县域发展的支撑能力,是交通设施供给水平的直接体现。
(2) 区位优势度(Ai)。主要指县域与中心城市的可达性,用以揭示各县域接受中心城市辐射带动作用潜力的大小。本文基于100 m×100 m的栅格数据,采用人口加权的平均旅行时间指标得到[20]。区位优势度为各县域到达所在地级市市区可达性和所在省会城市可达性之和。考虑到边界地区交通联系实际,区位优势度同时考虑了边界地区跨界联系,公式为:
式中:TiP和TiN分别为县域到省会城市和地级市的可达性,可通过Ti计算得到;
(3) 交通干线影响度(Ii)。主要指交通干线对县域发展的支撑与保障能力,是县域对外交流能力的体现,主要通过对交通设施分类赋值的方法进行评价(表1)。
表1 交通干线影响度权重赋值
Tab.1
| 类型 | 子类型 | 标准 | 赋值 | 类型 | 子类型 | 标准 | 赋值 |
|---|---|---|---|---|---|---|---|
| 公路 | 高速公路 | 拥有高速公路 | 2.0 | 铁路 | 普速铁路 | 拥有普速铁路 | 0.5 |
| 距高速公路30 km以内 | 1.5 | 其他 | 0 | ||||
| 距高速公路60 km以内 | 1.0 | 机场 | 枢纽机场 | 拥有枢纽机场 | 2.0 | ||
| 其他 | 0 | 距枢纽机场50 km以内 | 1.5 | ||||
| 国道公路 | 拥有国道 | 0.5 | 其他 | 0 | |||
| 其他 | 0 | 干线机场 | 拥有干线机场 | 1.5 | |||
| 铁路 | 高速铁路 | 拥有高铁站点 | 2.0 | 距干线机场30 km以内 | 1.0 | ||
| 距高铁站点30 km以内 | 1.5 | 其他 | 0 | ||||
| 距高铁站点60 km以内 | 1.0 | 支线机场 | 拥有支线机场 | 0.5 | |||
| 其他 | 0 | 其他 | 0 |
2.2 地理探测器
式中:PD,U表示县域交通优势度影响因素的探测指标;nD,i表示次级区域样本数,n表示全流域样本数,m表示次级区域个数,
2.3 县域发展质量评价
高质量发展背景下,县域发展更加强调经济、社会与生态环境协同持续性。结合数据可获得性与指标代表性,本文从经济、社会发展、生态环境3方面构建县域发展质量评价指标体系(表2)。其中,经济方面包括发展水平、产业结构、资本投入与产出3个方面共计7个指标;社会发展包括居民收入、消费、城市化、医疗卫生、教育、人口密度6个方面共计8个指标;生态环境方面包括污染物排放、绿化水平、污染物处理水平3个方面共计8个指标。利用Min-Max方法对正向与负向指标进行无量纲标准化处理基础上,对三大维度一级指标与各维度下的二级指标进行赋权。考虑到经济、社会与生态环境的同等重要性,采用等比加权,二级指标则采用更为客观的层次分析法对各指标进行赋权。最后,依次计算各维度指标得分和县域发展质量指数总得分值。
表2 黄河流域县域发展质量评价指标体系
Tab.2
| 目标层 | 准则层 | 指标层 | 指标属性 | 指标单位 | 权重/% |
|---|---|---|---|---|---|
| 县域发展质量指数 | 经济 | 人均GDP | 正向 | 万元/人 | 11.11 |
| 一产占比 | 负向 | % | 2.78 | ||
| 二产占比 | 正向 | % | 2.78 | ||
| 三产占比 | 正向 | % | 2.78 | ||
| 地均固定资产投资 | 正向 | 万元/km2 | 5.56 | ||
| 地均一般公共预算收入 | 正向 | 万元/km2 | 4.17 | ||
| 地均一般公共预算支出 | 正向 | 万元/km2 | 4.17 | ||
| 社会发展 | 人均住户储蓄存款余额 | 正向 | 万元/人 | 4.76 | |
| 人均年末金融机构各项贷款余额 | 正向 | 万元 | 2.38 | ||
| 城市化水平 | 正向 | % | 4.76 | ||
| 人口密度 | 正向 | 人/km2 | 2.38 | ||
| 每万人医疗卫生机构床位数 | 正向 | 床/万人 | 4.76 | ||
| 普通中小学在校学生 | 正向 | 人 | 4.76 | ||
| 人均可支配收入 | 正向 | 元/人 | 4.76 | ||
| 人均社会消费品零售总额 | 正向 | 元/人 | 4.76 | ||
| 生态环境 | 单位GDP碳排放强度 | 负向 | 万t/亿元 | 6.06 | |
| 城市人均公园绿地面积 | 正向 | m2/人 | 3.03 | ||
| 建成区绿化覆盖率 | 正向 | % | 3.03 | ||
| 单位GDP污水排放总量 | 负向 | 万m3/亿元 | 6.06 | ||
| 生活垃圾无害化处理率 | 正向 | % | 3.33 | ||
| 年均归一化植被指数(NDVI) | 正向 | — | 6.67 | ||
| PM2.5浓度 | 负向 | μg/m3 | 3.03 | ||
| 污水处理率 | 正向 | % | 3.03 |
2.4 空间适配性量化方法
表3 空间适配性分级标准
Tab.3
| 耦合协调度(D) | 适配等级 | 耦合协调度(D) | 适配等级 |
|---|---|---|---|
| 0.90~1.00 | 超前发展 | 0.40~0.49 | 濒临错配 |
| 0.80~0.89 | 高度适配 | 0.30~0.39 | 轻度错配 |
| 0.70~0.79 | 中级适配 | 0.20~0.29 | 中度错配 |
| 0.60~0.69 | 初级适配 | 0.10~0.19 | 严重错配 |
| 0.50~0.59 | 勉强适配 | 0~0.09 | 极度错配 |
注:引自参考文献[
3 黄河流域县域交通优势度空间格局
3.1 全流域空间格局
3.1.1 多数县域交通优势不突出,高优势度县域集中分布在济南—郑州—西安—兰州通道沿线
黄河流域县域交通优势度值呈偏正态分布(图2a),主要集中在0.3~0.7之间,均值为0.44,略低于最优值一半水平,且交通优势度值越高,县域数量越少,表明黄河流域多数县域交通优势并不明显。具体来看,255个县域单元的交通优势度低于0.5,占县域单元总数的65.1%,覆盖黄河流域36.26%的人口和30.62%的GDP;剩余137个县域交通优势度高于0.5,覆盖了63.74%的人口和69.38%的GDP。其中,仅有21个县域单元的交通优势度高于0.75,占县域单元总数的5.36%,覆盖流域24.10%的人口和33.75%的GDP。总体上,交通优势度在0.4~0.6之间的县域对人口和GDP的覆盖水平最高,且人口和GDP之间存在明显的错配现象,分别覆盖了40.96%的人口和33.33%的GDP。究其原因,经济发展除受交通因素外,资源禀赋、规划政策以及社会条件等也是关键因素,这样就可能会出现交通较发达但GDP不高的现象。从空间格局来看,县域交通优势度呈现出自东向西、自流域下游向中上游逐渐递减的分异特征(图3a),这与经济发展水平东西梯度差异直接相关。高交通优势度县域集聚分布于济南—郑州—西安—兰州沿线,以及南同蒲和包茂线。在城市群、省会城市及其周边形成了高优势度连续面域分布形态。低值区域在自然地理条件约束较高的青藏高原、陇南、黄河高原沟壑区以及内蒙古中西部地区形成连片分布。
图2
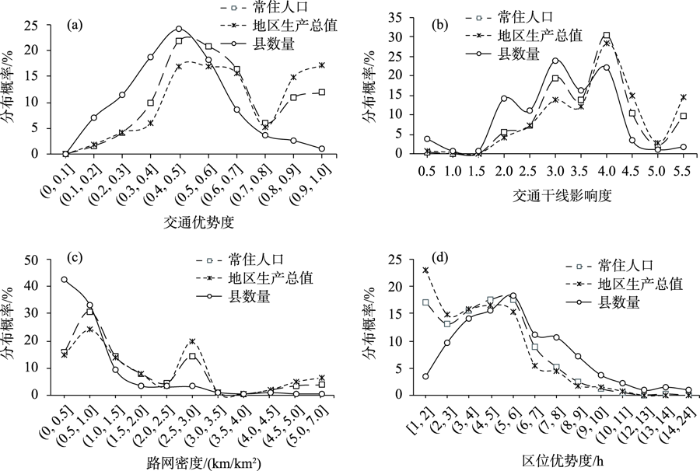
图2
黄河流域县域、人口和GDP与交通优势度的分布概率
Fig.2
Distribution of counties, population, and GDP by transport condition in the Yellow River Basin
图3
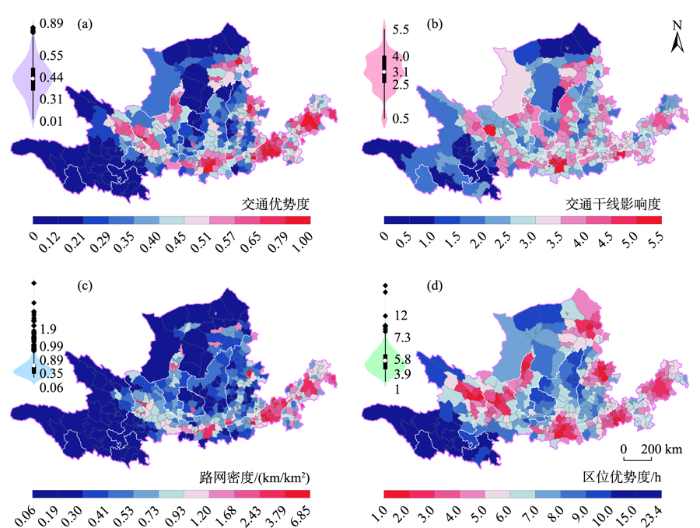
图3
黄河流域交通优势度及其分指标空间格局
注:图中左上角为各指标指数小提琴图。
Fig.3
Spatial patterns of transport condition and its sub-indices in the Yellos River Basin
3.1.2 交通干线影响度呈偏正态分布,形成了与交通优势度相似的空间格局
交通干线影响度总体上呈偏正态分布,均值为3.11(图2b)。具体来看,干线影响度值最高的为郑州市区,高达5.5;最低的为阿坝州,为0.5。215个县域低于平均水平,占县域总数的54.85%,覆盖流域37.79%的人口和26.89%的GDP。剩余177个高于平均值的县域覆盖了62.21%的人口和73.11%的GDP。交通干线影响度集成了线状高速公路、国道以及铁路、点状高铁站、机场等枢纽的综合作用,高影响度县域在空间上沿主要交通干线形成了连续带状分布形态,在主要城市群、城镇密集地区形成了高值集聚(图3b)。伴随着城镇化的快速发展,黄河流域干线交通基础设施得到了快速发展,对沿途区域提供了较高的支撑能力。受地形地貌等自然地理条件约束,黄河流域上游地区的青藏高原、陇南山地、陇东高原以及内蒙古中西部交通干线影响度较低。
3.1.3 公路密度区域差异大,高密度县域呈下游面状与中上游岛状形态分布
黄河流域交通路网密度数值分布呈位序—规模分布(图2c),均值为0.89 km/km2。具体来看,路网密度最高的是郑州市区,达到6.85 km/km2,最低的是青海天峻县,为0.05 km/km2。392个县域评价单元中,275个县域路网密度低于流域平均水平,占比高达70.15%,覆盖了52.53%的人口和39.30%的GDP,表明黄河流域多数县域路网密度较低,公路交通对这些县域发展的支撑能力有待进一步提升。41个县域路网密度高于2 km/km2,占县域单元总数的10.46%,覆盖了22.64%的人口和31.96%的GDP。在空间分布上,相较于交通优势度,黄河流域公路网络密度呈现出显著的东西分异特征(图3c),流域下游公路网络密度较高,呈连片密集分布,中上游地区整体公路网密度相对较低,仅仅在省会城市及其周边形成高值岛状分布格局。
3.1.4 近60%的县域区位优势度高于流域平均水平,呈现出显著的中心—外围格局
区位优势度均值为5.76 h,其中,到省会城市的优势度均值为4.07 h,到地级市优势度均值为1.69 h。区位优势度主要集中在2~9 h之间,225个县域区位优势度高于平均水平,占县域总数的57.4%,覆盖了黄河流域77.4%的人口和81.6%的GDP。分类型来看,215个县域到地级市优势度高于平均水平,228个县域到省会城市优势度高于平均水平,表明从可达性角度来看,高等级干线快速发展下的黄河流域整体区位优势度水平较高。在空间格局上,全流域区位优势度呈现出显著的中心—外围分布态势,形成围绕黄河流域“3+4”城市群为核心的高值集聚区,外围县域单元区位优势度水平较低,在青海西南部、川西、甘肃西部以及内蒙古中西部等地,受制于自然地理条件限制、相对较低的经济基础和低水平的人类活动规模等因素,形成了连片低水平集中区。
3.1.5 县域交通空间均衡性高于人口和GDP
黄河流域县域交通优势度均衡性水平显著高于人口和GDP分布(图4)。具体来看,交通优势度及其子指标的均衡性从高到底依次为交通干线影响度(基尼系数=0.17)>交通优势度(0.24)>区位优势度(0.26)>路网密度(0.47)的分布态势。交通优势度、交通干线影响度以及区位优势度指标测度均涉及县域外高等级干线与站点的影响,这3个指标的均衡性水平自然高于仅考虑县域内部公路规模的路网密度指标。另一方面,这也与黄河流域特别是中上游地区近年来以高速公路、高速铁路等为代表的高等级交通快速发展具有直接关系。人口和GDP的基尼系数分别为0.53和0.68,远远高于交通优势度、交通干线影响度以及区位优势度指标,表明黄河流域县域交通基础设施供给呈现出均衡化特征。此外,表征县域内部通达性的路网密度均衡性最低,与人口分布基尼系数(0.53)基本持平。
图4
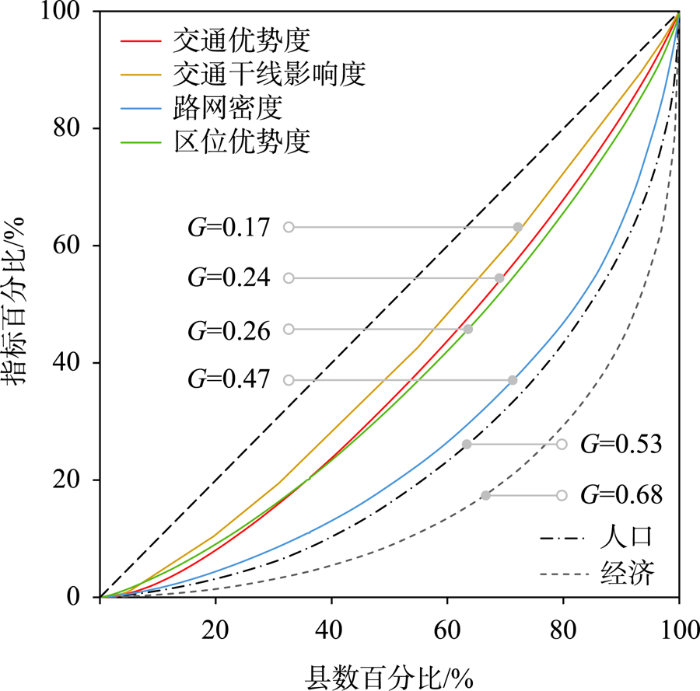
图4
黄河流域交通优势度及其分指标洛伦兹曲线
注:图中G为基尼系数。
Fig.4
Lorentz curve of transport condition and its sub-indices
3.1.6 固定资产投资、支出以及自然条件是流域交通优势度分异的主要因素
县域交通优势度水平及其空间分异是多因素综合作用的结果。本文选取了反映城镇化与经济发展、资本投资、自然地理等方面的10项指标,对县域交通优势度格局形成因素进行地理探测(表4)。结果显示,地均固定资产投资(统计值=0.52)、地均公共预算支出(0.38)、高程(0.38)以及二三产业占比(0.19)等变量是全流域县域交通优势度格局形成的主要因素。不难理解,黄河流域地跨青藏高原、西北干旱半干旱以及华北湿润半湿润等自然分区,自然地理格局分异大,地形复杂,生态环境敏感性与脆弱性叠加,人口分布不均衡,这种地理特征直接决定了黄河流域交通基础设施建设高难度与高投资属性。以地均固定资产投资、地均公共预算支出为代表的资本投资与以高程为代表的自然地理条件就成为黄河流域县域交通优势度空间格局形成的主要驱动因素。
表4 不同样带各要素地理探测器结果统计
Tab.4
| 区域 | 地理探测器统计值 | |||||||||
|---|---|---|---|---|---|---|---|---|---|---|
| 地均固定 资产投资 | 地均公共 预算支出 | 人均建设用地 | 高程 | 坡度 | 地面粗糙度 | 城镇化水平 | 人口密度 | 人均GDP | 二三产占比 | |
| 黄河流域 | 0.52 | 0.38 | 0.11 | 0.38 | 0.15 | 0.11 | 0.12 | 0.04 | 0.10 | 0.19 |
| “一”字样带 | 0.50 | 0.31 | 0.11 | 0.01 | 0.05 | 0.13 | 0.34 | 0.13 | 0.21 | 0.48 |
| “几”字样带 | 0.48 | 0.29 | 0.36 | 0.16 | 0.19 | 0.17 | 0.22 | 0.43 | 0.20 | 0.42 |
| “1”字样带 | 0.72 | 0.63 | 0.12 | 0.25 | 0.13 | 0.25 | 0.55 | 0.20 | 0.22 | 0.27 |
3.2 典型样带空间格局
为更清晰地揭示黄河流域县域交通优势度空间分异,本文选取样带方法进一步对黄河流域县域交通优势度空间格局展开分析。参考国家城镇化发展轴线与《黄河流域生态保护和高质量发展规划纲要》中的战略布局和交通设施方面的空间安排,重点选取了陇海兰新铁路“一”字型、黄河干流“几”字湾和南北纵向“1”字型3条样带。各样带县域交通优势度空间格局及对应的空间趋势线如图5所示。
图5
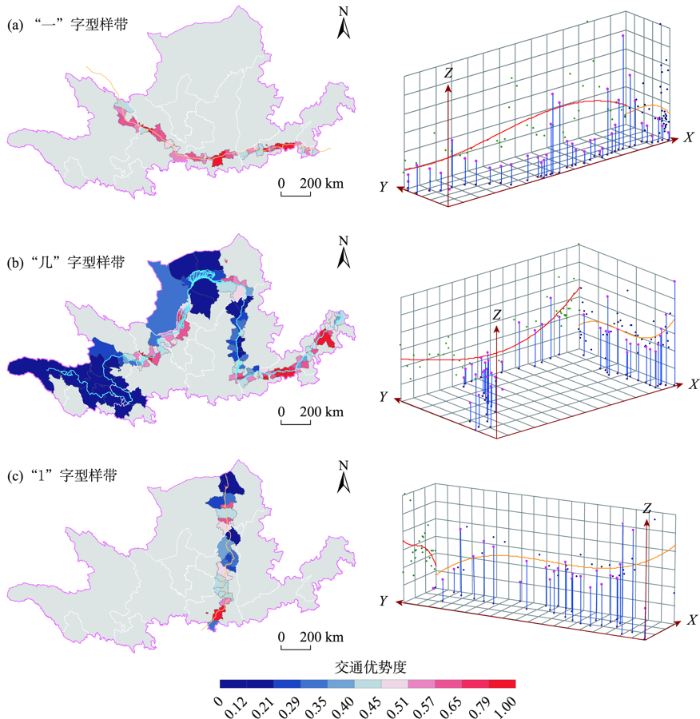
图5
黄河流域典型样带交通优势度格局与变化趋势线
Fig.5
Spatial pattern of transport conditions and trend lines of different areas of the Yellow River Basin
(1) 陇海—兰新高速铁路“一”字型样带。该样带与国家沿陆桥城镇化主轴线部分重合,地跨黄河流域河南、陕西、甘肃、青海4省,共计41个县域单元。沿线交通优势度大致呈倒“U”型排列,均值为0.60,高于全流域平均水平。影响因素探测结果表明(表4),地均固定资产投资(0.50)、二三产值占比(0.48)、城镇化水平(0.34)、地均公共预算支出(0.31)以及人均GDP(0.21)是影响该样带县域交通优势度的主要因素。该地带自然地理条件与交通发展历史基础优越,在沿线中原城市群、关中城市群以及兰西城市群辐射带动下,交通优势度整体处于较高水平。同时,在距离衰减作用下,空间格局上形成了以沿线省会城市为核心高值区、其间穿插低值区的点—轴分布模式。作为新亚欧大陆桥的核心部分,该样带良好的交通优势度对依托该发展轴的产业与人口等要素的集聚与扩散起到了支撑与保障作用。
(2) 黄河干流“几”字湾样带。该样带途径兰西、宁夏沿黄、呼包鄂榆、关中、中原以及山东半岛等城市群,包括黄河干流沿线共计128个县域单元。交通优势度均值为0.56,高于全流域平均水平。地均固定资产投资(0.48)、人口密度(0.43)、二三产值占比(0.42)、人均建设用地(0.36)、地均公共预算支出(0.29)、城镇化水平(0.22)、人均GDP(0.20)是该样带交通优势度形成的主要因素。在空间格局上,交通优势度在下游和中上游地区形成了显著分异,下游地区出现了连片带状高值集聚区,尤以关中城市群山西部分、中原城市群和山东半岛城市群最优。中上游地区高值集聚区则主要呈岛状分布,仅在呼包鄂榆、宁夏沿黄以及兰西城市群部分地区出现了高值集聚。已有研究指出,黄河流域由于航运、港口等因素限制,不具备形成发展轴的基础条件,沿河并未形成类似于长江的沿江集聚带,主要空间组织形态为围绕省会城市的都市圈和城市群[13]。相较于“一”字型样带,该样带交通对沿线县域经济社会发展支撑能力有待进一步提升。也正因如此,《黄河流域生态保护与高质量发展规划纲要》中黄河流域交通“几”字湾为兰州经银川、包头至呼和浩特、太原并通达郑州的综合运输走廊,并未与干流“几”字湾完全重合。
(3) 黄河流域南北纵向“1”字型样带。该样带与国家城镇化发展主轴线的包昆发展轴部分重合,贯穿黄河流域中部南北向通道,连接内蒙古和陕西两省(区),依次经过包头、鄂尔多斯、延安和西安,共计28个县域单元。该样带交通优势度均值为0.43,略低于全流域平均水平。地均固定资产投资(0.72)、地均公共预算支出(0.63)、城镇化水平(0.55)、二三产值占比(0.27)、高程(0.25)、地面粗糙度(0.25)以及人均GDP(0.22)等是该样带交通优势度形成的主导因素。在空间分布上,交通优势度趋势线呈自北向南波动增加趋势,形成了以沿线地级市辖区为高值区、周边县域为低值区的分布格局,特别是在陕北黄土高原、内蒙古鄂尔多斯部分县域,由于自然地理条件限制、经济基础等因素的影响,交通设施水平相对较低,对区域发展保障与支撑能力有待提升。
4 黄河流域交通优势度的空间适配性
4.1 黄河流域县域发展质量空间格局
图6
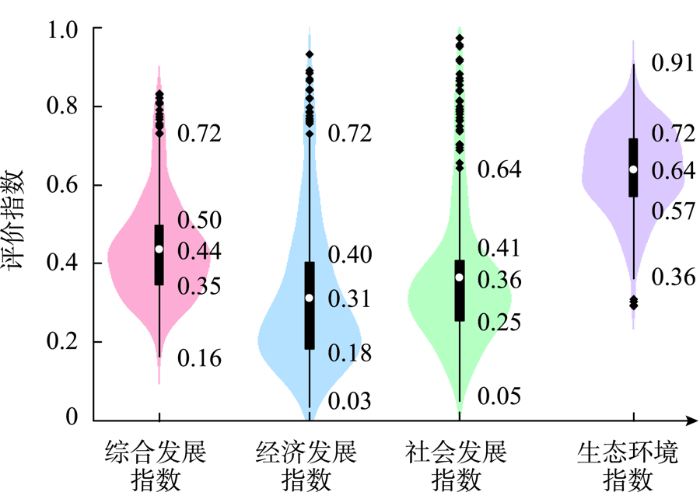
图6
黄河流域县域发展质量指数小提琴图
Fig.6
Violin chart of county development quality index in the Yellow River Basin
图7
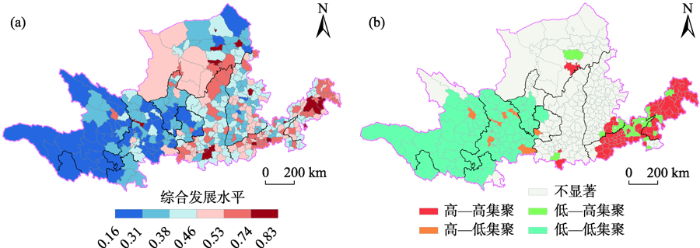
图7
黄河流域县域综合发展质量空间格局及空间聚类
Fig.7
Spatial pattern and spatial clustering of county development quality index in the Yellow River Basin
(1) 黄河流域县域发展质量呈现出生态环境指数>综合指数>社会发展指数>经济发展指数的分布态势,区域差异上则呈现经济发展指数>社会发展指数>综合指数>生态环境指数的态势(图6)。综合指数均值为0.44,排名前10位的城市包括郑州、济南、西安、太原、淄博、洛阳、包头、兰州、鄂尔多斯以及呼和浩特等。170个县域单元综合指数得分高于平均值,占县域单元总数的43.37%。经济发展指数均值为0.31,排名前10位的城市中新增咸阳和桓台,洛阳和呼和浩特位序分别下降到第12、21位,其余城市均与综合指数一致。144个县域单元经济指数高于全流域平均水平,占县域单元总数的36.73%。社会发展指数均值为0.36,146个县域单元社会发展指数高于平均水平,仅占县域单元总数的37.24%。生态环境指数均值为0.64,排名前列的均为外围县域,199个县域单元生态环境指数高于平均值,占比高达50.77%,表明黄河流域县域在生态环境本底基础的优越性及环境基础设施建设方面取得了较大进展,这与相关学者的研究是一致的[2]。
(2) 黄河流域县域发展质量在空间上呈现出自黄河流域下游向中上游波动递减的分异特征。受区位条件、发展基础、自然地理等因素的影响,沿黄河自沿海向内陆,县域发展指数呈波动下降态势,流域下游、中游和上游的平均分值分别为0.64、0.36和0.26。在下游地区郑州—济南通道沿线城镇密集区形成了高—高集聚区。此外,在内蒙古鄂尔多斯等依托能源、矿产资源开发的经济实力强劲县域也形成了高—高集聚区。上游地区县域综合发展水平整体较低,79.89%的县域低于全流域平均水平。高于平均水平的县域分布较为离散,呈斑块状镶嵌其中,特别是在青藏高原大部分地区、陇南、陇东地区,受自然地理环境限制与承担地域主体功能差异,整体上县域发展水平较低。空间聚类结果显示,在青藏高原、陇南、宁夏西海固、黄土丘陵沟壑区、黄土塬沟壑区等区域形成了低—低集聚区。
4.2 交通优势度与县域发展质量的空间适配性
4.2.1 空间适配性
基于表3确定的值标准,将二者空间适配性分值结果归类,结果如图8a所示。具体来看,黄河流域157个县域的交通优势度与发展质量处于初级适配状态,占县域总数的比重为40.05%,大面积分散分布于黄河流域,需要进一步提升县域交通供给支撑和保障水平。93个县域为勉强适配型,集中分布在青藏高原、黄土高原沟壑区和内蒙古中西部地区。中级适配类型包括80个县域,占比为20.41%,包括临夏、大同、巩义、菏泽、兴平等城市市辖区及其他县域,呈碎片状分散镶嵌在黄河流域范围内。高度适配县域类型包括25个县域,占比6.38%,包括洛阳、呼和浩特、新乡、中牟、淄博、焦作等地。超前发展型县域仅有6个,包括郑州、西安、太原、济南、咸阳和兰州等省会城市市辖区和经济较为发达城市市辖区。错配县域主要集中在青藏高原地区。
图8
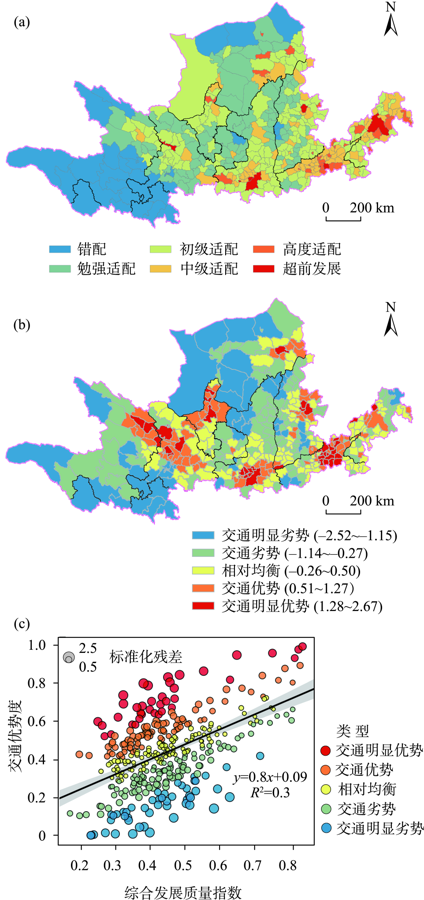
图8
黄河流域县域交通优势度与县域综合发展质量的空间适配格局
Fig.8
Spatial matching pattern between county transport condition and county development quality in the Yellow River Basin
4.2.2 基于回归残差的交通资源配置方向
空间适配性从结果角度刻画了黄河流域交通优势度与县域发展质量的协调状态,为进一步从交通配置角度回答不同适配性水平下交通对县域发展的支撑与保障程度,本文对县域交通优势度和发展质量指标进行一元线性回归拟合,通过县域交通优势度的标准化残差来揭示二者之间的配置比例关系。偏离均值的倍数越高,表明相较于县域发展,交通处于明显优势,反之,则表明交通处于明显劣势。
具体来看,392个县域中,117个县域属于交通优势型,占比达到29.85%,包括39个交通优势突出县域和78个交通优势县域,大部分为省会城市市辖区以及交通枢纽城市,相较于县域质量来说,交通建设具有“适度超前”特征,对这些县域经济社会发展具有较强的支撑与保障能力,未来在提升交通质量的同时,应进一步强化交通基础设施对人口和GDP的集聚带动作用。123个县域属于相对均衡型,占比为31.38%,这类县域分散分布在黄河流域范围内,多属于基本适配型,表明相对来说,这类县域的交通支撑与保障程度能够基本满足县域经济社会发展需求,二者处于基本匹配状态,未来应进一步提升黄河流域县域交通供给支撑和保障水平。剩余152个县域处于交通劣势状态,占比为38.78%,包括103个交通劣势县和49个交通劣势突出县,这些县域与勉强适配和错配类型分布基本一致,多集中在青藏高原、黄土高原沟壑区和内蒙古中西部地区,受恶劣的地形地貌等自然地理条件限制,交通优势度水平不高,对县域经济社会发展造成了很大制约,未来亟需提升交通基础设施对这些县域经济社会发展的支撑与保障能力。
5 结论与讨论
基于交通在黄河流域生态保护与高质量发展过程中的基础支撑作用,实证分析黄河流域交通供给水平特征及其与经济社会发展的空间适配性,可为优化交通资源配置、提升交通供给适配性提供参考。本文分析了黄河流域县域交通优势度水平及其空间格局,并探讨了县域交通与县域发展质量的空间适配性,主要结论有:
(1) 黄河流域县域交通优势有待提升,高优势度县域集中分布在济南—郑州—西安—兰州通道沿线,在黄河流域“3+4”城市群以及省会城市形成了高优势度的连续面域分布形态。不同等级县域交通优势度发挥了差异性的人口与GDP集聚能力。
(2) 样带交通优势度呈现出陇海—兰新“一”字型样带>“几”字湾样带>南北纵向“1”字型样带的分布态势,固定资产投资、公共预算支出、产业结构、城镇化、经济基础是影响黄河流域县域交通优势度的主要因素。此外,“几”字湾样带与南北纵向“1”字型样带交通优势度还受到高程、坡度等自然地理因素的制约。
(3) 黄河流域40.05%的县域交通优势度与县域发展质量处于初级适配状态,分散分布于黄河流域。23.72%的县域为勉强适配型,集中分布在青藏高原、黄土高原沟壑区和内蒙古中西部地区。
(4) 将交通与县域发展质量匹配划分为交通优势突出、交通优势、相对均衡、交通劣势与交通劣势突出5类。38.78%的县域处于交通劣势状态,集中在青藏高原、黄土高原沟壑区和内蒙古中西部,未来亟需提升交通设施对这些县域经济社会发展的支撑与保障能力。
相较于现有研究,本文得到的县域交通优势度的格局分异特征存在相似共性,创新之处在于以黄河流域为例,进一步从样带角度展开了交通优势度格局分异的影响因素探测,同时从空间适配性角度分析了交通与县域经济社会发展的适配、比例匹配关系,这是对现有黄河流域文献研究的补充和完善,也为交通优势度研究提供了参考。受制于数据可获得性,仅从单一时间截面上进行分析,未来尚需从时空演变方面进行深入探讨。此外,后续研究可结合客货大数据实现对宏观尺度适配性及其形成机理更深层次的探讨。
参考文献
黄河流域生态保护与高质量发展的协调推进策略
[J].
Coordinated promotion strategy of ecological protection and high-quality development in the Yellow River Basin
黄河流域城市群高质量发展评估与空间格局分异
[J].
High-quality development assessment and spatial heterogeneity of urban agglomeration in the Yellow River Basin
黄河流域的综合治理与可持续发展
[J].
DOI:10.11821/dlxb201912001
[本文引用: 1]

黄河流域与黄河所经地区在国家发展中具有极为重要的战略地位。2019年9月习近平总书记在郑州主持召开黄河流域生态保护和高质量发展座谈会上发表了重要讲话,具有重大战略意义。本文对黄河流域的综合治理与可持续发展形成了初步认识,指出新时代黄河流域全面深刻转型发展的任务仍然艰巨,需转变理念,持续推进能源清洁高效利用,因地制宜重点推进产业发展,不搞粗放式大开发,搞好资源耕地保护等方面应是推进黄河流域综合治理及保障可持续发展的重要举措,认为“黄河经济带”在全国经济层面上不存在,目前不适宜将“黄河三角洲”确定为国家战略。
Development and management tasks of the Yellow River Basin: A preliminary understanding and suggestion
DOI:10.11821/dlxb201912001
[本文引用: 1]
The Yellow River Basin and the areas along the Yellow River play an important strategic role in national development. Xi Jinping, General Secretary of the CPC, delivered an important speech at the symposium on ecological protection and high-quality development of the Yellow River Basin in Zhengzhou, which is of great strategic significance. This paper gives a preliminary understanding of the comprehensive governance and the sustainable development of the Yellow River Basin. It points out that the task of the comprehensive and profound transformation and development of the Yellow River Basin in the new era is still arduous, and change of concept is required. Continuing to promote the clean and efficient use of energy, promoting industrial development in accordance with local conditions, preventing extensive development and protecting cultivated land resources should be regarded as important measures to strengthen the comprehensive management and guarantee the sustainable development of the Yellow River Basin. It is believed that the "Yellow River Economic Belt" does not exist at the national economic level, and it is not appropriate to identify "the Yellow River Delta" as a national strategy.
黄河流域高质量发展的基本条件与核心策略
[J].
DOI:10.18402/resci.2020.03.01
[本文引用: 1]
黄河流域整体处于工业化中期到后期的转型发展和区域经济的起飞发展阶段,大体处于集聚功能大于扩散效应的“虹吸效应”阶段和区内发展的激烈竞争时期。高质量的中/高速经济增长是黄河流域现代化进程和可持续发展的前提。在大致梳理流域(区域)高质量发展的内涵及其理论演变的基础上,本文探讨了黄河流域高质量发展的基本条件及其核心策略。域内高质量发展的基本条件表现为农业发展的多样性和脆弱性,流域经济联系的松散性,经济发展阶段性及其内部差异性的约束,外部投资和产业转移等动力不足的约束等。这决定了流域高质量发展必表现为长期性、多样性、竞争性、协同性甚至区域化的倾向。因此,黄河流域高质量发展需探索“弯道超车”的核心策略:①在智能社会和全球化浪潮中,谋高质量增长,即持续探寻域内适合国家需求和地方特色的新型产业转型发展模式,建构适合各地方的特色化产业集群/产业链,提升综合竞争力;②探寻同质前提下的协同新模式,谋划流域协同和寻求特色化的新型城镇化模式,包括适合各地的人口城镇化策略和城乡统筹模式,尤其是基于土地流转的乡村人口向河谷/川地/盆地、平原、城镇的持续迁移路径,提高劳动生产率,关注水资源和基础设施建设等问题;③实施“中心突破”的体制,寻求中心带动的流域空间重构,推动中心城市和城镇群的健康发展,促进高质量发展。黄河流域高质量发展是一个至少20~30年的长期探索过程。
Basic conditions and core strategies of high-quality development in the Yellow River Basin
DOI:10.18402/resci.2020.03.01
[本文引用: 1]
The Yellow River Basin as a whole is in the mid- to late stage of industrial transformation and the rapid development stage of the regional economy. It is in general in the “siphon effect” stage where the agglomeration function is stronger than the diffusion effect, and in the period of intense competition in intraregional development. Medium/high-speed economic growth of high-quality is a prerequisite for the modernization and sustainable development of the Yellow River Basin. Based on a general analysis of the connotation and change of theories of high-quality development in the basin (region), this article explores the basic conditions and core strategies of high-quality development in the Yellow River Basin. The basic conditions of high-quality development are the local diversity and vulnerability of agricultural development, the loose nature of the economic links in the river basin, constraints from the stage of economic development and its internal differences, and lack of momentum of external investment and industrial transfer, among others. These particularities determine that the high-quality development of the river basin must manifest itself in a long-term, diverse, competitive, cooperative, and regional orientation. Therefore, the high-quality development of the Yellow River Basin needs to explore a core strategy of “overtaking by curves”: (1) With the development of smart society and globalization, the region should seek high-quality growth, that is, continue to explore new industrialization models in the region that are suitable for national needs and local characteristics, and build localized industrial clusters/chain to enhance comprehensive competitiveness; (2) Explore new models of synergy under the premise of homogeneity, plan river basin coordination and improve coordination mechanisms, and seek a new urbanization model of localization, including localized population urbanization strategy and urban-rural coordination model, especially the continued migration of rural population to river valleys/basins, plains, and towns based on land transfer. Improve labor productivity, paying attention to water resources and infrastructure construction, and so on; (3) Implement the “center breakthrough” system, seek the spatial reconstruction of the drainage basin led by the centers, promote the healthy development of central cities and urban agglomerations, and promote high-quality development. In general, the high-quality development of the Yellow River Basin is a long-term exploration process of at least 20-30 years.
黄河流域高质量发展分区分级分类调控策略研究
[J].
Regulation strategy of zoning-gradation-classification for high-quality development in the Yellow River Basin
黄河流域城市资源环境效率时空特征及影响因素
[J].
Spatial and temporal characteristics and influencing factors of urban resources and environmental efficiency in the Yellow River Basin
DOI:10.31497/zrzyxb.20210114 URL [本文引用: 1]
黄河流域县域碳排放的时空格局演变及空间效应机制
[J].
DOI:10.13249/j.cnki.sgs.2021.08.003
[本文引用: 1]
利用空间面板模型、空间自相关分析和以区域背景与最近邻状况为空间滞后的空间马尔科夫链对2000—2017年黄河流域县域碳排放时空格局与空间效应进行分析,结果表明:① 2000年以来黄河流域碳排放量激增,由山东全域和陕甘宁蒙交界的高值区向外圈层与轴向扩张,形成东高西低碳排放格局;② 存在“俱乐部趋同”现象,高碳排放县集聚于山东全域和陕甘宁蒙交界,低碳排放县集聚于西南部;2000年与2017年对比发现县域碳排放类型稳定性强,较高碳排放变为较低碳排放的县集中在东南部区域,而相反方向转变的县集中在内蒙古;③ 高碳溢出效应与低碳锁定效应是塑造时空格局的重要作用力,前者作用力更强;区域背景增强了“俱乐部趋同”与被包围异常值趋同,作用力强于最近邻状况,不显著区域内碳排放类型转变概率提高。④ 空间面板模型结果显示年轻人口结构、大经济规模、二产为主产业结构、高生活水平和高公共支出促进了碳排放量增加与空间效应作用,其中经济规模与产业结构是重要驱动因素。
Spatio-temporal evolution and spatial effect mechanism of carbon emission at county level in the Yellow River Basin
DOI:10.13249/j.cnki.sgs.2021.08.003
[本文引用: 1]
Carbon emission control is the main problem and measure of ecological protection and high-quality development in the Yellow River Basin. Carbon emission at county level research can provide more accurate theoretical support for collaborative governance and sustainable development of the Yellow River Basin. Spatial panel model, spatial autocorrelation analysis and spatial Markov chain with regional background and nearest neighbor as spatial lags were used to analyze the spatiotemporal pattern and spatial effect of carbon emissions in counties of the Yellow River Basin from 2000 to 2017, the results showed that: 1) the carbon emission in the Yellow River basin has increased dramatically since 2000; the high carbon emissions areas, Shandong province and the boundary between Shaanxi, Gansu, Ningxia and Inner Mongolia, expands to the outer circle layer and the axial direction, forming the spatial pattern of high in the east and low in the west; 2) there is a phenomenon of “club convergence”; the high carbon emission counties converge in Shandong province and the boundary between Shaanxi, Gansu, Ningxia and Inner Mongolia; the low carbon emission counties converge in the southwest; the comparison between 2000 and 2017 shows that county carbon emission type has strong stability; counties which tranfered from higher carbon emission type to lower carbon emission type are concentrated in the southeast region, while counties that change in the opposite direction are concentrated in Inner Mongolia. 3) high carbon spillover effect and low carbon locking effect are important forces to shape the spatiotemporal pattern and the former is stronger; the regional background enhances “club convergence” and the convergence of surrounded outliers and its acting force was stronger than the nearest neighbor; the probability of carbon emission type transition in insignificant regions increased; 4) the spatial panel model shows that increase of carbon emissions and its spatial effect are promoted by young population structure, large economy, industrial structure dominated by the secondary industry, high living standard and high public expenditure; economy and industrial structure are important driving factors.
黄河流域城市群形成发育的空间组织格局与高质量发展
[J].
Spatial organization pattern and high-quality development of urban agglomeration in the Yellow River Basin
DOI:10.2307/142170 URL [本文引用: 1]
黄河流域城市群与产业转型发展
[J].
Urban agglomeration and industrial transformation and development in the Yellow River Basin
DOI:10.31497/zrzyxb.20210201 URL [本文引用: 2]
产业集聚对黄河流域工业韧性的影响研究
[J].
DOI:10.13249/j.cnki.sgs.2021.05.010
[本文引用: 1]
经济韧性是经济地理学领域的研究热点,区域产业结构被认为是影响经济韧性的最重要因素。2019年以来,黄河流域生态保护和高质量发展已上升为国家战略,对黄河流域工业韧性进行系统评价并考察产业集聚对工业韧性的影响具有重要的理论和现实意义。以黄河流域为研究区域,从抵抗力和恢复力2个层面刻画区域工业韧性,构建计量模型考察专业化、多样性、相关多样性、非相关多样性等不同产业集聚类型对工业韧性的影响,研究发现:① 黄河流域工业韧性水平整体较高,绝大多数城市对外部冲击有着较强的抵抗力,同时在外部扰动退去后有着较强的恢复力;② 黄河流域工业韧性的空间差异显著:恢复力水平较高的地区主要集中在内蒙古、山东,甘肃和青海的恢复力相对较低;抵抗力水平在空间上呈西高东低的分布特征;③ 产业结构单一地区的工业发展更容易从外部扰动的影响中恢复,对某一产业的高度集中会增大区域工业受到外部冲击的风险,多样且关联的产业结构更有利于提高区域工业应对不利扰动的抵抗力,也有利于区域从危机影响中实现更快的恢复;④ 提高黄河流域的工业韧性,要避免对某一个产业的过度专业化集中,在推动产业多样化发展的同时,要注意提高产业的前后向联系和关联水平。
Influence of industrial agglomeration on the industrial resilience of the Yellow River Basin
DOI:10.13249/j.cnki.sgs.2021.05.010
[本文引用: 1]
Economic resilience is a hotspot in the field of economic geography, and regional industrial structure is considered to be the most important factor affecting economic resilience. At present, the ecological protection and high-quality development of the Yellow River Basin has become a national strategy. It is of great theoretical and practical significance to scientifically evaluate the industrial toughness of the Yellow River Basin and to investigate the impact of industrial agglomeration on the industrial resilience. In this article, 90 cities in the Yellow River Basin are taken as research areas. The industrial resilience level of the region is measured from two levels of resistance and recoverability. An econometric model is constructed to examine the impact of different cluster types of industrial clusters, such as specialization, diversity, related diversity, and unrelated diversity, on the industrial resilience of the region. The main conclusions are as follows: 1) The industrial resilience level of the Yellow River Basin is relatively high as a whole. Most cities have strong resistance to external shocks and strong resilience after external disturbances recedes. 2) There are significant spatial differences in industrial resilience in the Yellow River Basin. The areas with high recoverability level are mainly concentrated in Inner Mongolia, Shandong and some cities of Qinghai, while the resilience of Gansu and Qinghai is relatively low. The spatial distribution of resistance level is higher in the west and lower in the east. 3) Industrial development in a single industrial structure area is easier to recover from the impact of external disturbances. A high concentration of a certain industry will increase the risk of regional industry being subjected to external shocks. Diversified and related industrial structures are more conducive to improving the resistance of regional industry to adverse disturbances, and also to achieving faster regional recovery from the impact of the crisis. 4) In order to improve the industrial resilience of the Yellow River Basin, we should avoid over-specialization and concentration of an industry. While promoting the diversification of industries, we should also pay attention to improving the forward-backward linkages and linkages between industries.
黄河流域人居环境的地方性与适应性: 挑战和机遇
[J].
The locality and adaptability of human settlements in the Yellow River Basin: Challenges and opportunities
DOI:10.31497/zrzyxb.20210101 URL [本文引用: 1]
黄河流域空间发展格局演进特征及优化研究
[J].
The evolution and optimization of the spatial development pattern in the Yellow River Basin
基于地理单元的区域高质量发展研究: 兼论黄河流域同长江流域发展的条件差异及重点
[J].
High quality regional development research based on geographical units: Discuss on the difference in development conditions and priorities of the Yellow River Basin compared to the Yangtze River Basin
DOI:10.2307/142170 URL [本文引用: 2]
黄河流域区域发展优势与经济带生成可能
[J].
Regional development advantages of the Yellow River Basin and the possibility of economic zone formation
黄河流域战略地位演变与高质量发展方向
[J].
Evolution of the strategic position and high-quality development direction of the Yellow River Basin
黄河流域区域交通与经济发展的空间关联研究
[J/OL].
Study on the spatial correlation of regional transportation and economic development in the Yellow River Basin
黄河流域铁路网高质量发展对策研究
[J].
Research on high quality development strategy of railway network in the Yellow River Basin
经济发达地区交通网络演化对通达性空间格局的影响: 以广东省东莞市为例
[J].
The impact of the evolution of land network on spatial structure of accessibility in the developed areas: The case of Dongguan City in Guangdong Province
珠江三角洲交通通达性空间格局与人口变化关系
[J].
The relationship between spatial structure of accessibility and population change in Pearl River Delta
DOI:10.11821/yj2012090012
[本文引用: 1]
Based on the road and railway network data of 1988,1998 and 2008 in the Pearl River Delta,supported by the GIS software,this paper examines the spatial structure and evolution of major cities' accessibility in this region,and quantitatively analyzes the relationship between road and railway accessibility and population change using GAM models.The results are shown as follows.During the study periods,road accessibility of Guangzhou-Dongguan-Shenzhen line is the highest,gradually decreasing from the center to the surroundings.However,the spatial structure of railway accessibility has changed little,Guangzhou-Foshan areas are the center with the highest accessibility,and the accessibility decreases from the center to the surroundings.Evolution of land transport network in the Pearl River Delta is mainly affected by road network,and rail transport network plays a minor role in land network.There are great differences of accessibility improvement in the two research stages that demonstrate diminishing effects,and the accessibility improvement in the first stage(1988-1998) is more outstanding than that in the second stage(1998-2008).The relationship between road-railway traffic and population change is different,and roads have significant effect on population change,with its contribution rate with population change being 11.56%,48.07%,and 44.92% in the three periods,respectively.The relationship between railway and population change was weak,but after 1990,with the railway network expanded and the standard of railway transport service improved,its relationship with population change has gradually strengthened.
Location, economic potential and daily accessibility: An analysis of the accessibility impact of the high-speed line Madrid-Barcelona-French border
[J].DOI:10.1016/S0966-6923(01)00017-5 URL [本文引用: 2]
基于矢量—栅格集成法的厦深高铁影响空间分布: 以广东东部地区为例
[J].
DOI:10.18306/dlkxjz.2015.06.006
[本文引用: 1]
提升区域可达性能显著促进地区经济发展,可达性分析成为评估交通网络建设效益及制定决策的重要内容。针对传统可达性分析模型的不足,本文采用模拟精度更高的矢量—栅格集成法,以厦深高铁为例,分析高铁开通前后广东省东部区域可达性变化程度和空间分布,探讨高铁对研究区域不同尺度发展的影响。结果显示:厦深高铁显著提升区域交通可达性,但不同站点间提升程度有所差异;高铁对区域可达性影响具有显著的隧道效应,可达性变化较高的空间分布方向与厦深高铁一致;厦深高铁对区域交通可达性的公平性和区域产业发展都将产生一定影响,高铁对中小站点地区发展的刺激作用将是长期的过程。
Influence of the Xiamen-Shenzhen high-speed railways on accessibility and regional development: A case study of eastern Guangdong Province
DOI:10.18306/dlkxjz.2015.06.006
[本文引用: 1]
With the rapid development of high-speed rail (HSR) in the world, accessibility by high-speed railway has become a important topic in accessibility research. The implementation of the Xiamen-Shenzhen HSR in southern-east China offers a new option for travelers, but also influences or generates the redistribution of demographic and economic activities. This study applies an integrated method to explore the regional spatiotemporal accessibility on a Geographical Information System (GIS) platform. This method makes full use of the advantages of network analysis and cost-weighted raster analysis, and removes the limitations existed in current accessibility analysis. The research area covers seven cities in eastern Guangdong Province due to the limited availability of data. Results are as follows: (1) The Xiamen-Shenzhen HSR condenses spatial and temporal distances and improves the regional accessibility significantly. Regional average accessibility time was 1.652 hours before the operation of the rail, and this accessibility time is improved to 1.418 hour after the operation, with an increase of 14.16%. (2) The spatial structure of the accessibility change presents an "island" or "banding" shape. At the station level, the rail creates concentric rings of accessibility change, while at the regional level accessibility change are along the HSR corridor. (3) The HSR substantially modifies the map of regional accessibility by reducing travel time and brings the peripheral areas closer to the central city (Shenzhen). However, it may also produce an increase of the core-periphery imbalances. The HSR also has a potential influence on the industrial upgrading and collaboration with a shrinking distance. Finally, the stations in the core cities are the chief beneficiaries of the new spatial order. The stimulation to development around stations in small or medium cities will be a long-term process.
中国区域交通优势的甄别方法及应用分析
[J].
Discrimination method and its application analysis of regional transport superiority
DOI:10.11821/xb200808001
[本文引用: 4]
Transport infrastructure has the inherent functions to shape the regional spatial structure and determine the accessibility of all the regions,which consequently formed into the spatial configuration with different transport superiorities. Based on the review of domestic and overseas research progress, this paper presented the concept of transportation superiority from three aspects- "quality", "quantity" and "field" to reflect the scale, technical level and relative advantage of transport infrastructure. Then the paper set up the expression structure for transport superiority degree, including transport network density, influence degree of transport trunk line and transport superiority degree of location. Moreover, this paper constituted the spatial m athem atical model to evaluate transport superiority degree at the county level by utilizing GIS technology. Based on the theoretical analysis and the spatial mathem atical evaluation model, this paper studied 2,365 counties in China to analyze the spatial patterns of transport superiority degree. This study reveals that, firstly, the distribution characteristic of transport superiority degree obeys the "partial normal distribution".Few regions,which m erely account for 1.4% of the total number of counties, have prominent transport superiority degree and the traffic environment in these regions is superior for social and economic development. By contrast, one eighth of all the regions have inferior transport superiority degree and the traffic environment there is poor and im pedes local social and econom ic developm ent.The rem aining regions, which are about 70% of the country's total area, have the middle level or barely better than the middle level in transport superiority degree. Secondly, the spatial characteristic show s that the transport superiority degree decreases gradually from coast areas to inland areas. The regions of the highest transport superiority degree centralize in the Y angtze River Delta, Beijing-Tianjin-Hebei Metropolitan Area, and Pearl River Delta. The regions of the second highest transport superiority degree concentrate in Chengdu, Chongqing, and Wuhan metropolises. How ever, the spatial distribution of the second highest regions is discontinuous and the coverage of these regions is relatively sm aller than the regions w ith the highest transport superiority degree. The provincial capitals and some high-density cities/counties/towns enjoy the third highest transport superiority and follow the same spatial patterns as the regions of the second highest transport superiority. Through the above analysis, we could recognize the spatial m echanism of transport infrastructure and better understand how to leverage the advantages or circuit/change the disadvantages of transport infrastructure in regional development. Also this research may provide scientific guidance to all kinds of planning activities.
珠江三角洲陆路运输网络效率测度及其演化
[J].
Measurement of transport network efficiency and measurement and its evolution in the Pearl River Delta
西北地区交通优势度格局及空间分异
[J].
DOI:10.11867/j.issn.1001-8166.2016.02.0192.
[本文引用: 1]
以我国西北地区333个县市为评价单元,2013年为时间断面,从交通设施网络密度、交通干线影响度2个分项指标和交通优势度集成指标2个角度,分析西北地区交通优势度的空间格局及分异规律,同时探讨其交通优势度与自然、人口、经济等社会要素的空间关系。研究发现:①西北地区交通优势度呈“偏正态”分布特征,3.30%的县具有突出的交通优势,18.62%的县交通条件处于非常明显的劣势;②交通优势度具有“东部高、中西部低”的空间分异特点,关中—天水经济区、银川平原地区、兰西经济区三大城镇密集区以及各省会城市周边地区具有明显的交通优势;③各县市交通优势度和人口、经济发展水平的不同空间组合关系可分为极化型、滞后型、超前型和落后型4种,以极化型和落后型为主。极化型主要分布在中心城市及周边地区,落后型集中于准噶尔盆地、南疆、青海等地区,滞后型在银川平原、陕北地区、陕南地区、兰西经济区、河西走廊、天山北坡经济带等地区分散分布,交通不发达而区域社会经济优先发展的区域较少。
Distribution configuration and spatial differentiation of transport superiority degree in Northwest China
DOI:10.11867/j.issn.1001-8166.2016.02.0192.
[本文引用: 1]
Two individual indexes, including transport network density and transport infrastructure impact of the 333 counties level administrative units in Northwest China was chosen in this study to analyze the spatial configuration and differentiation characteristics of the transport superiority degree in Northwest China in 2013, and to discuss the spatial relationships between transport superiority degree and natural condition, population and economy. This study reveals that, firstly, the distribution characteristic of transport superiority degree obeys the “partial normal distribution”. Few regions, which merely account for 3.30% of the total number of counties, have prominent transport superiority degree and the traffic environment in these regions is superior for social and economic development. By contrast, 18.62% of all the regions have inferior transport superiority degree and the traffic environment there is poor and impedes local social and economic development. Secondly, it is characterized by a regional differentiation of “high in the east and low in the middle and west”. Guanzhong-Tianshui Economic zone, Yinchuan Plain area, Lanzhou-Xining Economic zone, the three city-and-town concentrated areas and five provincial capitals have significant transport advantages. Thirdly, there is significant linear correlation between transport superiority and population, economic development in counties, and there are four combined types: polarization type, retarded type, advanced type and behind type. The regions of the polarization type concentrate in central cities and their surrounding areas while the behind type concentrate in Junggar Basin, Southern Kumusi and Qinghai Province. The regions of the retarded type have a decentralized distribution in Yinchuan Plain, Northern Shaanxi, Southern Shaanxi, Lanzhou-Xining Economic zone, Hexi Corridor, and the Economic Belt on the Northern Slope of Tianshan Mountains. Besides, there are few counties with inferior transport superiority but have the priority to the development of social economy.
东北地区交通优势度演变格局及影响机制
[J].
DOI:10.11821/dlxb202102014
[本文引用: 2]
交通是老工业地区可持续发展的重要资源,评价和研究交通优势度的时空分异规律和机制具有重要的现实意义。本文建立了基于交通路网密度、交通干线影响度和区位优势度的综合评估体系,并以东北地区为例,通过网络分析、冷热点分析、多变量线性回归和地理加权回归等方法深入探讨了交通优势度总体空间格局及其影响因素和作用机制。结果表明:① 东北地区交通优势度总体呈上升趋势,其空间分布格局呈现以哈大线为轴的“核心—外围”结构,交通优势度高值多沿交通干线分布。② 东北地区整体交通优势度空间极化现象显著,高值区多在高铁沿线集聚,低值区在内蒙古东部及黑龙江省北部集聚,且其空间差异逐渐增加。③ 快速交通方式对东北地区交通优势度贡献高,人口承载能力对交通优势度时空分异的影响作用逐渐增强,扩充交通干线、增加交通枢纽有助于提升东北地区交通优势度水平。
The spatiotemporal differentiation and mechanisms of traffic dominance in Northeast China
DOI:10.11821/dlxb202102014
[本文引用: 2]
Traffic facilities are important resources for the future sustainable development of old industrial areas. It is of great practical significance to evaluate and study the spatiotemporal differentiation laws and mechanisms of traffic dominance. A comprehensive evaluation method based on traffic network density, traffic trunk line influence degree, and location dominance was constructed to measure traffic dominance. Taking Northeast China as the case study, the influencing factors and mechanisms of the overall pattern of traffic dominance were analyzed through network analysis, multivariable linear regression and geographic weighted regression. The results show that: (1) The overall traffic dominance of Northeast China is on the rise, and its spatial distribution pattern takes Harbin-Dalian line as the axis and presents a "core-periphery" structure. (2) The spatial differentiation of the overall traffic dominance of the study area is obvious. Most of the high value areas are concentrated along the high-speed railways, while the low value areas are mainly distributed in the east of Inner Mongolia and the north of Heilongjiang. The spatial difference is increasing gradually. (3) The fast traffic mode contributes a lot to the traffic dominance of Northeast China, and the influence of population carrying capacity on the spatiotemporal differentiation of traffic dominance is gradually strengthened. Expanding the traffic trunk lines and increasing the number of traffic hubs will help to improve the traffic dominance of Northeast China.
长三角地区交通优势度的空间格局
[J].
The pattern of transportation superiority in Yangtze River Delta
DOI:10.11821/yj2011120007
[本文引用: 2]
Based on the scale and the reality of the Yangtze River Delta,taking the county as the basic research unit,this article analyzes the pattern of transportation superiority in the Yangtze River Delta in the aspects of the highway network density,the integrated transportation accessibility and the convenience of linking with the regional key cities.Some conclusions are drawn as follows.(1) The Yangtze River Delta has one of the highest highway density in China,and the highway density of the northern part is significantly higher than that of the southern part.The units with highly integrated transportation accessibility are relatively concentrated in the areas along the transportation corridors of Shanghai-Nanjing,Shanghai-Hangzhou,and Hangzhou-Ningbo and the accessibility decreases gradually from the north to the south.Following a distinct core-periphery pattern,the links with the regional key cities are very convenient.The most convenient areas are Shanghai and its adjacent units.(2) The transportation superiority of 50% of the units are close to the regional average level,with more than half of the units having transportation superiority higher than the regional average level.On the whole,the northern part of the region has higher transportation superiority than the southern with a great difference.Shanghai has the highest transportation superiority,which is also high in the units around Shanghai.Other units with better transportation superiority are centralized in the areas along the transportation corridor of Shanghai-Nanjing,Shanghai-Hangzhou,and the Yangtze River.The transportation superiority of the units on both northern and southern edges of the Yangtze River Delta is relatively low.Based on these results,this article puts forward several proposals for the regional development in taking the advantages and avoiding the disadvantages of each specific transportation situation.
中国县域城镇化的道路交通影响因素识别及空间协同性解析
[J].
DOI:10.18306/dlkxjz.2016.07.002
[本文引用: 3]
本文基于人口普查数据和路网数据,利用空间滞后回归模型和耦合协调度模型等,对中国县域城镇化率的道路交通影响及其空间耦合协同性进行分析,研究表明:①中国县域低城镇化水平的县(区)主要集中在传统农区、集中连片贫困山区、高寒经济欠发达区。经济发展水平与人力资源空间上的错位,致使经济欠发达地区的人口倒挂,异地城市化特征显著;②中国县(区)道路交通优势度宏观上呈现出东西部区域差异和交通枢纽与外围区域的差异,“点—轴”地域结构特征显著,县域道路交通优势度数值呈现偏正态分布;③道路交通是城镇间和城镇与区域间联系的核心纽带和产业转型升级发展的传输廊道,开放式的道路系统增强了农村生产要素非农化转型的市场可介入性,对县域城镇化发展有积极作用。高速公路出口、火车站的布局对城镇化影响和带动农村要素非农化作用较为明显;④中国县域交通优势度与城镇化率耦合协调度分级分布为偏正态分布,城镇化发展与交通优势度相互影响显著,呈一定的双向耦合性。
Spatial coupling cooperative analysis of road transport superiority and urbanization at county level in China
DOI:10.18306/dlkxjz.2016.07.002
[本文引用: 3]
With the fifth and sixth census and road network data, and using a spatial interoperability evaluation model and a spatial lag model, the spatial coupling relationship between China's road transport superiority degree and urbanization rate at the county level was analyzed. The result shows that: (1) Regional difference of China's urbanization rate is significant at the county level. Urbanization rate is low in traditional agricultural areas, poor contiguous mountainous counties (districts), and the spatial mismatch between economic development and labor resources was widespread, with urbanization taking place in areas away from residents’ place of origin in underdeveloped areas. (2) Regional difference of road transport superiority degree is clear between the eastern and western regions and between the transport hubs and peripheries, with a clear “point-axis” spatial structure at the regional level. Road transport superiority degree showed a partial normal distribution at the county level. (3) The overall coverage of highways, national highways, provincial highways, and county and township roads affects road accessibility for production flow, information flow, and non-agricultural market entrance of rural production factors, which affect urbanization development at the county level. Urbanization was obviously facilitated by the presence of highway exits and railway stations. (4) The spatial interoperability grade of road transport superiority degree and urbanization rate shows a partial normal distribution, with significantly mutual influence between urbanization and road transport development levels.
区域交通资源配置效率综合评估
[J].
Comprehensive evaluation of regional traffic resource allocation efficiency
Geographical detectors‐based health risk assessment and its application in the neural tube defects study of the Heshun region, China
[J].DOI:10.1080/13658810802443457 URL [本文引用: 1]
基于地理探测器和GWR模型的中国重点镇布局定量归因
[J].
DOI:10.18306/dlkxjz.2020.10.008
[本文引用: 2]
重点镇是小城镇发展的龙头,形成科学合理的重点镇布局对优化中国城市化战略格局有重要意义。论文以2004年和2014年分别公布的1887个和3675个全国重点镇为样本,对其分布及效应的变动特征进行探究,进而在地级尺度对重点镇布局的影响因子及其作用进行地理探测和局部空间回归。结果表明:① 经增补调整,中国重点镇布局及建设效应的均衡性增强,主要集聚区西移北扩,冷热点的分布突破“胡焕庸线”,经济辐射效应的分化程度减弱,体现出政策因素的有力影响。除县际均衡和区域倾斜政策外,重点镇的分布还受到海拔高度、公路网密度、常住人口城镇化率等因子的显著作用。② 因子探测器、GWR模型和交互作用探测器的结合能更精准地刻画影响因子的作用方式、方向、路径和强度。中国重点镇的布局不是5个显著性因子均匀、独立、直接作用的结果,而是影响均具空间异质性的各因子两两交互作用后增效的产物。③ 县际均衡政策与其他因子的协同作用是形成现有重点镇分布格局的主导力量;区域倾斜政策的效果总体较好,但目标区域还需更准确。
Quantitative attribution of national key town layout based on geodetector and the geographically weighted regression model
DOI:10.18306/dlkxjz.2020.10.008
[本文引用: 2]
National key towns are the leader in the development of small towns. The formation of scientific and reasonable national key town layouts is of great significance for optimizing China's urbanization strategy. Taking the 1887 and 3675 national key towns published in 2004 and 2014 respectively as samples, this study used geodector and the geographically weighted regression (GWR) model to explore the changing characteristics of their distribution and analyze the influencing factors of national key town layouts and effects at the prefecture level. The results show that: 1) After the adjustment by the government, the balance of the layout and construction effect of national key towns is enhanced. The main gathering areas moved westward and northward, the distribution of cold spots and hotspots break through the "Hu Huanyong Line", and the degree of differentiation of economic radiation effect is weakened, reflecting the powerful influence of policy factors. In addition to the inter-county balance and regional preferential policies, the distribution of national key towns is also significantly affected by factors such as altitude, road network density, and resident population urbanization rate. 2) The combination of the factor detector, the GWR model, and the interaction detector can more accurately characterize the mode of action, direction, path, and intensity of the influencing factors. The layout of national key towns is not the result of the uniform, independent, and direct effect of the five significant factors, but the product of the synergistic effect of the interaction of the factors with spatial heterogeneity. 3) The synergy between the inter-county balance policy and other factors is the dominant force in the formation of the existing layout of the key towns; the effect of the regional preferential policy is overall positive, but the target areas need to be more accurately identified.
城市公共资源与人口分布的空间适配性分析: 以深圳市为例
[J].
Spatial fitness of urban public resources and population distribution: Taking Shenzhen as an example
中国新型城镇化与城市医疗资源空间适配性研究
[J].
DOI:10.13249/j.cnki.sgs.2021.07.007
[本文引用: 1]
为探究中国城市医疗资源配置的演化动向及与新型城镇化发展适配的影响机制,运用标准差椭圆、经济重心、泰尔指数、探索性数据分析、耦合协调度模型及动态空间杜宾模型展开研究,发现:① 医疗资源分布空间异质性明显,医疗资源配置优化和空间再组织使得城市群成为医疗资源区块式聚集形态载体。② 医疗资源空间错配现象逐渐改善,适配呈逐步均衡化,城市群的核心城市和次级中心城市外部性带动的适配组团化现象逐渐明显。③ 福利效应、需求驱动及政府引导均推动了医疗资源与新型城镇化的空间适配,而市场导向对邻近区域的影响更强。
Research on the spatial adaptability of China's new urbanization and urban medical resources
DOI:10.13249/j.cnki.sgs.2021.07.007
[本文引用: 1]
In order to explore the evolution trend and influence mechanism of the adaptation of the urban medical resources and the development of new urbanization in China, this study uses a variety of methods to conduct research, and the main conclusions are as follows: First of all, the spatial distribution of China’s medical resources has obvious spatial heterogeneity, manifested as a shift from scattered point-like distribution to regional clustered distribution, the optimization of medical resources and spatial reorganization in urban agglomerations make urban agglomerations a key gathering area, and although the distribution of medical resources is heterogeneous in space, the overall distribution is balanced. Secondly, the shift of the center of gravity of China’s medical resource allocation from 2003 to 2017 showed multiple turning characteristics, which reflected the multiple transformation process of the medical resource allocation and the development power of the medical industry, and finally the center of gravity showed a shift to the southeast, and the spatial agglomeration characteristics of medical resources show a gradually deepening characteristic, the hot spots for the allocation of medical resources have shifted from North China and East China to the south. The Beijing-Tianjin-Hebei region, the Yangtze River Delta region and the Guangdong-Hong Kong-Macao Greater Bay Area have certain advantages in the compatibility of public service functions with urban development, forming a cluster of hot spots for the allocation of medical resources. In addition, the spatial mismatch between medical resources and the development of new urbanization has gradually improved, the proportion of mismatched cities has decreased from 42.8% to 30.7%, and the spatial balance of adaptation has gradually emerged, but the rate of adaptation improvement has decreased. Under the comprehensive influence of policy environment, industrial foundation and location conditions, the phenomenon of adaptive grouping driven by the externalities of core cities and sub-central cities of urban agglomerations has gradually emerged. Finally, welfare effects, demand-driven and government guidance have all promoted the spatial adaptation of medical resources and new urbanization, while market orientation has a stronger influence on neighboring areas.
