张安琪 , 夏畅, 楚建群
ZHANG Anqi, XIA Chang, CHU Jianqun
通讯作者:
收稿日期: 2017-03-13
修回日期: 2017-07-20
网络出版日期: 2018-06-28
版权声明: 2018 地理科学进展 《地理科学进展》杂志 版权所有
基金资助:
作者简介:
作者简介: 张安琪(1992-),女,硕士研究生,主要从事土地利用与评价、地理模拟等研究,E-mail: 630331509@qq.com。
展开
摘要
随着中国城市化建设的快速推进,城市蔓延式增长和生态空间持续性萎缩成为普遍的现象,以地表硬化为主要特征的城市景观格局变化得到广泛关注,而景观扩张指数(Landscape Expansion Index, LEI)是测度这一现象的重要工具。但在新型城镇化背景下,由于大城市空间结构调整优化以及城市绿化率的提高,硬化地景观的收缩与消亡已成为城市景观演变的另一重要形式,因此亟需新的有效手段来刻画城市发展的新特征。在此背景下,本文在LEI指数的基础上,提出景观演化特征指数(Landscape Evolution Characteristic Index, LECI),尝试综合描述城镇化过程中硬化地景观斑块扩张与收缩的动态特征;并基于邻域特征计算的景观演化特征指数,包括景观演化模式识别指数(Landscape Evolution Pattern Index, LEPI)和景观演化规模指数(Landscape Evolution Area Index, LEAI),协同分析两个或多个时相景观格局演变过程中的斑块新生与消亡。本文将LECI指数应用于武汉都市发展区1990-2010年期间的城市硬化地景观演变过程中,与基于最小包围盒的景观扩张指数(LEI)对比分析,结果表明:①LEPI能准确识别不同规模和形状斑块的空间扩张模式,LEAI能够较好反映斑块扩张强度并表征景观扩张方向;②LEPI能有效识别城市景观演变中消亡斑块的湮灭模式,研究区内硬化地景观消亡现象明显加剧,可能与政府加强城市内部改造及绿化建设有关;③LECI指数变化分析发现,武汉都市发展区研究期内的城市景观扩张强度有所放缓,飞地式和边缘式空间增长构成斑块演变的主体,城市硬化地景观扩张模式在空间上呈现明显的梯度分异规律,随距主城区的远近呈现填充式/包围式、边缘式/邻接式到飞地式/孤立式的演替。
关键词:
Abstract
With the rapid urbanization, urban sprawl growth and the contraction of ecological space have become a common phenomenon in China. Ground surface hardening is the main characteristic in urban landscape expansion, which has become widely concerned. Landscape expansion index (LEI) has been an important tool to describe and quantify this process. However, in the period of new urbanization, with the adjustment and optimization of urban internal structure and the improvement of urban greening rate, the shrinkage and extinction of hardened ground landscape have been another important form of urban landscape evolution. It is urgent to find a new and effective method to describe the emerging features of urban development. Therefore, a new landscape index based on the neighborhood characteristics of patches—landscape evolution characteristic index (LECI), including landscape evolution pattern index (LEPI) and landscape evolution area index (LEAI)—is proposed to comprehensively analyze the dynamic features of the landscape pattern. Collaborative analysis can be implemented by this index to recognize the expansion and shrinkage of the hardened landscape patches during the landscape pattern evolution in two or more periods. This index also can overcome the difficulty of LEI in identifying the pattern of special shaped patches. The LECI was applied to study the urban landscape expansion of metropolitan development area in Wuhan City during 1990-2010, and compared with LEI based on minimum bounding box. The results indicate that (1) LEPI can accurately identify the three modes of urban expansion—the infilling type, the edge-expansion type, and the outlying type, as well as for the isolated type, the adjacent type, and the surrounded type of urban shrinkage, and LEAI can perfectly reflect patch expansion/shrinkage intensity and landscape expansion/shrinkage direction; (2) Patch shrinkage of the hardened ground landscapes in the study area is clearly intensified. The recognition of shrinkage modes of these patches through LEPI can reveal the spatial distribution of urban ecological restoration and contribute to the construction of urban green infrastructure and residential land remediation; (3) Based on the analysis of LECI in the study area during 1990-2010, it was found that the speed of urban landscape expansion has been slowed but still rapid, and the outlying type and edge-expansion type are the dominant modes of patch change. As the distance from the central city increases, the spatial distribution pattern of different evolution modes is clearly distinctive, which are infilling/surrounded type, edge-expansion/adjacent type, and outlying/isolated type.
Keywords:
随着中国城市化建设的快速推进,城市景观格局发生巨大变化,城市蔓延式增长和生态空间持续性萎缩成为较为普遍的现象(李素英等, 2010; 姚士谋等, 2014; He et al, 2017)。学者们利用RS、GIS等技术获取并分析城市土地利用数据,综合测度和定量化描述城市空间扩展形态与规模(林坚, 2009; 车前进等, 2011; 关兴良等, 2012; 李昕等, 2012; Jaeger et al, 2014; 王海军等, 2016),其中,景观扩张指数(Landscape Expansion Index, LEI)在研究城市景观格局动态演变、扩展模式与特征中得到很好的应用(Shi et al, 2012; Liu et al, 2014; Tian et al, 2014)。由刘小平等(2009)提出的LEI指数可描述城市景观格局演变过程中斑块类型的动态变化与发展形态,并将城市景观扩张空间模式识别为填充式、边缘式和飞地式(Wilson et al, 2003)。此后,学者们对LEI指数提出改进,通过缓冲区或先验判断等解决该指数对特殊形状斑块扩张模式识别错误的问题(Liu et al, 2010; 钱敏等, 2015),同时实现对斑块空间扩张规模的定量表达(武鹏飞等, 2012),以及基于多时间节点数据的多时相景观扩张指数(Jiao et al, 2015),这些研究有效地扩展了城市景观格局演变分析的研究方法和手段。
城镇化过程的主要特征是地表硬化(李伟峰等, 2008),它是影响城市生态环境质量的重要因素。城市用地既包括硬化不透水的建设用地,也包括可透水的水体和绿化用地等。以往,以地表硬化为代表的其他用地向建设用地的单向转变,得到普遍的关注(蒋芳等, 2007; 岳德鹏等, 2007; Fan et al, 2014; Jiao, 2015; 陈凯等, 2015; 詹云军等, 2017),而景观扩张指数LEI则是刻画该现象的主要方法。近年来,伴随着城镇化的快速推进,全球化、去工业化、郊区化等导致中国部分城市与地区出现城市收缩现象。与城市增长一样,城市收缩是城市发展过程中具有规律性的正常现象 (Haase et al, 2012; Lauf et al, 2014; 高舒琦, 2015; 杨振山等, 2015)。合理精简城市规模,通过绿色基础设施规划和改造闲置建筑与土地等,成为应对城市收缩的重要手段(龙瀛等, 2015; 周恺等, 2015)。城市内部绿化率的提高与空间结构调整优化,使得城市硬化地景观的收缩和消亡现象越来越普遍,硬质化地向其他用地类型转移应得到更为广泛的关注。因此,亟需开展城市发展过程中硬化地景观的双向转变研究,在研究城市空间外延的同时,分析城市内部结构的调整变化,有利于全面认知城市景观格局的演变过程。同时,识别城市硬化地斑块的湮灭模式及其消亡特征意义重大,可体现城市景观收缩变化在空间上的分布,从侧面揭示城市生态修复的空间布局特征,具有“预警性”和“启示性”。但现有的研究中有关城市硬化地景观缩减和消亡的研究成果仍较少,也缺乏有效的定量化指数用于判断和分析相应现象,而景观扩张指数虽能识别城市空间扩张模式,并反映城市演变的客观规律,但它仅考虑景观类型转移的单向变化,难以描述现今城市发展出现的新特征。
为此,本文试图对已有的景观扩张指数作出改进,提出一种新的指数——景观演化特征指数(Landscape Evolution Characteristic Index, LECI),在计算和识别城市景观斑块增长规模与空间扩展模式的过程中,协同分析斑块的增长与消亡现象,获取景观变化的过程信息,并通过与基于最小包围盒的景观扩张指数(LEI) (刘小平等, 2009; 周翔等, 2014)的对比分析,验证其有效性与合理性。
景观格局是在自然和人文双重因素的作用下,为适应特定景观功能要求、景观斑块在空间上动态分布与组合所构成的景观整体结构(Gustafson, 1998)。景观斑块演变的主要类型包括:新生、消亡、生长、收缩、融合、分裂和混合等(O'Neill et al, 1988; Crist et al, 2000; Luck et al, 2002; 陈虹等, 2008; 张阳阳等, 2010)。景观指数能描述特定时相下景观的静态特征(Manicacci et al, 1992; Doak et al, 1994; 陈文波等, 2002; 何鹏等, 2009; Teng et al, 2016),应用广泛(Skinner, 1995; Ricotta et al, 1999; Smits et al, 1999; 何原荣等, 2008; 林孟龙等, 2008; 游丽平等, 2008; 高艳等, 2010),但难以有效表达景观格局演变的动态信息。学者们在景观指数的基础上提出的景观扩张指数,以斑块的最小包围盒(刘小平等, 2009)或缓冲区(Liu et al, 2010)为统计单元计算,对景观指数进行重要的补充和发展。本文结合新时期城市发展中生态空间增多、建设空间腾退“还绿”等新情况,重点针对硬化地演变,进一步提出景观演化特征指数,既识别传统的硬化地景观增长模式,又观察硬化地景观的湮灭模式,并能定量描述不同情形下的转化规模。
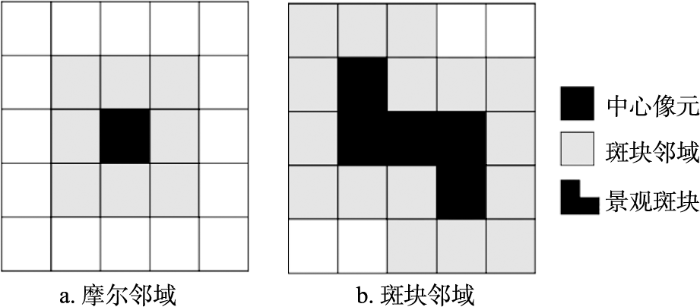
景观演化特征指数(LECI)是基于斑块的邻域特征而定义的,可利用遥感影像数据计算得到,包括景观演化模式识别指数(Landscape Evolution Pattern Index, LEPI)和景观演化规模指数(Landscape Evolution Area Index, LEAI)。斑块邻域是指构成该斑块的所有像元八邻域的集合,每个斑块都有自己的邻域(图1)。LECI最小统计单元为遥感影像的像元,它保持了景观斑块与遥感影像像元分布特征的一致性,与采用最小包围盒(刘小平等, 2009)和缓冲区(Liu et al, 2010)计算的LEI指数相比,采用领域计算的LECI充分利用了遥感影像的数据精度,最大程度上保证了对数据的正确解读。利用最小包围盒计算的LEI指数,斑块形状会对识别结果产生影响,可能出现对斑块扩张模式的错误识别(武鹏飞等, 2012);利用缓冲区计算的LEI指数,其敏感度受到遥感影像分辨率(例如30 m)的影响,当缓冲距离设置过小或为0时,会导致对飞地式斑块的过高估计;若缓冲区增加至30 m以上时,LEI会发生显著改变,因此确定合理的缓冲区半径是有意义的,但同时也是困难且极具争议的(Jiao et al, 2015)。
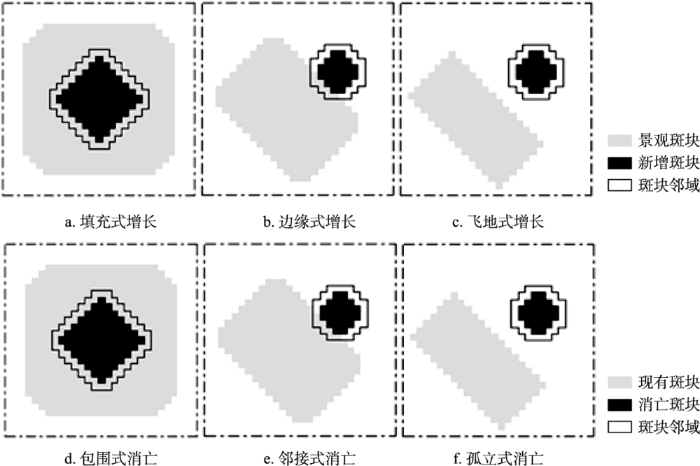
本文将景观扩张模式划分为新增斑块的增长模式和消亡斑块的湮灭模式两大类,其中增长模式包括飞地式、边缘式和填充式(图2a-2c),湮灭模式包括孤立式、邻接式和包围式(图2d-2f)。
图2 景观演化的空间模式(a-c为斑块增长模式,d-f为斑块湮灭模式)
Fig.2 Landscape evolution types (a-c: patch expansion modes, d-f: patch shrinkage modes)
图2a-2c和图2d-2f分别对应景观扩张过程中斑块增长模式和湮灭模式。填充式增长斑块(图2a)和包围式消亡斑块(图2d)邻域中原有景观占主导;边缘式增长斑块(图2b)和邻接式消亡斑块(图2e)邻域内原有景观与其他景观并存;飞地式新增斑块(图2c)和孤立式消亡斑块(图2f)邻域内主要为其他景观。基于邻域特征定义景观演化模式识别指数(LEPI):
$LEPI = (-1)^{\lambda} \times \frac{N_0 + N^*}{N} \times 100$% (1)
式中:
景观演化规模指数(LEAI)可分为斑块级别(Patch)和景观级别(Landscape)。斑块级别的斑块演化规模指数(Patch Evolution Area Index, PEAI),将其定义为景观演化过程中每一新增(消亡)斑块面积与新增(消亡)斑块总数的乘积同新增(消亡)斑块总面积的比值。
$PEAI_i = (-1)^{\lambda}\frac{S_i \times k}{S} \quad (2)$
式中:
景观级别的LEAI指数,包括景观演化规模增长指数(Landscape Evolution Area Increase Index, LEAII)和景观演化规模衰减指数(Landscape Evolution Area Reduce Index, LEARI),定义如下:
$LEAI = LEAII - LEARI = \frac{S_{increase}}{S_0} - \frac{S_{reduce}}{S_0} = \frac{S_t - S_0}{S_0} \quad (3)$
式中:S0和St分别代表所研究景观起始时刻(t0)的斑块总面积和t时刻的斑块总面积;Sincrease、Sreduce分别为(t0, t)时间段内所有增长斑块和消亡斑块总面积。LEAI指数可反映研究时段内景观总规模的变动情况:当LEAI指数<0时,景观在研究时段内收缩;当LEAI指数>0时,景观在研究时段内扩张;当LEAI指数=0时,景观在研究时段内总面积保持不变。
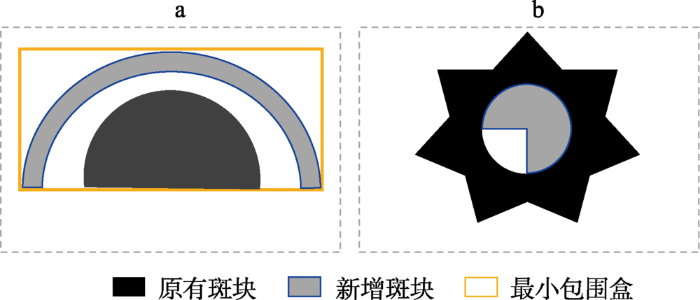
现有景观扩张指数,虽弥补了景观指数在分析景观动态格局演变中的不足,但在反映斑块扩张规模及对特殊形状的斑块识别(图3)等方面仍存在缺陷,主要是指数过于简单、功能较为单一、对特定形状斑块可能存在错分、漏分等问题;同时侧重于对景观扩张过程中斑块的增长规模及其空间扩展模式的分析,忽略了景观演变过程中普遍存在的斑块消亡与湮灭现象。
而景观演化特征指数(LECI)具有以下特征:一是能判定景观消亡模式。景观演化既应包括景观斑块的新生与增长,同时也应包括斑块的收缩与消亡。而随着景观格局趋于稳定,景观由空间扩展逐渐转为小尺度上的格局优化,景观斑块消亡现象的研究将具有更为重要的意义。二是能实现对特殊形状斑块空间演化模式的识别,同时描述斑块演化规模。三是基于邻域定义的景观演化特征指数最小统计单元为遥感影像数据的像元。
研究区为武汉都市发展区①(① 武汉市都市发展区是在《武汉市城市总体规划(2010-2020年)》中划定的城市功能主要集聚区和城市空间重点拓展区。),以研究区内硬化地景观演变为例,分别采用基于邻域的景观演化特征指数(LECI)与基于最小包围盒的景观扩张指数(LEI)(刘小平等, 2009)分析研究区内硬化地扩张过程中斑块演化状况,并进行对比验证。武汉市地处中国的地理中心,转南接北,承东启西,是中国重要交通枢纽,又因湖泊众多,江河纵横被称为“江城”。长江及其最大支流汉水将武汉城区划分为汉口、汉阳和武昌。
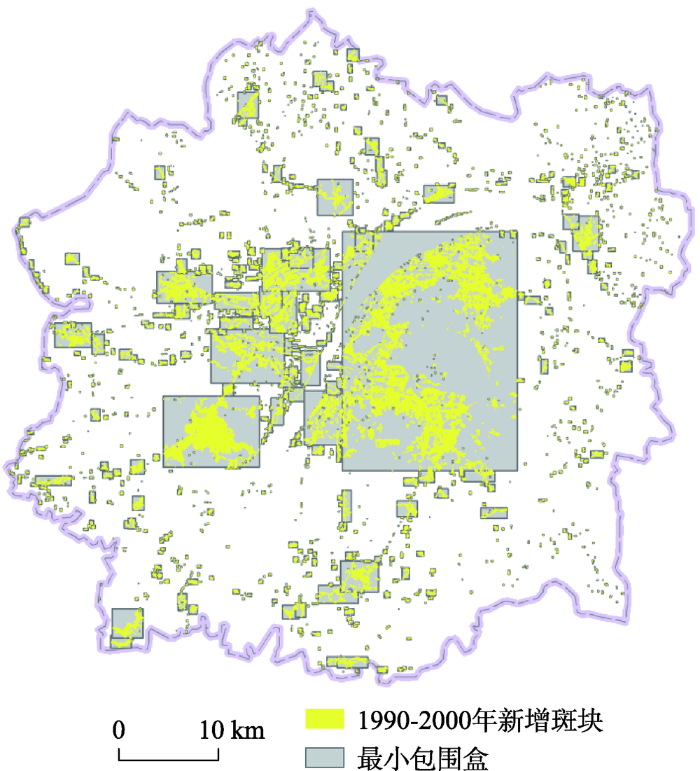
本文基于1990、2000和2010年武汉市TM遥感影像数据(30 m×30 m),采用ENVI5.0进行遥感影像的预处理与监督分类,分类精度达到90%以上,获取研究区内各个时期的城市硬化地景观的空间分布数据。利用ArcGIS 软件的叠置分析工具提取武汉市1990-2000年、2000-2010年两个时期的城市硬化地景观演变信息(新增斑块图层与消亡斑块图层),基于演化斑块的邻域特征求取景观演化特征指数LECI,并构建扩张斑块的最小包围盒(图4)求取景观扩张指数LEI。其中,基于最小包围盒的LEI指数计算主要参考刘小平等(2009)的方法,文中不再过多描述。本案例主要研究城市景观演替过程中硬化地景观斑块向其他景观(如绿地景观等)转化的过程,但该方法同样适用于其他景观类型演变过程的研究。为简化表达,后文中的“景观斑块”、“现有斑块”、“新增斑块”、“消亡斑块”等均指代城市硬化地斑块。
图4 1990-2000年新增斑块的最小包围盒
Fig.4 Envelopes for capturing urban expansion types between 1990 and 2000
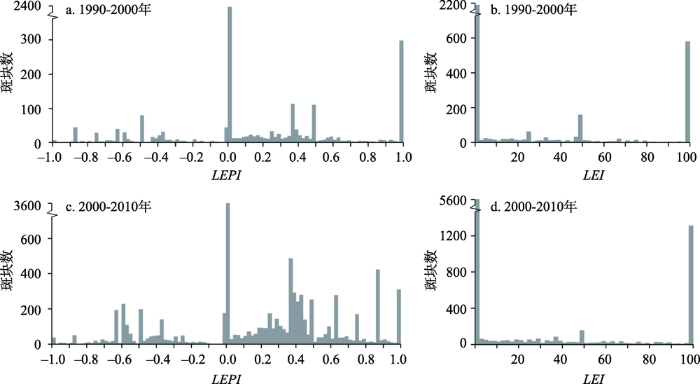
观察不同时段武汉市都市发展区内的城市硬化地景观演化模式识别指数分布直方图(图5)可以发现,描述斑块增长的LEI和LEPI指数分布具有明显的峰值,而描述斑块消亡的LEPI指数取值则较为分散。采用自然断点法将硬化地景观演化模式识别指数的取值分为三类,以确定不同景观演化模式的划定标准(表1)。
图5 1990-2000年和2000-2010年城市硬化地景观演化模式识别指数分布频数直方图
Fig.5 Robustness of landscape evolution pattern index (LEPI) and landscape expansion index (LEI) based on histograms for 1990-2000 and 2000-2010
表1 用自然断点法划定的不同硬化地景观扩张模式下模式识别指数的取值区间
Tab.1 Interval of different landscape expansion patterns defined by natural breakpoint method
| 城市扩张/消亡模式 | 1990-2000年 | 2000-2010年 | 取值区间 | ||||||
|---|---|---|---|---|---|---|---|---|---|
| LEI | LEPI | LEI | LEPI | LEI | LEPI | ||||
| 消亡模式 | 包围式 | — | [-1.00, -0.60) | — | [-1.00, -0.53) | — | [-1.00, -0.57) | ||
| 邻接式 | — | [-0.60, -0.25) | — | [-0.53, -0.22) | — | [-0.57, -0.24) | |||
| 孤立式 | — | [-0.25, -0.00] | — | [-0.22, -0.00] | — | [-0.24, -0.00] | |||
| 扩展模式 | 飞地式 | [0.00, 22.22] | [0.00, 0.22] | [0.00, 22.22] | [0.00, 0.20] | [0.00, 22.22] | [0.00, 0.21] | ||
| 边缘式 | (22.22, 68.09] | (0.22, 0.69] | (22.22, 70.27] | (0.20, 0.59] | (22.22, 69.18] | (0.21, 0.64] | |||
| 填充式 | (68.09, 100.00] | (0.69, 1.00] | (70.27, 100.00] | (0.59, 1.00] | (69.18, 100.00] | (0.64, 1.00] | |||
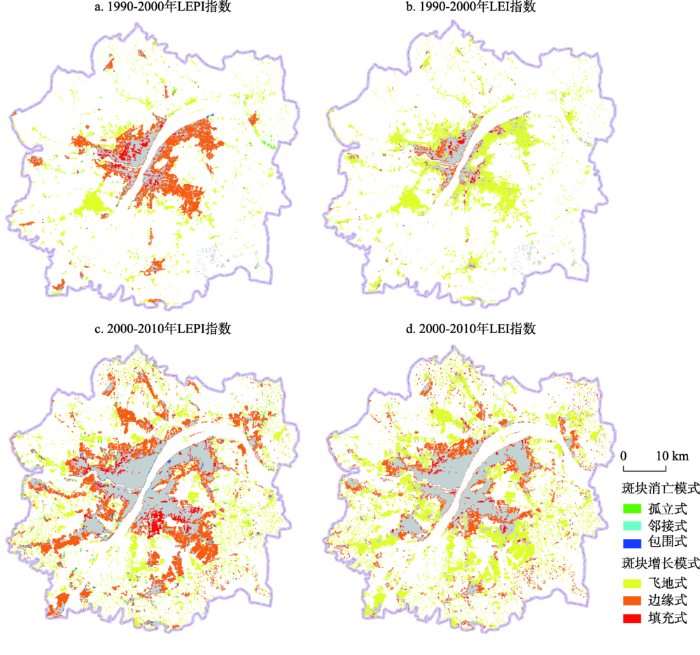
根据设定的景观演化模式分割阈值,可识别研究区硬化地景观的演化模式。总体来看,武汉城市化进程伴随着硬化地景观斑块的快速增长和局部斑块的收缩与消亡。1990-2010年间,研究区内城市硬化地景观依托主城区、交通干线向外扩张明显,斑块增长模式沿主城区向外围规律变换(图6),同时也存在局部的硬化景观斑块向其他景观类型转变(图6a, 图6c)。在武汉市硬化地景观演变过程中,填充式增长和包围式消亡的斑块零散地分布于主城区内部和城市边缘区;边缘式增长和邻接式消亡斑块多成片集中分布在城市边缘区;飞地式增长与孤立式消亡斑块数量多面积小,远离主城规划区散落分布。景观扩张模式随距主城区距离的远近,出现从填充式/包围式、边缘式/邻接式到飞地式/孤立式的演替,在空间上呈现明显的梯度分异规律。
图6 1990-2000年和2000-2010年硬化地斑块演化模式识别
Fig.6 Spatial distribution of six patch evolution types in 1990-2000 and 2000-2010
分析2000-2010年硬化地景观扩张过程中的两个斑块消亡案例(表2),验证LEPI指数的合理性。案例1所示斑块位于武汉市园博园区内。1998年为解决汉口地区的垃圾污染问题兴建金口垃圾场,此地后经整治成为世界上最大的填埋场生态修复成功案例(曹丽等, 2016),并作为2015年园博会主会场。该斑块在2000-2010年间由硬化地转变为可透水用地,被LEPI指数识别为邻接式消亡。案例2所示斑块位于现武汉市环金银湖绿地景观内。武汉市在快速城镇化过程中,填湖造地等行为使得湖泊的生态环境遭到严重破坏,2000年前该斑块被开发为硬化地。2001年金银湖公园开始建设,并被列入首批国家城市湿地公园名单,促使该区域生态环境得到良好的改善和保护。2000-2010年间案例2中的硬化地斑块发生孤立式消亡。
将基于邻域的LEPI指数与基于最小包围盒计算的LEI指数进行对比分析,可以得到:
(1) LEPI指数识别新增斑块扩张模式的准确度更高。LEI指数分布更为聚集,组间差异明显,但不能反映新增斑块与原有斑块间的邻接性;LEPI指数相对于LEI指数信息更为丰富,能体现新增斑块(消亡斑块)与原有斑块的相邻程度,LEPI指数值越大说明新增斑块(消亡斑块)邻域内原有斑块面积越大,两者邻接更为紧密,反之则更为松散(图5)。同时,两个研究时间段内,紧邻实验区东部和东北部的区域,存在大规模紧邻原有硬化地景观向外延伸出的新增斑块,LEPI指数中其被准确识别为邻接式增长;而由于斑块面积较大,形状复杂,所得最小包围盒覆盖范围大(图4),这些斑块在LEI指数中被识别为飞地式(图6)。
(2) LEPI指数能准确地识别消亡斑块的湮灭模式。根据景观扩张模式识别指数,研究区消亡斑块的湮灭被准确识别为三种模式(图6)。由于城市内部改造,公园绿地等的建设,在主城区内部以包围式和邻接式为主的斑块消亡是规划引导下的“被动消亡”;而在城市远郊,以孤立式为主的零散小斑块消亡大多为顺应区域发展的“主动消亡”。主城区边缘及远离主城区散落分布的斑块是容易发生自然消亡的斑块,而“被动消亡”斑块的分布受到规划制约,它的消亡并不具有普遍性。但规划政策指引下的武汉市消亡斑块多分布于湖泊沿岸、道路两侧,一定程度上能从侧面揭示出规划中城市生态修复的空间布局特征,可为城市内部绿色基础设施建设、居民用地整治等提供参考依据。
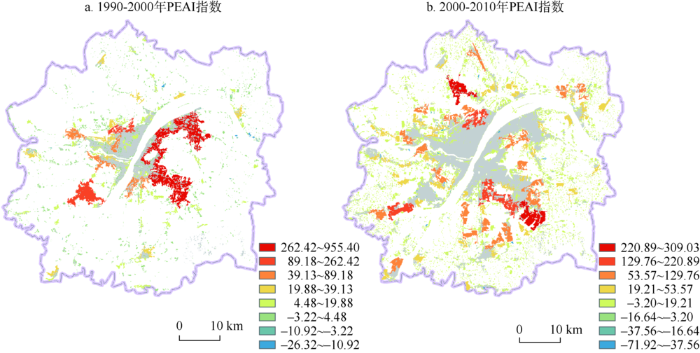
斑块演化规模指数适用于同一时点下研究区内斑块间的比较,研究时段内硬化地景观的PEAI指数空间分布如图7所示。1990-2000年间,研究区硬化地景观沿河流和主干道向南和向东扩张明显;而2000-2010年,研究区在沿主干道向南进一步扩张的同时,向西扩张趋势也明显增强,此外在主城区东部还表现出明显的沿湖扩张趋势。景观级别的演化规模指数LEAI可以反映不同时段内景观演化规模的差异。研究的两个时段相比,LEAI指数显著下降(表3),但新增斑块总面积由289 km2增至545 km2,说明整体扩张强度虽有所放缓,但仍表现出高速扩张的特征。而在总面积增加的情况下,LEARI指数仍有明显上升,且主城区内消亡斑块面积明显增加(表4),说明收缩和消亡斑块的负贡献率有所上升且有加速趋势。依据武汉市发展规划与实际建设状况,2000年后全市有更多的硬化地景观地发生转移,城市发展逐渐向内部空间改造转型,城市绿化状况明显提升,居民点改造稳步推进,这与景观指数识别结果相一致。
图7 1990-2000年和2000-2010年硬化地斑块演化规模
Fig.7 Spatial distribution of landscape evolution area indices in 1990-2000 and 2000-2010
表3 硬化地景观斑块扩张规模指数
Tab.3 Landscape expansion area indices
| 1990-2000年 | 2000-2010年 | |
|---|---|---|
| LEAII | 2.153 | 1.298 |
| LEARI | 0.031 | 0.036 |
| LEAI | 2.121 | 1.262 |
在两个研究时段内,飞地式扩张在研究区的新增斑块中均占据绝对数量优势,但斑块规模普遍较小;边缘式增长斑块数量少,但其面积增长贡献率大,在研究区硬化地景观扩张中占据绝对主导;而填充式增长斑块数量少且总面积最小,两个时期各增长模式面积占比变化不大(表4)。分析研究区城市硬化地景观的局部收缩与消亡现象发现,研究区前一时段以孤立式消亡和邻接式消亡为主,而后一时期邻接式消亡和包围式消亡所占比重明显提升,且相对于1990-2000年,2000-2010年消亡斑块的数量(图5)和面积显著增加。
表4 不同硬化地斑块扩张模式面积占比
Tab. 4 Area proportion of different evolution types
| 时期 | 1990-2000年 | 2000-2010年 |
|---|---|---|
| 斑块增长 |  |  |
| 斑块消亡 |  |  |
城市硬化地景观斑块的收缩实质是城市建设用地和居民用地复垦与整治的过程,景观水平上则表现为相对零散的小斑块向较大斑块“漂移”,或直接消亡,在城区多转化为绿化用地,一定程度上源于城市化进程中人们对生态系统服务功能需求的提升。城市绿色空间建设是改进城市景观生态合理性的有效途径,因此,城市收缩为城市景观规划的改进提供契机。通过对城市景观扩张过程中消亡斑块的识别,有利于全面认识城镇化过程中城市景观的演变模式和趋势,为制定更为科学理性的城市规划方案提供依据。
在以往快速城市化的背景下,城市空间外延扩张是主要方式。景观扩张指数突破了景观指数只能描述特定时相下景观静态特征的局限,侧重识别景观扩张过程中新增斑块的空间扩展模式和规模,实现了对景观扩张过程的描述。但是,随着建设可持续发展的花园城市、绿色生态宜居城市,城市发展面临由空间扩张向内部改造的转型(仇保兴, 2009),城市收缩以及硬化地斑块的消亡越发普遍。针对现有指数在表达城市硬化地景观演变过程中消亡斑块或湮灭斑块的不足,本文设计了基于邻域的景观演化特征指数(LECI),重点用于刻画城市硬化地斑块新生与消亡的双重过程。以1990-2000年和2000-2010年的武汉都市发展区为对象进行研究,发现同景观扩张指数(LEI)相比较,可得出如下结论:
(1) 基于邻域计算的景观演化特征指数LECI,其最小统计单元为遥感影像的像元,它保持了景观斑块与遥感影像像元分布特征的一致性,能准确地判别不同形状、规模斑块的空间演化模式。景观演化模式指数LEPI相对于LEI指数的取值分布更为离散,能反映新增斑块(消亡斑块)与原有斑块的关联关系,LEPI指数值越大说明新增斑块(消亡斑块)与原有斑块邻接更为紧密,反之则更为松散。LEAI指数可识别不同规模斑块的空间分布并表征景观扩张方向,能准确地描述城市扩展特征。
(2) 景观演化模式指数LEPI能实现对硬化地消亡斑块湮灭模式的准确识别,是对传统景观格局演变分析方法的有效补充与完善。通过LEPI指数对斑块湮灭模式的识别,能得到容易向其他景观转移的硬化地分布特征,一定程度上能从侧面揭示规划中城市生态修复的空间布局特征,可为城市内部公园绿地建设、制定农村居民点整理方案等提供参考依据。
(3) 在研究时段内,研究区城市硬化地景观扩张强度虽有所放缓,但仍表现出高速扩张的特征,城市硬化地景观依托主城区、交通干线向外扩张明显,飞地式和边缘式两类空间扩展模式构成斑块演变的主体,同时研究区城市化过程中尽管以斑块增长为主,但也存在少量的硬化地景观向其他景观转变的局部收缩与消亡,且有加速趋势。在硬化地总面积增加的情况下,LEAI指数显著下降,LEARI指数仍有明显上升趋势,而主城区内部规划引导下的“被动消亡”斑块面积不断增大,这与武汉市城市规划逐渐加强城市绿化建设并稳步推进居民用地改造等密切相关。研究时段内城市硬化地景观扩张模式随距主城区距离的远近,出现从填充式/包围式、边缘式/邻接式到飞地式/孤立式的演替,在空间上呈现明显的梯度分异规律。
The authors have declared that no competing interests exist.
| [1] |
垃圾填埋场: 世界最大的生态修复案例: 以武汉市金口垃圾填埋场为例 [J].https://doi.org/10.3969/j.issn.1008-2271.2016.03.004 URL [本文引用: 1] 摘要
正本文介绍了武汉市金口垃圾填埋场502万立方库区通过好氧生物反应器,加速老填埋场稳定化的生态修复技术。这一工程是世界范围内迄今为止规模最大的老填埋场生态修复的成功案例。修复后的填埋场减少了对周边的环境污染,成为第十届中国国际园林博览会场址,具有显著的环境效益、社会效益和经济效益。一、引言我国生活垃圾无害化处理是从20世纪80年代起步的。长期以来,我国大多数城市解决生活垃圾的出路,大都以填埋作为最主要的方法。由于受经济发展水平的限制和技术的制约,很多大
Laji tianmaichang: Shijie zuida de shengtai xiufu anli: Yi Wuhanshi Jinkou laji tianmaichang weili [J].https://doi.org/10.3969/j.issn.1008-2271.2016.03.004 URL [本文引用: 1] 摘要
正本文介绍了武汉市金口垃圾填埋场502万立方库区通过好氧生物反应器,加速老填埋场稳定化的生态修复技术。这一工程是世界范围内迄今为止规模最大的老填埋场生态修复的成功案例。修复后的填埋场减少了对周边的环境污染,成为第十届中国国际园林博览会场址,具有显著的环境效益、社会效益和经济效益。一、引言我国生活垃圾无害化处理是从20世纪80年代起步的。长期以来,我国大多数城市解决生活垃圾的出路,大都以填埋作为最主要的方法。由于受经济发展水平的限制和技术的制约,很多大
|
| [2] |
长江三角洲地区城镇空间扩展特征及机制 [J].https://doi.org/10.11821/xb201104002 URL [本文引用: 1] 摘要
城镇空间扩展是城市化作用于地理空间的直接结果,揭示城镇空间扩展过程、格局及机制已成为识别城镇发展阶段、认知城镇发展规律的有效手段。基于长江三角洲地区多时相卫星遥感影像数据,以城镇用地扩展空间分异与关联特征为切入点,利用间隙度指数、分形维数、扩展强度指数、扩展速度指数和空间关联模型,定量揭示了区域城镇空间扩展特征的多样性、空间组织异质性和"热点区"格局演化。结果表明:20世纪80年代以来,长三角洲地区城镇空间扩展在以中心城市集聚为主导的过程中,遵循"小集聚,大分散"的特点,围绕"Z"形区域发展轴线,大致经历了点轴扩展、沾粘式增长和蔓延扩张的过程,区域融合现象凸显;空间扩展的"热点区"格局不断演化,"热点区"的核心集聚作用在减弱,沪宁沿线、沪杭沿线、杭甬沿线和沿江地区成为驱动长三角城镇社会经济发展的核心区;同时,在城镇空间扩展的不同阶段,驱动机制有所差异,经济全球化和区域城市化推动着长三角城镇空间一体化进程。
Urban spatial expansion process, pattern and mechanism in Yangtze River Delta [J].https://doi.org/10.11821/xb201104002 URL [本文引用: 1] 摘要
城镇空间扩展是城市化作用于地理空间的直接结果,揭示城镇空间扩展过程、格局及机制已成为识别城镇发展阶段、认知城镇发展规律的有效手段。基于长江三角洲地区多时相卫星遥感影像数据,以城镇用地扩展空间分异与关联特征为切入点,利用间隙度指数、分形维数、扩展强度指数、扩展速度指数和空间关联模型,定量揭示了区域城镇空间扩展特征的多样性、空间组织异质性和"热点区"格局演化。结果表明:20世纪80年代以来,长三角洲地区城镇空间扩展在以中心城市集聚为主导的过程中,遵循"小集聚,大分散"的特点,围绕"Z"形区域发展轴线,大致经历了点轴扩展、沾粘式增长和蔓延扩张的过程,区域融合现象凸显;空间扩展的"热点区"格局不断演化,"热点区"的核心集聚作用在减弱,沪宁沿线、沪杭沿线、杭甬沿线和沿江地区成为驱动长三角城镇社会经济发展的核心区;同时,在城镇空间扩展的不同阶段,驱动机制有所差异,经济全球化和区域城市化推动着长三角城镇空间一体化进程。
|
| [3] |
南京城市扩展过程中聚落斑块的行为特征 [J].Behavioral characteristics of settlement patches in urbanization of Nanjing [J]. |
| [4] |
基于随机森林的元胞自动机城市扩展模拟: 以佛山市为例 [J].Urban expansion simulation by random-forest-based cellular automata: A case study of Foshan city [J]. |
| [5] |
景观指数分类、应用及构建研究 [J].
在景观生态学研究中,理解与把握景观格局变化的生态学原则至关重要.用景观指数描述景观格局及变化,建立格局与景观过程之间的联系,是景观生态学最常用的定量化研究方法.本文在综合前人对景观指数的基础上,对景观指数研究从景观指数的分类研究、指数对景观格局的描述研究、指数之间的相关性研究及指数构建研究等4方面进行了总结,并从单个景观指数与指数体系两个层次上提出了判定景观指数优劣及景观指数应用的一般性原则.
Classification, application, and creation of landscape indices [J].
在景观生态学研究中,理解与把握景观格局变化的生态学原则至关重要.用景观指数描述景观格局及变化,建立格局与景观过程之间的联系,是景观生态学最常用的定量化研究方法.本文在综合前人对景观指数的基础上,对景观指数研究从景观指数的分类研究、指数对景观格局的描述研究、指数之间的相关性研究及指数构建研究等4方面进行了总结,并从单个景观指数与指数体系两个层次上提出了判定景观指数优劣及景观指数应用的一般性原则.
|
| [6] |
收缩城市研究综述 [J].A review of researches on shrinking cities [J]. |
| [7] |
空间粒度变化及土地利用分类对景观指数的影响: 以山西省闻喜县为例 [J].https://doi.org/10.3724/SP.J.1011.2010.01076 URL Magsci [本文引用: 1] 摘要
以山西省闻喜县为例, 利用该县1∶10 000土地利用现状图作为数据源, 应用GIS技术以及景观格局软件Fragstats, 研究了土地利用类型数不同时景观格局指数的空间粒度效应和不同粒度下土地利用类型数对景观指数的影响。结果表明: 随粒度增加, 斑块密度、景观形状指数、景观聚集度呈逐渐下降趋势, 且下降幅度逐渐减小, 周长面积比分维数总体呈上升趋势, 最大斑块指数和Shannon多样性指数无明显变化。随土地利用类型数目的增多, 斑块密度、景观形状指数、Shannon多样性指数呈阶梯式上升趋势, 最大斑块指数呈阶梯式下降趋势, 周长面积比分维数无明显变化, 景观聚集度的变化曲线比较复杂。
Effect of changing spatial grain size and land-use classification on landscape index: A case study of Wenxi County, Shanxi Province [J].https://doi.org/10.3724/SP.J.1011.2010.01076 URL Magsci [本文引用: 1] 摘要
以山西省闻喜县为例, 利用该县1∶10 000土地利用现状图作为数据源, 应用GIS技术以及景观格局软件Fragstats, 研究了土地利用类型数不同时景观格局指数的空间粒度效应和不同粒度下土地利用类型数对景观指数的影响。结果表明: 随粒度增加, 斑块密度、景观形状指数、景观聚集度呈逐渐下降趋势, 且下降幅度逐渐减小, 周长面积比分维数总体呈上升趋势, 最大斑块指数和Shannon多样性指数无明显变化。随土地利用类型数目的增多, 斑块密度、景观形状指数、Shannon多样性指数呈阶梯式上升趋势, 最大斑块指数呈阶梯式下降趋势, 周长面积比分维数无明显变化, 景观聚集度的变化曲线比较复杂。
|
| [8] |
武汉城市群城镇用地空间扩展时空特征分析 [J].https://doi.org/10.11849/zrzyxb.2012.09.002 URL Magsci [本文引用: 1] 摘要
基于Landsat影像数据,利用遥感和GIS技术获取了武汉城市群地区3个阶段(1980—1990、 1990—2000、 2000—2010年) 的城镇用地信息,采用城镇扩展指数和城镇扩展模型分析了城镇用地扩展的时空格局、 过程及其驱动力。结果表明:①武汉城市群城镇用地空间迅速扩张,三个时段内的城镇扩展强度指数依次为0.073 2、 0.028 9和0.099 3,呈现显著的阶段性与波动性特征;②城镇用地扩展格局具有明显的空间集中性,主要表现为以武汉为扩展中心的圈层状形态,沿武汉三环、 京广线等交通干道的轴带分布形态,不同阶段的扩展格局各具特质;③城镇用地扩展呈现"一核四带"、 "一核一带"和"三核六带"的空间扩展轨迹,与经济发展的阶段性具有明显的耦合关系;④经济体制改革、 国家非均衡发展战略、 "两型"社会建设以及长江黄金水道、 京广大动脉等交通干道建设是武汉城市群地区城镇用地变化的主要驱动因素,但各时期的主导驱动机制有所差别。
Spatial and temporal characteristics of spatial expansion of urban land in Wuhan urban agglomeration [J].https://doi.org/10.11849/zrzyxb.2012.09.002 URL Magsci [本文引用: 1] 摘要
基于Landsat影像数据,利用遥感和GIS技术获取了武汉城市群地区3个阶段(1980—1990、 1990—2000、 2000—2010年) 的城镇用地信息,采用城镇扩展指数和城镇扩展模型分析了城镇用地扩展的时空格局、 过程及其驱动力。结果表明:①武汉城市群城镇用地空间迅速扩张,三个时段内的城镇扩展强度指数依次为0.073 2、 0.028 9和0.099 3,呈现显著的阶段性与波动性特征;②城镇用地扩展格局具有明显的空间集中性,主要表现为以武汉为扩展中心的圈层状形态,沿武汉三环、 京广线等交通干道的轴带分布形态,不同阶段的扩展格局各具特质;③城镇用地扩展呈现"一核四带"、 "一核一带"和"三核六带"的空间扩展轨迹,与经济发展的阶段性具有明显的耦合关系;④经济体制改革、 国家非均衡发展战略、 "两型"社会建设以及长江黄金水道、 京广大动脉等交通干道建设是武汉城市群地区城镇用地变化的主要驱动因素,但各时期的主导驱动机制有所差别。
|
| [9] |
常用景观指数的因子分析和筛选方法研究 [J].Study on factor analysis and selection of common landscape metrics [J]. |
| [10] |
基于SPOT影像与Fragstats软件的区域景观指数提取与分析 [J].https://doi.org/10.3969/j.issn.1671-3044.2008.01.005 URL [本文引用: 1] 摘要
景观指数是衡量区域景观质量的重要参数,也是进行区域生态规划、管理和恢复的重要信息依据。针对传统已有的矢量地图信息源及Excel、SPSS软件在景观指数计算中存在的不足和不便之处,研究了在ENVI 4.2下,基于高分辨率SPOT-5遥感影像的自动景观分类及Fragstats3.3软件支持下的景观指数自动提取的计算方法,以屈原农场为例进行了实验研究,制作了景观现状图和计算部分景观指数。实验表明:该方法对景观质量的评价信息获取效率高、时效性强,通过快速分析与评价手段,可以大大地促进区域进行规划、管理和恢复的科学性和可操作性。
Extraction and analysis of regional landscape indexes based on SPOT-5 images and Fragstats software [J].https://doi.org/10.3969/j.issn.1671-3044.2008.01.005 URL [本文引用: 1] 摘要
景观指数是衡量区域景观质量的重要参数,也是进行区域生态规划、管理和恢复的重要信息依据。针对传统已有的矢量地图信息源及Excel、SPSS软件在景观指数计算中存在的不足和不便之处,研究了在ENVI 4.2下,基于高分辨率SPOT-5遥感影像的自动景观分类及Fragstats3.3软件支持下的景观指数自动提取的计算方法,以屈原农场为例进行了实验研究,制作了景观现状图和计算部分景观指数。实验表明:该方法对景观质量的评价信息获取效率高、时效性强,通过快速分析与评价手段,可以大大地促进区域进行规划、管理和恢复的科学性和可操作性。
|
| [11] |
北京城市蔓延的测度与分析 [J].https://doi.org/10.3969/j.issn.1009-637X.2007.04.008 URL [本文引用: 1] 摘要
针对现阶段我国城市用地快速扩张和无序蔓延的现实问题,以北京市在1996 ̄2004年期间的城市扩展作为研究案例,提出可以从城市扩展形态、扩展效率和外部影响等三个方面来判识城市蔓延现象,并提出基于地理空间指标体系的城市蔓延测度方法,主要由涉及人口、经济、土地利用、农业、环境和城市生活等方面的13项指标所组成。实证分析结果表明,该方法可以有效地测度和量化研究区城市蔓延的特征:①建设用地斑块具有明显的破碎化和不规则化趋势,缺乏良好的规划控制,不连续开发、条带式开发和跳跃式开发特征明显,扩展形态不尽合理;②新增建设用地的建设密度和容积率较低,并且新增用地的人口密度和经济产出水平均低于原有用地绩效,扩展效
Measuring urban sprawl in Beijing with geo-spatial indices [J].https://doi.org/10.3969/j.issn.1009-637X.2007.04.008 URL [本文引用: 1] 摘要
针对现阶段我国城市用地快速扩张和无序蔓延的现实问题,以北京市在1996 ̄2004年期间的城市扩展作为研究案例,提出可以从城市扩展形态、扩展效率和外部影响等三个方面来判识城市蔓延现象,并提出基于地理空间指标体系的城市蔓延测度方法,主要由涉及人口、经济、土地利用、农业、环境和城市生活等方面的13项指标所组成。实证分析结果表明,该方法可以有效地测度和量化研究区城市蔓延的特征:①建设用地斑块具有明显的破碎化和不规则化趋势,缺乏良好的规划控制,不连续开发、条带式开发和跳跃式开发特征明显,扩展形态不尽合理;②新增建设用地的建设密度和容积率较低,并且新增用地的人口密度和经济产出水平均低于原有用地绩效,扩展效
|
| [12] |
城市绿地系统结构与功能研究综述 [J].https://doi.org/10.11820/dlkxjz.2010.03.018 URL Magsci [本文引用: 1] 摘要
<p>在分析城绿地系统概念和内涵的基础上,对国内外城市绿地系统结构和功能研究进行综述。主要阐述了城市绿地系统结构的两种外在表现形式,即“点、线、面”布局结构和“斑块、廊道、基底”景观结构。综述了城市绿地系统结构对功能的影响、主要进展及其应用,并提出未来城市绿地系统研究和绿地规划的主要方向,以期对中国未来城市绿地系统规划有所启示。</p>
The structure and function of urban green space system: A review [J].https://doi.org/10.11820/dlkxjz.2010.03.018 URL Magsci [本文引用: 1] 摘要
<p>在分析城绿地系统概念和内涵的基础上,对国内外城市绿地系统结构和功能研究进行综述。主要阐述了城市绿地系统结构的两种外在表现形式,即“点、线、面”布局结构和“斑块、廊道、基底”景观结构。综述了城市绿地系统结构对功能的影响、主要进展及其应用,并提出未来城市绿地系统研究和绿地规划的主要方向,以期对中国未来城市绿地系统规划有所启示。</p>
|
| [13] |
基于遥感信息的北京硬化地表格局特征研究 [J].
地表硬化是城市发展的重要特征之一,识别地表硬化程度对认识城市景观格局、物流、能流等社会、经济、自然过程具有重要意义.研究利用TM遥感影像,发展城市地表硬化度的遥感分析方法,提出地表硬化度指数,应用主成分回归方法,有效地拟合了地表硬化度和多光谱因子的关系(RTM=0.851,p<0.001).经统计检验:基于TM拟合的地表硬化度和真实的地表硬化度的相关性达到0.91(R=0.91).在此基础上,应用地表硬化度指数和基于目标分割的遥感分类方法,研究了北京市建城区(5环内)地表硬化度和建设密度的空间格局.结果表明:北京市城区中等(地表硬化度在50%-70%)和高密度建设用地(地表硬化度大于70%)总体比例大于70%,占绝对优势,其景观斑块的大小、形状等格局特征主导了北京城区景观格局的总体特征.但2-5环不同环带内硬化地表的格局特征明显不同.3-4环带是近20年城市发展的核心区,地表硬化格局综合体现了城市不同发展阶段的土地利用特征;2环带是老城区,以老北京胡同和文化古迹为主,高密度建设用地比例最高;5环带是城乡过渡区,以村镇、开发区为主体的高密度和中等密度建设覆盖比例为68.8%,斑块异质性较其他环带低,以林地、耕地等为主的硬化度较低的土地覆盖比例是31.2%,斑块异质性更低.
Study on the spatial pattern of impervious surface using remote sensing data within the urban area of Beijing [J].
地表硬化是城市发展的重要特征之一,识别地表硬化程度对认识城市景观格局、物流、能流等社会、经济、自然过程具有重要意义.研究利用TM遥感影像,发展城市地表硬化度的遥感分析方法,提出地表硬化度指数,应用主成分回归方法,有效地拟合了地表硬化度和多光谱因子的关系(RTM=0.851,p<0.001).经统计检验:基于TM拟合的地表硬化度和真实的地表硬化度的相关性达到0.91(R=0.91).在此基础上,应用地表硬化度指数和基于目标分割的遥感分类方法,研究了北京市建城区(5环内)地表硬化度和建设密度的空间格局.结果表明:北京市城区中等(地表硬化度在50%-70%)和高密度建设用地(地表硬化度大于70%)总体比例大于70%,占绝对优势,其景观斑块的大小、形状等格局特征主导了北京城区景观格局的总体特征.但2-5环不同环带内硬化地表的格局特征明显不同.3-4环带是近20年城市发展的核心区,地表硬化格局综合体现了城市不同发展阶段的土地利用特征;2环带是老城区,以老北京胡同和文化古迹为主,高密度建设用地比例最高;5环带是城乡过渡区,以村镇、开发区为主体的高密度和中等密度建设覆盖比例为68.8%,斑块异质性较其他环带低,以林地、耕地等为主的硬化度较低的土地覆盖比例是31.2%,斑块异质性更低.
|
| [14] |
土地城镇化及相关问题研究综述 [J].https://doi.org/10.11820/dlkxjz.2012.08.007 URL Magsci [本文引用: 1] 摘要
中国正经历着大规模的高速城镇化过程, 与人口城镇化相伴随的是土地的急速城镇化, 而关于“冒进土地城镇化”的提法和关注甚多但讲法不一。为了厘清土地城镇化的概念、内涵及度量方法, 本文回顾并评述了土地城镇化及其相关问题的研究进展, 对土地城镇化问题进行了再思考。现阶段中国土地城镇化不仅仅是农用地转换用途的非农化过程, 越来越被关注的是农村建设用地转变为城镇建设用地以及建设用地的效率提升。本文认为土地城镇化应为土地从非城镇状态向城镇状态转变的过程, 并提出以城镇建设用地与城乡建设用地的比值作为土地城镇化率的衡量指标。以此出发, 土地城镇化问题今后的研究重点包括:土地城镇化和人口城镇化的匹配研究、时空格局和驱动机制研究、城乡实体空间划分、城镇空间扩张研究和用地效率转变研究。
Review of research on land urbanization and related studies [J].https://doi.org/10.11820/dlkxjz.2012.08.007 URL Magsci [本文引用: 1] 摘要
中国正经历着大规模的高速城镇化过程, 与人口城镇化相伴随的是土地的急速城镇化, 而关于“冒进土地城镇化”的提法和关注甚多但讲法不一。为了厘清土地城镇化的概念、内涵及度量方法, 本文回顾并评述了土地城镇化及其相关问题的研究进展, 对土地城镇化问题进行了再思考。现阶段中国土地城镇化不仅仅是农用地转换用途的非农化过程, 越来越被关注的是农村建设用地转变为城镇建设用地以及建设用地的效率提升。本文认为土地城镇化应为土地从非城镇状态向城镇状态转变的过程, 并提出以城镇建设用地与城乡建设用地的比值作为土地城镇化率的衡量指标。以此出发, 土地城镇化问题今后的研究重点包括:土地城镇化和人口城镇化的匹配研究、时空格局和驱动机制研究、城乡实体空间划分、城镇空间扩张研究和用地效率转变研究。
|
| [15] |
|
| [16] |
基于景观指数的景观格局分析方法的局限性: 以台湾宜兰利泽简湿地为例 [J].
对利用景观指数分析方法与航片解译获取的台湾宜兰利泽简湿地景观格局进行了对比分析.结果表明:景观指数仅能从几何特性解释景观在斑块与景观尺度上的空间特征,而无法解释从航片所观察到的景观结构与功能特性;通过对景观指数和研究区航片进行综合分析,可更加详细地揭示研究区的整体景观结构及其对应的景观功能,使针对景观格局的分析更加完整.基于整体性观点的评估景观结构的新方法,必将在未来的景观生态学发展中扮演重要角色.
Limitations of landscape pattern analysis based on landscape indices: A case study of Lizejian wetland in Yilan of Taiwan Province, China [J].
对利用景观指数分析方法与航片解译获取的台湾宜兰利泽简湿地景观格局进行了对比分析.结果表明:景观指数仅能从几何特性解释景观在斑块与景观尺度上的空间特征,而无法解释从航片所观察到的景观结构与功能特性;通过对景观指数和研究区航片进行综合分析,可更加详细地揭示研究区的整体景观结构及其对应的景观功能,使针对景观格局的分析更加完整.基于整体性观点的评估景观结构的新方法,必将在未来的景观生态学发展中扮演重要角色.
|
| [17] |
景观扩张指数及其在城市扩展分析中的应用 [J].https://doi.org/10.3321/j.issn:0375-5444.2009.12.003 URL [本文引用: 6] 摘要
景观指数是定量分析景观格局的一种常用手段,但目前大部分景观指数,往往只侧重于对景观斑块 或格局的几何特征进行简单分析和描述,忽略了景观格局动态变化过程的信息,缺乏将景观空间分布格局与其变化过程相结合的深入研究。作者提出了一种新的景观 指数—景观扩张指数(Landscape Expansion Index,LEI),与传统的景观指数相比,LEI包涵了景观格局的过程信息,可用来分析两个或多个时相景观格局的动态变化,而传统景观指数则只能反映 某一时相景观格局的信息。将景观扩张指数应用于东莞市1988-2006年期间的城市景观扩张过程中,研究结果表明,LEI能够很好的识别城市扩张的三种 类型—填充式、边缘式以及飞地式。此外,通过对东莞市城市扩张过程LEI的变化分析,发现东莞市城市扩张规律与城市增长相位理论是相符合的。
Landscape expansion index and its applications to quantitative analysis of urban expansion [J].https://doi.org/10.3321/j.issn:0375-5444.2009.12.003 URL [本文引用: 6] 摘要
景观指数是定量分析景观格局的一种常用手段,但目前大部分景观指数,往往只侧重于对景观斑块 或格局的几何特征进行简单分析和描述,忽略了景观格局动态变化过程的信息,缺乏将景观空间分布格局与其变化过程相结合的深入研究。作者提出了一种新的景观 指数—景观扩张指数(Landscape Expansion Index,LEI),与传统的景观指数相比,LEI包涵了景观格局的过程信息,可用来分析两个或多个时相景观格局的动态变化,而传统景观指数则只能反映 某一时相景观格局的信息。将景观扩张指数应用于东莞市1988-2006年期间的城市景观扩张过程中,研究结果表明,LEI能够很好的识别城市扩张的三种 类型—填充式、边缘式以及飞地式。此外,通过对东莞市城市扩张过程LEI的变化分析,发现东莞市城市扩张规律与城市增长相位理论是相符合的。
|
| [18] |
中国收缩城市及其研究框架 [J].Shrinking Cities in China [J]. |
| [19] |
基于改进景观扩张指数苏锡常地区城镇扩展空间形态变化 [J].
<p>针对目前景观扩张指数计算存在的问题,提出一种改进计算景观扩张指数的方法用于动态分析城镇空间形态变化特征。将景观格局的3 种增长模式:填充式、边缘式和飞地式分别表示为3 种拓扑关系:包含、相交及相离关系,通过判断新增城镇建设用地斑块之间的拓扑关系计算景观格局扩张的各项指数,据此对苏锡常地区1985~2008 年各阶段城镇扩展空间形态变化进行分析。从总体景观扩张模式的变化来看,苏锡常地区建设用地增长方式以边缘式的紧凑增长为主;从增长形态的空间位置来看,各市市区和各镇行政中心的增长形态基本可以归纳为以边缘式增长为主的紧凑增长形态,普通城镇则可能是紧凑增长形态或者蔓延增长形态。计算结果表明,改进的景观扩张指数方法能够动态的反映苏锡常地区城镇用地空间格局形态变化过程。进一步计算反映城镇用地分形特征的盒子维数作对比分析,从计算结果来看,随着时间推移苏锡常地区城镇用地分维数值逐渐增加,从1985 年的1.220 增加到2008 年的1.504,但增长幅度不大,说明城镇空间格局始终处于集中和均衡之间;而景观扩张指数计算结果反映,从1995 年飞地式增长模式的数量和分布开始增加之后,给城镇发展的主导的紧凑模式带来了扰动,这种扩散式的增长导致各城镇扩张的结果在空间形态上出现与总体趋势分异的现象。新建设用地的增长点引起了城镇空间结构的变化,这种发展增加了城镇空间形态的随机性和结构的不稳定性,这个结果可以作为前述盒子维数计算结果的补充,说明景观扩张指数可以解释分形这种形态结果的空间变化过程;并且通过计算景观扩张指数,决策者可以了解城镇扩展空间形态的变化趋势,从而从宏观上控制城镇的无序蔓延。</p>
Urban spatial morphology evolution in Suzhou-Wuxi-Changzhou Region based on improved landscape expansion index [J].
<p>针对目前景观扩张指数计算存在的问题,提出一种改进计算景观扩张指数的方法用于动态分析城镇空间形态变化特征。将景观格局的3 种增长模式:填充式、边缘式和飞地式分别表示为3 种拓扑关系:包含、相交及相离关系,通过判断新增城镇建设用地斑块之间的拓扑关系计算景观格局扩张的各项指数,据此对苏锡常地区1985~2008 年各阶段城镇扩展空间形态变化进行分析。从总体景观扩张模式的变化来看,苏锡常地区建设用地增长方式以边缘式的紧凑增长为主;从增长形态的空间位置来看,各市市区和各镇行政中心的增长形态基本可以归纳为以边缘式增长为主的紧凑增长形态,普通城镇则可能是紧凑增长形态或者蔓延增长形态。计算结果表明,改进的景观扩张指数方法能够动态的反映苏锡常地区城镇用地空间格局形态变化过程。进一步计算反映城镇用地分形特征的盒子维数作对比分析,从计算结果来看,随着时间推移苏锡常地区城镇用地分维数值逐渐增加,从1985 年的1.220 增加到2008 年的1.504,但增长幅度不大,说明城镇空间格局始终处于集中和均衡之间;而景观扩张指数计算结果反映,从1995 年飞地式增长模式的数量和分布开始增加之后,给城镇发展的主导的紧凑模式带来了扰动,这种扩散式的增长导致各城镇扩张的结果在空间形态上出现与总体趋势分异的现象。新建设用地的增长点引起了城镇空间结构的变化,这种发展增加了城镇空间形态的随机性和结构的不稳定性,这个结果可以作为前述盒子维数计算结果的补充,说明景观扩张指数可以解释分形这种形态结果的空间变化过程;并且通过计算景观扩张指数,决策者可以了解城镇扩展空间形态的变化趋势,从而从宏观上控制城镇的无序蔓延。</p>
|
| [20] |
我国城市发展模式转型趋势: 低碳生态城市 [J].https://doi.org/10.3969/j.issn.1006-3862.2009.08.001 URL [本文引用: 1] 摘要
本文从城市发展历史和当前的资源环境形势入手,分析了以低碳生态城作为我国城市发展模式转型目标的必然性,进而从我国的经济社会发展趋势、悠久的农耕文明历史、众多的城市发展形态等方面阐述我国发展低碳生态城的特点和优势所在.最后简要介绍了国家促进低碳生态城发展的一系列政策措施.
The transformation trends of urban development model in China: Low carbon eco-city [J].https://doi.org/10.3969/j.issn.1006-3862.2009.08.001 URL [本文引用: 1] 摘要
本文从城市发展历史和当前的资源环境形势入手,分析了以低碳生态城作为我国城市发展模式转型目标的必然性,进而从我国的经济社会发展趋势、悠久的农耕文明历史、众多的城市发展形态等方面阐述我国发展低碳生态城的特点和优势所在.最后简要介绍了国家促进低碳生态城发展的一系列政策措施.
|
| [21] |
基于空间句法的扩张强度指数及其在城镇扩展分析中的应用 [J].Space syntax expand intensity index and its applications to quantitative analysis of urban expansion [J]. |
| [22] |
一种新的景观扩张指数的定义与实现 [J].https://doi.org/10.5846/stxb201106090769 Magsci [本文引用: 2] 摘要
景观格局动态信息的定量表达始终是景观生态学研究的一个重要科学问题,景观格局指数是其中的一种重要方法,但其多是静态指数,难以有效定量表达景观格局的动态信息。因此,针对景观扩张过程以斑块扩张面积为基础提出了一种新的景观扩张指数,来表达景观格局的动态信息。并以妫水河流域1998-2009年的景观农田化过程为例,验证该指数的适用性,结果表明:该指数不仅能够定量表达斑块的空间扩张规模,而且可以准确识别斑块的空间扩张模式。根据扩张斑块与原斑块的空间位置关系,将景观的空间扩张模式划分为邻接扩张式和外部扩张式两种。提出的景观扩张指数在技术方法上计算简便,易于实现,完善了景观格局动态的量化表征科学方法。
A new landscape expansion index: Definition and quantification [J].https://doi.org/10.5846/stxb201106090769 Magsci [本文引用: 2] 摘要
景观格局动态信息的定量表达始终是景观生态学研究的一个重要科学问题,景观格局指数是其中的一种重要方法,但其多是静态指数,难以有效定量表达景观格局的动态信息。因此,针对景观扩张过程以斑块扩张面积为基础提出了一种新的景观扩张指数,来表达景观格局的动态信息。并以妫水河流域1998-2009年的景观农田化过程为例,验证该指数的适用性,结果表明:该指数不仅能够定量表达斑块的空间扩张规模,而且可以准确识别斑块的空间扩张模式。根据扩张斑块与原斑块的空间位置关系,将景观的空间扩张模式划分为邻接扩张式和外部扩张式两种。提出的景观扩张指数在技术方法上计算简便,易于实现,完善了景观格局动态的量化表征科学方法。
|
| [23] |
城市收缩现象、过程与问题 [J].
城市并不总是增长。在人口峰值过去后人口收缩将是部分城市面临的一个不可避免的趋势。这将是我国和全球城市发展的新议题。根据国际上的最新进展,阐释了收缩城市的概念、起源和影响因素,描述了城市收缩的过程及表现,介绍了国外城市的应对措施;指出国内研究主要还集中于资源型城市的衰退方向;强调城市收缩作为客观的城市发展过程,具有不可避免性,也有别于城市衰退,需要更加客观科学地对待。初步介绍和探讨了国外城市在人口减少时采取的城市规划和管理方法,包括如何通过公众参与、产业转型生态环境保护、土地利用规划调整和交通住房改造等措施,来促进城市发展和提高居民生活质量,为我国的城市发展和转型提供有益启示。
City shrinking: Phenomenon, progress and problems [J].
城市并不总是增长。在人口峰值过去后人口收缩将是部分城市面临的一个不可避免的趋势。这将是我国和全球城市发展的新议题。根据国际上的最新进展,阐释了收缩城市的概念、起源和影响因素,描述了城市收缩的过程及表现,介绍了国外城市的应对措施;指出国内研究主要还集中于资源型城市的衰退方向;强调城市收缩作为客观的城市发展过程,具有不可避免性,也有别于城市衰退,需要更加客观科学地对待。初步介绍和探讨了国外城市在人口减少时采取的城市规划和管理方法,包括如何通过公众参与、产业转型生态环境保护、土地利用规划调整和交通住房改造等措施,来促进城市发展和提高居民生活质量,为我国的城市发展和转型提供有益启示。
|
| [24] |
中国新型城镇化理论与实践问题 [J].
<p>城镇化问题是当代中国社会经济发展的综合性课题,是涉及到国民经济各部门如何协调发展,达到一个新的现代化和谐社会发展的根本问题;新型城镇化是中国城镇化健康稳定发展的基本保证,在当前的新形势下,探索中国新型城镇化理论与实践问题,具有重要的学术价值与实践意义。在过去一阶段,虽然城镇化推动了中国社会经济发展取得了巨大成就,并在城市现代化建设与城乡一体化方面也取得了惊人的发展,但在某个时期或一些地区,城镇化过速发展阶段,出现了无序的发展状态,大中城市边缘盲目扩展,水土资源日渐退化,生态环境遭受破坏,特别是有些政府决策人对城镇化的许多制约因素认识不足,甚至决策失误,导致了城市环境出现许多不安全、不舒适的问题。着重从地理空间与自然资源保护的角度,探索中国新型城镇化3 个理论与实践问题① 如何认知中国新型城镇化的基本特征与新的路径;② 在全球经济一体化形势下,如何构建新型城镇化的创新模式;③ 在新型城镇化实施过程中,如何认识中国城镇化本身的发展规律,走具有中国特色的新型城镇化道路。</p>
The theory and practice of new urbanization in China [J].
<p>城镇化问题是当代中国社会经济发展的综合性课题,是涉及到国民经济各部门如何协调发展,达到一个新的现代化和谐社会发展的根本问题;新型城镇化是中国城镇化健康稳定发展的基本保证,在当前的新形势下,探索中国新型城镇化理论与实践问题,具有重要的学术价值与实践意义。在过去一阶段,虽然城镇化推动了中国社会经济发展取得了巨大成就,并在城市现代化建设与城乡一体化方面也取得了惊人的发展,但在某个时期或一些地区,城镇化过速发展阶段,出现了无序的发展状态,大中城市边缘盲目扩展,水土资源日渐退化,生态环境遭受破坏,特别是有些政府决策人对城镇化的许多制约因素认识不足,甚至决策失误,导致了城市环境出现许多不安全、不舒适的问题。着重从地理空间与自然资源保护的角度,探索中国新型城镇化3 个理论与实践问题① 如何认知中国新型城镇化的基本特征与新的路径;② 在全球经济一体化形势下,如何构建新型城镇化的创新模式;③ 在新型城镇化实施过程中,如何认识中国城镇化本身的发展规律,走具有中国特色的新型城镇化道路。</p>
|
| [25] |
景观指数的空间尺度效应分析: 以厦门岛土地利用格局为例 [J].https://doi.org/10.3969/j.issn.1560-8999.2008.01.013 URL [本文引用: 1] 摘要
选取8个常用的景观指数,以厦门岛土地利用格局为例,分析景观指数随粒度变化的基本规律。探讨尺度效应对景观格局的影响,为基于景观指数进行不同尺度下土地利用类型、土地利用格局变化预测、对比分析和评价等研究提供参考。结果表明:在研究区内景观类型特征和景观格局特征随粒度的增大出现了显著的变化;除面积比例对粒度变化弱敏感外,其余所选景观指数对粒度变化相对敏感,体现出一定的尺度依赖性,因而利用这些景观指数进行不同尺度下的景观格局分析时需考虑尺度效应。
The effects of spatial scales on landscape indices: A case study of the landuse pattern of Xiamen Island [J].https://doi.org/10.3969/j.issn.1560-8999.2008.01.013 URL [本文引用: 1] 摘要
选取8个常用的景观指数,以厦门岛土地利用格局为例,分析景观指数随粒度变化的基本规律。探讨尺度效应对景观格局的影响,为基于景观指数进行不同尺度下土地利用类型、土地利用格局变化预测、对比分析和评价等研究提供参考。结果表明:在研究区内景观类型特征和景观格局特征随粒度的增大出现了显著的变化;除面积比例对粒度变化弱敏感外,其余所选景观指数对粒度变化相对敏感,体现出一定的尺度依赖性,因而利用这些景观指数进行不同尺度下的景观格局分析时需考虑尺度效应。
|
| [26] |
GIS与RS技术支持下的北京西北地区景观格局优化 [J].Landscape pattern optimization based on RS and GIS in northwest of Beijing [J]. |
| [27] |
基于元胞自动机的城市空间动态模拟 [J].https://doi.org/10.5846/stxb201604250780 URL [本文引用: 1] 摘要
城市空间动态的模拟与预测可以为城市可持续发展规划与管理提供重要的参考依据。SLEUTH元胞自动机模型在城市空间模拟中较强的适用性和可移植性,该模型通过对历史数据的蒙特卡洛迭代自动寻找城市增长误差最小的参数组合,解决了传统元胞自动机模型中转换规则不易确定的问题。以武汉市为研究案例,运用SLEUTH模型进行了城市空间动态模拟与情景预测。2007年至2011年的城市空间模拟结果显示,模拟结果与实际历史数据可以获得良好的空间匹配度,Lee—Sallee形状指数均在0.6以上,显示SLEUTH元胞自动机模型经过本地化校正后具有较强的适用性和满意的模拟精度。进而,设置了现状趋势、基本保护、严格保护等3种情景对武汉2025年城市空间动态进行了预测,结果显示,各情景模式下城市居住用地均明显增长,农业用地、林地、水域等均有所减少;现状趋势情景和基本保护情景下农田、林地、水域减少的幅度较大,会加剧区域的生境破碎、耕地功能下降、水资源匮乏、湖滨湿地萎缩等生态问题,说明这两种情景不能有效满足城市生态系统健康和可持续发展的需要。严格保护情景下,城市居住用地扩张的程度得到了明显的控制,水域和林地得到了有效的保护,对于重要的自然生态系统组分保护及其服务能力维持可以起到显著作用。
Dynamic simulation of urban space based on the cellular automata model [J].https://doi.org/10.5846/stxb201604250780 URL [本文引用: 1] 摘要
城市空间动态的模拟与预测可以为城市可持续发展规划与管理提供重要的参考依据。SLEUTH元胞自动机模型在城市空间模拟中较强的适用性和可移植性,该模型通过对历史数据的蒙特卡洛迭代自动寻找城市增长误差最小的参数组合,解决了传统元胞自动机模型中转换规则不易确定的问题。以武汉市为研究案例,运用SLEUTH模型进行了城市空间动态模拟与情景预测。2007年至2011年的城市空间模拟结果显示,模拟结果与实际历史数据可以获得良好的空间匹配度,Lee—Sallee形状指数均在0.6以上,显示SLEUTH元胞自动机模型经过本地化校正后具有较强的适用性和满意的模拟精度。进而,设置了现状趋势、基本保护、严格保护等3种情景对武汉2025年城市空间动态进行了预测,结果显示,各情景模式下城市居住用地均明显增长,农业用地、林地、水域等均有所减少;现状趋势情景和基本保护情景下农田、林地、水域减少的幅度较大,会加剧区域的生境破碎、耕地功能下降、水资源匮乏、湖滨湿地萎缩等生态问题,说明这两种情景不能有效满足城市生态系统健康和可持续发展的需要。严格保护情景下,城市居住用地扩张的程度得到了明显的控制,水域和林地得到了有效的保护,对于重要的自然生态系统组分保护及其服务能力维持可以起到显著作用。
|
| [28] |
重庆市主城区森林景观斑块时空动态特征 [J].https://doi.org/10.3969/J.ISSN.1672-6693.2010.03.009 URL [本文引用: 1] 摘要
本文以重庆主城区为研究对象,借助景观生态学理论,利用1986、1995、2000和2006年重庆主城区遥感影像数据及相关辅助数据,运用人机交互目视解译方法以及地理信息系统的空间分析和数理统计功能,建立重庆主城区森林景观数据库,对主城区森林景观格局的景观时空演变及地理空间分异特征与规律进行定量化分析。经分析得出:1)研究区森林景观变化:在研究时段的20年间,研究区森林景观面积1986-2000年逐年递减,2000-21306年有所增加;森林景观破碎度总体上呈降低趋势,局部地区受人类活动影响破碎化加剧;斑块边界褶皱化程度加剧,斑块形状趋向复杂化;2)研究区斑块动态变化:1986-1995年,森林斑块等级变化不明显,处于相对稳定状态;1995-2000年,小斑块变大的趋势明显;2000-2006年,斑块各个等级间变化最为剧烈,数量和面积上均相对较大,人类活动作用明显;3)森林景观空间格局演化主要受地形条件的控制,并随城市化进程受人类活动影响程度不断加深而时刻变化。
Temporal and spatial features of forest landscape patch in main districts of Chongqing city [J].https://doi.org/10.3969/J.ISSN.1672-6693.2010.03.009 URL [本文引用: 1] 摘要
本文以重庆主城区为研究对象,借助景观生态学理论,利用1986、1995、2000和2006年重庆主城区遥感影像数据及相关辅助数据,运用人机交互目视解译方法以及地理信息系统的空间分析和数理统计功能,建立重庆主城区森林景观数据库,对主城区森林景观格局的景观时空演变及地理空间分异特征与规律进行定量化分析。经分析得出:1)研究区森林景观变化:在研究时段的20年间,研究区森林景观面积1986-2000年逐年递减,2000-21306年有所增加;森林景观破碎度总体上呈降低趋势,局部地区受人类活动影响破碎化加剧;斑块边界褶皱化程度加剧,斑块形状趋向复杂化;2)研究区斑块动态变化:1986-1995年,森林斑块等级变化不明显,处于相对稳定状态;1995-2000年,小斑块变大的趋势明显;2000-2006年,斑块各个等级间变化最为剧烈,数量和面积上均相对较大,人类活动作用明显;3)森林景观空间格局演化主要受地形条件的控制,并随城市化进程受人类活动影响程度不断加深而时刻变化。
|
| [29] |
收缩城市: 逆增长情景下的城市发展路径研究进展 [J].Shrinking city: On searching for urban development in non-growing scenarios [J]. |
| [30] |
苏锡常地区建设用地扩张过程的定量分析 [J].
<p>基于遥感影像与社会经济统计数据,本文综合运用3S空间分析技术、景观扩张指数与多元逐步回归模型,分析了1990—2010年苏锡常地区建设用地扩张的时空特征、空间模式及社会经济驱动力.结果表明: 研究区建设用地面积经历了快速增长缓慢增长加速增长的变化轨迹,这与不同时期国家宏观政策的重大调整紧密相关;研究期间,建设用地面积增长2218.9 km<sup>2</sup>,主要源于对水田、旱田、水库坑塘等生态用地的占用;1990—1995年,区域建设用地主要以填充式、边缘式进行扩张;1995—2000年,填充式、边缘式受到政策限制,飞地式成为建设用地扩张的主要途径;2000年以后,飞地式扩张大幅锐减,填充式扩张显著增强,建设用地空间形态逐渐趋向紧凑;区域经济高速增长是驱动建设用地扩张的主导因素,城镇人口的激增也加速了建设用地的扩张.未来区域的经济社会发展规划,应重视提高土地集约利用水平、加强土地管理体制创新并推行紧凑的城市发展模式.</p>
Quantitative analysis of the built-up area expansion in Su-Xi-Chang region, China [J].
<p>基于遥感影像与社会经济统计数据,本文综合运用3S空间分析技术、景观扩张指数与多元逐步回归模型,分析了1990—2010年苏锡常地区建设用地扩张的时空特征、空间模式及社会经济驱动力.结果表明: 研究区建设用地面积经历了快速增长缓慢增长加速增长的变化轨迹,这与不同时期国家宏观政策的重大调整紧密相关;研究期间,建设用地面积增长2218.9 km<sup>2</sup>,主要源于对水田、旱田、水库坑塘等生态用地的占用;1990—1995年,区域建设用地主要以填充式、边缘式进行扩张;1995—2000年,填充式、边缘式受到政策限制,飞地式成为建设用地扩张的主要途径;2000年以后,飞地式扩张大幅锐减,填充式扩张显著增强,建设用地空间形态逐渐趋向紧凑;区域经济高速增长是驱动建设用地扩张的主导因素,城镇人口的激增也加速了建设用地的扩张.未来区域的经济社会发展规划,应重视提高土地集约利用水平、加强土地管理体制创新并推行紧凑的城市发展模式.</p>
|
| [31] |
Assessing land-use impacts on biodiversity using an expert systems tool [J].https://doi.org/10.1023/A:1008117427864 URL [本文引用: 1] 摘要
Habitat alteration, in the form of land-use development, is a leading cause of biodiversity loss in the U.S. and elsewhere. Although statutes in the U.S. may require consideration of biodiversity in local land-use planning and regulation, local governments lack the data, resources, and expertise to routinely consider biotic impacts that result from permitted land uses. We hypothesized that decision support systems could aid solution of this problem. We developed a pilot biodiversity expert systems tool (BEST) to test that hypothesis and learn what additional scientific and technological advancements are required for broad implementation of such a system. BEST uses data from the U.S. Geological Survey's Gap Analysis Program (GAP) and other data in a desktop GIS environment. The system provides predictions of conflict between proposed land uses and biotic elements and is intended for use at the start of the development review process. Key challenges were the development of categorization systems that relate named land-use types to ecological impacts, and relate sensitivities of biota to ecological impact levels. Although the advent of GAP and sophisticated desktop GIS make such a system feasible for broad implementation, considerable ongoing research is required to make the results of such a system scientifically sound, informative, and reliable for the regulatory process. We define a role for local government involvement in biodiversity impact assessment, the need for a biodiversity decision support system, the development of a prototype system, and scientific needs for broad implementation of a robust and reliable system.
|
| [32] |
A useful role for theory in conservation [J].https://doi.org/10.2307/1941720 URL [本文引用: 1] 摘要
Food habits of three sympatric carnivore mammals in the Tsushima islands of Japan were studied during 1986-91. Scats of the Tsushima marten (n = 1236), the Siberian weasel (n = 218) and the Tsushima leopard cat (n = 350) were collected monthly and the food items were determined by scat contents analysis. Marten was omnivorous showing a high level of diversity of food throughout the year. The important foods for marten were fruits and berries from spring to autumn, insects in summer and autumn and small mammals all year round. Leopard cat preferred to hunt wood mice and birds, and remained a flesh meat specialist throughout the year. Weasel was intermediate between marten and leopard cat, but was slightly biased towards the flesh meat eater. The three carnivores do not compete against one another for food, except for small rodents. A conflict for food between leopard cat and weasel was suggested to be more intense than that of other combinations based on diet overlapping. Marten may be characterized as an opportunistic generalist. When interspecific competitors existed, or human disturbance to the habitat occurred, the preferential flexibility of the marten to alternative food resources might become more advantageous than the other two species.
|
| [33] |
Understanding spatial-temporal urban expansion pattern (1990-2009) using impervious surface data and landscape indexes: A case study in Guangzhou (China) [J].https://doi.org/10.1117/1.JRS.8.083609 URL [本文引用: 1] 摘要
A new viewpoint for understanding the urban expansion using impervious surface information, which is obtained using remote sensing imagery is presented. The purpose of this study is to understand and describe the urban expansion pattern with the view of impervious surfaces instead of the conventional view of land use/land cover. Six years' worth of impervious surface data (1990-2009) of Guangzhou are extracted via linear spectral unmixing analysis methods and spatial and temporal characteristics are discussed in detail. The area, density, and gravity centers changes of the impervious surfaces are analyzed to explain internal/external urban expansion. Meanwhile, five landscape indexes, such as patch density, edge density, mean patch size, area-weighted, and fragmentation index, are utilized to describe landscape changes of Guangzhou in past 20 years, which are influenced deeply by the impervious surface expansion. In order to detail landscape changes, two transects corresponding to the two urban expansion directions are designed and five landscape metrics in these two transects are reported. Conclusions can be drawn and shown as following: (1) temporally, the area of impervious surfaces increases from 12,998 to 59,911 ha from 1990 to 2009. The amount of impervious surface varies in different periods. The annual growth rates of impervious surface area during 1990-1995, 1995-1998, and 1998-2000 are 10.16%, 11.61%, and 10.78%, respectively; (2) annual growth rates decrease from 10.78% (1998-2000) to 5.67% (2000-2003). Nevertheless, from 2003-2009, the annual growth rate has a slight increase compared to a former period. The rate is 5.91%; (3) spatially, gravity centers of medium and high percentage impervious surfaces migrate slightly; and (4) according to the gradient analysis in the two transects, it can be observed that the high percentage of impervious surface increases gradually in new city districts (from west to east and from south to north).
|
| [34] |
Quantifying landscape spatial pattern: What is the state of the art [J].https://doi.org/10.1007/s100219900011 URL [本文引用: 1] |
| [35] |
Actors and factors in land-use simulation: The challenge of urban shrinkage [J].https://doi.org/10.1016/j.envsoft.2012.02.012 URL [本文引用: 1] 摘要
Both modelers and social scientists attempt to find better explanations of complex urban systems. They include development paths, underlying driving forces and their expected impacts. So far, land-use research has predominantly focused on urban growth. However, new challenges have arisen since urban shrinkage entered the research agenda of the social and land-use sciences. Therefore, the focus of this paper is a twofold one: Using the example of urban shrinkage, we first discuss the capacity of existing land-use modeling approaches to integrate new social science knowledge in terms of land-use, demography and governance because social science models are indispensable for accurately explaining the processes behind shrinkage. Second, we discuss the combination of system dynamics (SD), cellular automata (CA) and agent-based model (ABM) approaches to cover the main characteristics, processes and patterns of urban shrinkage. Using Leipzig, Germany, as a case study, we provide the initial results of a joint SD-CA model and an ABM that both operationalize social science knowledge regarding urban shrinkage.
|
| [36] |
Urban expansion brought stress to food security in China: Evidence from decreased cropland net primary productivity [J].https://doi.org/10.1016/j.scitotenv.2016.10.107 URL PMID: 27810753 [本文引用: 1] 摘要
61The CNPP decreased by 13.77TgC due to urban expansion in China from 1992 to 2015.61This CNPP loss caused a decline of 12.45milliontons of grain production.61The mean annual grain self-sufficiency rate decreased by 2% due to urban expansion.
|
| [37] |
Improving the measurement of urban sprawl: Weighted urban proliferation (WUP) and its application to Switzerland [J].https://doi.org/10.1016/j.ecolind.2013.11.022 URL [本文引用: 1] 摘要
Growing urban sprawl is a serious concern worldwide for a number of environmental and economic reasons and is a major challenge on the way to sustainable land use. To address this increasing problem, there is an urgent need for quantitative measurement. Every meaningful method to measure the degree of urban sprawl needs to be based on a clear definition of “urban sprawl” disentangling causes and consequences of urban sprawl from the phenomenon of urban sprawl itself, as urban sprawl has differing causes and consequences in different regions and regulatory contexts. Weighted Urban Proliferation (WUP) – the novel method presented in this paper – is based on the following definition of urban sprawl: the more area built over in a given landscape (amount of built-up area) and the more dispersed this built-up area in the landscape (spatial configuration), and the higher the uptake of built-up area per inhabitant or job (lower utilization intensity in the built-up area), the higher the degree of urban sprawl. However, there is a lack of reliable measures of urban sprawl that integrate these three dimensions in a single metric. Therefore, these three independent dimensions need to be combined according to the qualitative assessment of sprawl to create a suitable metric – which is exactly what theWUPmetric does using two weighting functions. Switzerland serves as an example of applying this method to examine the current state, for comparisons among regions, for historical analysis, and for assessing planning scenarios. The degree of urban sprawl in Switzerland increased by 155% between 1935 and 2002, and without rigorous measures, scenarios of future urban sprawl show that it is likely to further increase by more than 50% until 2050. Examples from parts of Switzerland demonstrate that sprawl can be reduced. As a consequence of intense public discussion, the Swiss Spatial Planning Act was revised in 2013 to make it tighter. We conclude that the new method is more suitable than previous methods to quantify the indicator “urban sprawl” in monitoring systems, e.g., it has now been implemented in monitoring systems in Switzerland. The newWUPmethod is highly suitable for performance control of limits to urban sprawl once they are implemented and for application to other countries around the globe.
|
| [38] |
Urban land density function: A new method to characterize urban expansion [J].https://doi.org/10.1016/j.landurbplan.2015.02.017 URL [本文引用: 2] 摘要
Density analysis lies at the core of studies on urban expansion; however, many methods in urban land density analysis are arbitrary and suffer from the lack of an established foundation. We observed an nverse S-shape Rule for urban land density that varies outward from an urban center by investigating 28 major cities in China at three time points. We proposed an inverse S-shaped function to formulate urban land density, which fit well for all of the cities in our sample using a nonlinear least squares fitting method. The parameters of the function explicitly describe the basic properties of an urban form. Based on the fitted functions, we derived an established method for the concentric partitioning of urban area and further proposed indicators to measure the urban compactness, urban expansion rate, and degree of urban sprawl. These indicators are practical for characterizing urban form and urban sprawl for either a single city or for multiple cities. A case study on major Chinese cities from 1990 to 2010 reveals that most of the cities expanded rapidly and became less compact and more dispersed during those two decades. However, most of the cities grew faster and showed more sprawl in the second decade compared to the first one. Discussions show that the model is also applicable for non-monocentric cities and possibly can be applied to many other geographical phenomena.
|
| [39] |
Multi-order landscape expansion index: Characterizing urban expansion dynamics [J].https://doi.org/10.1016/j.landurbplan.2014.10.023 URL [本文引用: 1] 摘要
Most of the landscape metrics used in urban expansion studies are capable of reflecting the spatial characteristics for individual time points, but are not efficient to capture the integrated information from time series data. A few spatial metrics, for example, Landscape Expansion Index (LEI), are calculated based on two-time-point data. These metrics are insufficient for the analysis of urban expansion dynamics based on multi-temporal data. In this study, we propose an improved spatial metric, Multi-order Landscape Expansion Index (MLEI), to measure the expansion degree of newly grown urban patches by considering their relationships with old patches and their spatial context in the process of urban expansion. A case study is conducted in Wuhan, a fast-growing metropolis in central China, based on remote sensing images from three time points (2000, 2005 and 2010). The MLEI map in 2010 clearly shows the areas that have experienced expansive growth. The greatest difference between MLEI and LEI occurs where outlying clusters are formed gradually through time. Some spatial analysis methods are applied on the MLEI map in 2010 to delineate outlying urban clusters in urban expansion. The map of urban clusters clearly shows the spatial heterogenicity of urban expansion and the most expansive areas in Wuhan. This study suggests that MLEI is capable to capture multi-temporal information, and can be used to characterize the spatial structure of urban expansion dynamics.
|
| [40] |
Linkages between ecosystem services provisioning, urban growth and shrinkage: A modeling approach assessing ecosystem service trade-offs [J].https://doi.org/10.1016/j.ecolind.2014.01.028 URL [本文引用: 1] 摘要
Urban regions face transitions in land use that affect ecosystem services (ES) and thus human wellbeing. Especially in urban regions with high population densities and high demand for ES, the future availability of such services must be considered to promote effective and sustainable decision-making and prevent further ecosystem degradation. With a combined model approach focusing on household decisions regarding the choice of residence, future urban land-use development was simulated for metropolitan Berlin, Germany for growth and shrinkage scenarios. We simulate the change in six provisioning, regulating, and cultural ES indicators for both scenarios from 2008 to 2030. We compare regional alterations in ES, ES synergies and trade-offs by merging them into an assessment matrix for each land-use transition. Our results indicate that the land-use transitions that most significantly affect ES degradation or improvement are those from arable land to mainly non-residential uses specially public and private services. The results show that most changes in land use are related to land consumption and soil sealing; however, as urban brownfields provide excellent opportunities for the development of new urban green spaces with superior ES qualities, the shrinkage scenario ended up being very positive in terms of ES improvement.
|
| [41] |
A new landscape index for quantifying urban expansion using multi-temporal remotely sensed data [J].https://doi.org/10.1007/s10980-010-9454-5 URL [本文引用: 3] 摘要
Landscape metrics or indices have been commonly used for quantifying landscape patterns. However, most of these indices are generally focused on simple analysis and description of the characterization of the geometric and spatial properties of categorical map patterns. These indices can hardly obtain the information about the spatio-temporal dynamic changes of landscape patterns, especially when multi-temporal remote sensing data are used. In this paper, a new landscape index, i.e., landscape expansion index (LEI), is proposed to solve such problems. In contrast with conventional landscape indices which are capable of reflecting the spatial characteristics for only one single time point, LEI and its variants can capture the information of the formation processes of a landscape pattern. This allows one to quantify the dynamic changes in two or more time points. These proposed indices have been applied to the measurement of the urban expansion of Dongguan in Guangdong province, China, for the period of 1988 2006. The analysis identifies three urban growth types, i.e., infilling, edge-expansion and outlying. A further analysis of different values of LEI in each period reveals a general temporal transition between phases of diffusion and coalescence in urban growth. This implies that the regularity in the spatiotemporal pattern of urban development in Dongguan, is consistent with the explanations according to urban development theories.
|
| [42] |
Simulating urban growth by integrating landscape expansion index (LEI) and cellular automata [J].https://doi.org/10.1080/13658816.2013.831097 URL [本文引用: 1] 摘要
Traditional urban cellular automata (CA) model can effectively simulate infilling and edge-expansion growth patterns. However, most of these models are incapable of simulating the outlying growth. This paper proposed a novel model called LEI-CA which incorporates landscape expansion index (LEI) with CA to simulate urban growth. Urban growth type is identified by calculating the LEI index of each cell. Case-based reasoning technique is used to discover different transition rules for the adjacent growth type and the outlying growth type, respectively. We applied the LEI-CA model to the simulation of urban growth in Dongguan in southern China. The comparison between logistic-based CA and LEI-CA indicates that the latter can yield a better performance. The LEI-CA model can improve urban simulation accuracy over logistic-based CA by 13.8%, 10.8% and 6.9% in 1993, 1999 and 2005, respectively. Moreover, the outlying growth type hardly exists in the simulation by logistic-based CA, while the proposed LEI-CA model performs well in simulating different urban growth patterns. Our experiments illustrate that the LEI-CA model not only overcomes the deficiencies of traditional CA but might also better understand urban evolution process.
|
| [43] |
A gradient analysis of urban landscape pattern: A case study from the Phoenix metropolitan region, Arizona, USA [J].https://doi.org/10.1023/A:1020512723753 URL [本文引用: 1] 摘要
Urbanization is arguably the most dramatic form of land transformation that profoundly influences biological diversity and human life. Quantifying landscape pattern and its change is essential for the monitoring and assessment of ecological consequences of urbanization. Combining gradient analysis with landscape metrics, we attempted to quantify the spatial pattern of urbanization in the Phoenix metropolitan area, Arizona, USA. Several landscape metrics were computed along a 165 km long and 15 km wide transect with a moving window. The research was designed to address four research questions: How do different land use types change with distance away from the urban center? Do different land use types have their own unique spatial signatures? Can urbanization gradients be detected using landscape pattern analysis? How do the urban gradients differ among landscape metrics? The answers to these questions were generally affirmative and informative. The results showed that the spatial pattern of urbanization could be reliably quantified using landscape metrics with a gradient analysis approach, and the location of the urbanization center could be identified precisely and consistently with multiple indices. Different land use types exhibited distinctive, but not necessarily unique, spatial signatures that were dependent on specific landscape metrics. The changes in landscape pattern along the transect have important ecological implications, and quantifying the urbanization gradient, as illustrated in this paper, is an important first step to linking pattern with processes in urban ecological studies.
|
| [44] |
Landscape ecology: Population genetics at the metapopulation level [J].https://doi.org/10.1007/BF00130027 URL [本文引用: 1] 摘要
Distribution of genetic diversity in a landscape depends on both within and among population processes. Selective pressures within populations have traditionally been studied by population genetics, which usually assumes that populations are at equilibrium. However, when selection pressures within and among populations are different, landscape processes are required to define an equilibrium (landscape being defined as the habitat of a set of populations called a metapopulation, and populations will differ depending on their situation in the landscape, i.e. their age and the state of neighboring populations). We examine reproduction systems and life history traits, for which variation depends on landscape processes. Predictions of their states in a metapopulation are drawn from theoretical models, and confronted to observations collected in natural populations.
|
| [45] |
Indices of landscape pattern [J].https://doi.org/10.1007/BF00162741 URL [本文引用: 1] |
| [46] |
Monitoring water stress induced variation in the remotely sensed biomass pattern of Sardinia (Italy) with variograms [J].https://doi.org/10.1046/j.1526-0992.1999.09944.x URL [本文引用: 1] 摘要
ABSTRACT In Mediterranean climates, the most important ecological factor for natural vegetation as well as for crops is low summer rainfall coinciding with a period of maximum temperatures creating a more or less prolonged period of intense drought. During the summer, water stress enhances the differences between adjacent landscape elements in terms of plant biomass distribution giving way to increased vegetation cover heterogeneity. The aim of this article is to use variogram analysis to quantitatively estimate water stress-induced oscillations in remotely sensed biomass spatial distribution of Sardinia (Italy).
|
| [47] |
Characterizing growth types and analyzing growth density distribution in response to urban growth patterns in peri-urban areas of Lianyungang City [J].https://doi.org/10.1016/j.landurbplan.2012.01.017 URL [本文引用: 1] 摘要
Peri-urban areas are sites currently experiencing the most active urbanization. In order to quantify the complexity in urban growth patterns and processes, based on the common boundary and Landscape Expansion Index (LEI) analysis, we developed six spatial rules to identify three urban growth types of infilling, edge-expansion and outlying in 2000–2008. In addition, growth density (GD) with buffer zone analysis was applied to ascertain urban movement from the city center. Results indicated the prominent urban growth type was edge-expansion, with continued urbanization most prominently in the peri-urban areas. The infilling growth increment proportion in the second study period (2004–2008) suggested the study area was experiencing an increased coalescence pattern and declined diffusion pattern. However, the highest infilling GD zones that occurred primarily near the city center did not vary significantly in 2000–2008. The intensive urban growth zones in the first study period (2000–2004) followed by later efficient infill growth also suggested urban growth was more compact in the second study period. Furthermore, two land use change maps showed that substantial arable land was lost by urban growth in 2000–2008, and the establishment of industrial parks encroached on large salt marsh in the second study period. Further research is required to delineate a suitable development management plan to sustain a baseline for urban growth. Furthermore, the integration of a zoning approach associated with the green belt is suggested to play a key role in a transition to continued urbanization.Graphical abstract
|
| [48] |
Change in spatial characteristics of forest openings in the Klamath Mountains of northwestern California, USA [J].https://doi.org/10.1007/BF00129256 URL [本文引用: 1] |
| [49] |
Spatial analysis of land-use changes as knowledge tools in support of European spatial policies and ecosystem health [J].https://doi.org/10.1046/j.1526-0992.1999.09946.x URL [本文引用: 1] 摘要
ABSTRACT Cost-effective decision making calls for appropriate methods for the modeling, forecasting, and presentation of problem-specific information. This paper discusses the systematic use of remote-sensing derived information to assess the impact of past policies and to support the definition of sustainable European spatial policies through an example of landscape change analysis. A case study of landscape changes along parts of the European coastline between the mid-70s and early-90s is reported, providing an integrated assessment addressing possible causes and effects related to natural and labor resources. The impact of human activities on changes in the natural landscape is discussed both from a qualitative and a quantitative viewpoint.
|
| [50] |
Responses of landscape metrics to altering grain size in the Three Gorges Reservoir landscape in China [J].https://doi.org/10.1007/s12665-016-5605-6 URL [本文引用: 1] 摘要
Quantifying the response of landscape metrics to an altering observation scale is crucial to understanding environmental changes and managing ecosystem services. Whereas the scaling behaviors of landscape metrics in spatial heterogeneity analysis have been well identified by previous research, there remains a need to examine these effects in areas undergoing rapid change. Here, we aim to reveal the landscape scale effect in the Three Gorges Reservoir (TGR) area, China, using a case study on Zigui County. We applied a suite of common landscape metrics (12 indices at the class level and 17 indices at the landscape level) to characterize the landscape pattern and examine the response of the metrics to altering grain size using a series of land-use/land-cover data with gradient resolutions. The results reveal that significant scale effects exist in most pattern metrics in the TGR landscape. In addition, the different responses to the altering grain size occurred with different landscape metrics and various land-use/land-cover types. With respect to changing grain size, all of the selected pattern metrics at the landscape level displayed high or medium sensitivity in response to changing grain size except the Fractal Dimension Index and the landscape-diversity indices. The behavior of the metrics in response to altering grain size can be grouped into four types (Type 1, Type 2, Type 3, and Type 4). The class-level metrics with high sensitivity were Mean Patch Size, the Contiguity Index, the Euclidean Nearest-Neighbor Distance, the Perimeter-Area Ratio, and Patch Density for all land-use/land-cover types, whereas low sensitivities were detected in the response of the Fractal Dimension Index and the Largest Patch Index. Based on the response to the altering resolution of input data, the class-level metrics could be grouped into three types (Type a, Type b, and Type c). Considering the scaling behavior of landscape metrics, we suggest using a set of suitable remote-sensing images to quantify the landscape pattern in the TGR landscape and similar areas.
|
| [51] |
Coupled dynamics of urban landscape pattern and socioeconomic drivers in Shenzhen, China [J].https://doi.org/10.1007/s10980-014-9995-0 URL [本文引用: 1] 摘要
The effects of land use policy and socioeconomic changes on urban landscape dynamics have been increasingly investigated around the world, but our knowledge of the underlying processes of these effects is still inadequate for sustainably managing urban ecosystems. Thus, the main goal of this study was to understand: (1) the changes in urban landscape, population, and economic conditions over a 36-year period, and (2) the coupled dynamics of land use policy, landscape structure, major demographic features, and three kinds of industries in one of the most dazzling modern cities of China—the Shenzhen special economic zone (SEZ). The landscape expansion index was used to explore the developed-land expansion under different land use policies while structural equation modeling (SEM) was used to analyze the relationship among three variables ( Land Cover Change or LCC , Economy , and Population ). We found that the urban expansion during the four periods (1973–1979, 1979–1995, 1995–2003, and 2003–2009) was not always at the expense of urban vegetation cover. The importance of each socioeconomic driver during the four periods was not consistent over time, with policy shifts as the primary driver. Our SEM showed that Economy played a more important role than Population in driving LCC in the Shenzhen SEZ. Meanwhile, the secondary and tertiary industries had a stronger influence than the primary industry; and the floating population had a greater effect than the registered permanent population.
|
| [52] |
Development of a geospatial model to quantify, describe and map urban growth [J].https://doi.org/10.1016/S0034-4257(03)00074-9 URL [本文引用: 1] 摘要
In the United States, there is widespread concern about understanding and curbing urban sprawl, which has been cited for its negative impacts on natural resources, economic health, and community character. There is not, however, a universally accepted definition of urban sprawl. It has been described using quantitative measures, qualitative terms, attitudinal explanations, and landscape patterns. To help local, regional and state land use planners better understand and address the issues attributed to sprawl, researchers at NASA's Northeast Regional Earth Science Applications Center (RESAC) at The University of Connecticut have developed an urban growth model. The model, which is based on land cover derived from remotely sensed satellite imagery, determines the geographic extent, patterns, and classes of urban growth over time. Input data to the urban growth model consist of two dates of satellite-derived land cover data that are converted, based on user-defined reclassification options, to just three classes: developed, non-developed, and water. The model identifies three classes of undeveloped land as well as developed land for both dates based on neighborhood information. These two images are used to create a change map that provides more detail than a traditional change analysis by utilizing the classes of non-developed land and including contextual information. The change map becomes the input for the urban growth analysis where five classes of growth are identified: infill, expansion, isolated, linear branch, and clustered branch. The output urban growth map is a powerful visual and quantitative assessment of the kinds of urban growth that have occurred across a landscape. Urban growth further can be characterized using a temporal sequence of urban growth maps to illustrate urban growth dynamics. Beyond analysis, the ability of remote sensing-based information to show changes to a community's landscape, at different geographic scales and over time, is a new and unique resource for local land use decision makers as they plan the future of their communities.
|

/
| 〈 |
|
〉 |


