曹峥 , 吴志峰, 马文军
CAO Zheng, WU Zhifeng, MA Wenjun
通讯作者:
收稿日期: 2017-07-4
修回日期: 2017-10-13
网络出版日期: 2018-04-20
版权声明: 2018 地理科学进展 《地理科学进展》杂志 版权所有
基金资助:
作者简介:
作者简介:曹峥(1989-),男,山东济南人,博士生,主要从事城市生态与人居环境研究,E-mail: jnczdl@163.com
展开
摘要
为探究不同类型建成区能源消耗与城市热环境特征的关系,本文利用中尺度天气预报模式(Weather Research & Forecasting,WRF)对2010年7月2日-7月6日发生在广州地区的一次高温热浪过程进行数值模拟试验,定量分析了逐日平均气温及逐日气温日较差对人为热排放的时空敏感性。结果表明:①WRF模型能够较好地实现2010年7月2日-7月6日高温热浪期间气温的模拟,模拟结果与气象观测结果的相关系数均大于0.80,均方根误差均小于2.27;②逐日平均气温空间分布特征为:高密度住宅区>商业区>低密度住宅区;逐日气温日较差空间分布特征为:低密度住宅区>高密度住宅区>商业区;③人为热排放使得3种类型建成区平均气温升高,且人为热的增温效应与高密度住宅区、低密度住宅区及商业区的建筑密度的空间关联度分别为0.17、0.13和0.16;④人为热排放使得三种类型建成区的气温日较差降低,且气温日较差减少程度与高密度住宅区、低密度住宅区及商业区建筑密度的空间关联度分别为0.14、0.15及0.19;⑤当人为热排放为正常排放的两倍时,人为热的增温效应、人为热对气温日较差的减小作用与不同类型建成区的建筑密度空间关联度均有增强趋势。
关键词:
Abstract
Along with the rapid urbanization process, large amounts of anthropogenic heat are released into the atmosphere, which are becoming a key issue for regional weather condition. To understand what role anthropogenic heat release plays in regional temperature warming, Weather Research & Forecasting (WRF) model was applied to simulate temperature during 2-6 July 2010 with different configuration of anthropogenic heat release. The results indicate that the simulated temperature is consistent with the meteorological station observation data, with the correlation coefficient of 0.89 and the root-mean-square error of 2.96. High density residential area had the highest daily average temperature followed by industrial or commercial zone and low density residential area. On the other hand, low density residential area had the highest daily diurnal temperature range followed by high density residential area and industrial or commercial zone. Anthropogenic heat release caused a notable warming in the whole downtown area of Guangzhou City, which was more significant in high density residential area and commercial zone than low density residential area. The spatial association between temperature rise caused by anthropogenic heat release and building density is 0.17 (high density residential area), 0.14 (low density residential area), and 0.16 (industrial or commercial zone), respectively. Conversely, anthropogenic heat release decreased diurnal temperature range (the difference between daily maximum temperature and daily minimum temperature), which was more significant in high density residential area and commercial zone than low density residential area. The spatial association between daily temperature range decrease caused by anthropogenic heat release and building density is 0.14 (high density residential area), 0.15 (low density residential area), and 0.19 (industrial or commercial zone). Furthermore, when doubling the anthropogenic heat release, the spatial association between building density and simulated temperature rise and daily temperature range decrease was enhanced.
Keywords:
IP CC第五次评估报告指出,全球气温升高已成为无可争议的事实,且近30年是全球气温升高最为明显的时期(Intergovernmental Panel on Climate Change, 2014)。城市区域由于城市化过程的影响已成为全球升温最为明显的热点之一(Li et al, 2013; Wu et al, 2013)。现有研究表明城市区域增温的2个主要要素为城市化过程及人为热排放(曲建升等, 2003; 蒙伟光等, 2010; 麦健华等, 2011; 崔耀平等, 2015; 李炟等, 2015; 李元征等, 2016; 方迎波等, 2017)。不同于城市化过程,人为热排放是促使气温升高的一种内在能量源,是指由于工业生产、汽车排放、人体新陈代谢、空调使用等排放出的多余热量,这种能量直接被排放到大气中,通过影响城市能量平衡、水汽交换等最终影响城市气温(张弛等, 2011)。最早针对人为热增温效应的研究多是基于污染排放清单(Lee, Song et al, 2009; Lee, Mckeen et al, 2014; Koralegedara et al, 2016),此方法假定人为热排放在城市内部平均分布,且无季节性差异,利用自上而下或自下而上的方法,根据工业排放、汽车保有量、生活消耗等数据计算人为热排放的平均量。随着遥感技术的发展,美国陆地资源卫星(Landsat)、夜间灯光数据(DMSP-OLS)也被应用于人为热排放或人为热导致的城市热岛效应研究 (Kato et al, 2005; Peng et al, 2016)。但由于人为热的精确排放量非常难以估算,因此准确地评估人为热排放对于气温升高的贡献率存在困难。21世纪以来,随着计算机运算能力及数值模拟理论的发展,中尺度气候模型如MM5(Mesoscale Model 5,MM5)耦合了较为精准的人为热排放量及日排放曲线,使得定量评估人为热排放对气温升高的贡献率成为可能(Fan et al, 2005; Lee, Song et al, 2009)。WRF(Weather Research & Forecasting, WRF)模型作为新一代中尺度天气预报模型,最初应用于城市天气要素业务预报,随着其参数多样化、空间分辨率高的特点被众多学者认可,近年来越来越多应用于城市气候特征变化及其影响因素研究,并且WRF模型对人为热的局地增温效应模拟精度较高(Feng et al, 2012; 陶玮等, 2014; 郑玉兰等, 2017)。现有研究分析表明,人为热排放具有局地增温效应且此效应具有时空差异性,夏冬两季增温效应强于春秋两季,城市大于郊区;人为热排放的减少能有效地减轻城市热岛效应。
现有的研究区域均为城市群或单个城市,其研究的时间尺度通常将一年作为基本单位(Block et al, 2004; Narumi et al, 2009; Pigeon et al, 2007),而对于短时间尺度城市内部区域特别是人口稠密区人为热的增温效应研究较为缺乏,但短时间内人为热的增温效应对人类生产生活及人体健康的影响更为明显(Heaviside et al, 2016),并且城市内部小尺度人为热增温效应研究对于合理的城市规划及公共资源配置也具有指导意义。为探究精细空间尺度内人为热排放的短期影响效应,本文将利用WRF/UCM模型对2010年7月2-6日广州市的一次高温热浪进行数值模拟试验,通过有无人为热排放及2倍人为热排放的敏感性试验探讨人为热排放增温效应的空间差异,并利用地理探测器揭示人为热与不同建成区类型密度之间的空间关联。
2.1.1 人为热排放量估算
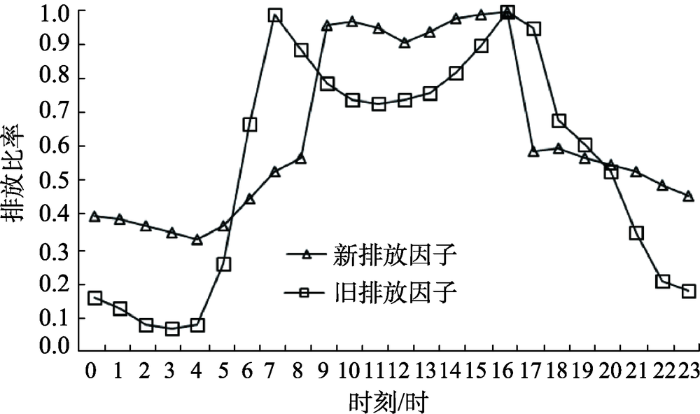
本文考虑3种人为热排放源:工业排放、交通排放、生活排放,假定3种排放平均分布于城市建成区内,且无季节性差异(王志铭等, 2011)。采用能源清单法(陆燕等, 2014; 王建鹏等, 2015),利用广州市汽车保有量、年均行驶里程、生活消费的能源总量等数据(广州市2011年统计年鉴),按照(Kimura等(1991))及(车汶蔚(2010))研究中对日排放比率的分配结果,估算出广州市各时段内人为热排放通量及比率变化曲线,并替代WRF模型中旧的逐小时人为热排放比率(图1)。新排放因子为工业排放、交通排放及生活排放的综合分类结果,9-16时为人为热高排放阶段,0-5时为低排放阶段。广州市人为热日排放通量全天平均为42W/m2,最大值为73 W/m2,出现在10时。此人为热估算结果与王志铭等(2001)计算的2009年广州市人为热排放量相比仅增长0.9%,并与人为热排放的逐年增长趋势相一致。
2.1.2 土地利用/覆被数据
广州市土地利用/覆被数据来自于清华大学制作的Globaland30-2010数据集(http://www.globallandcover.com)。该数据利用30 m多光谱影像,包括美国陆地资源卫星(Landsat) TM5、ETM+多光谱影像和中国环境减灾卫星(HJ-1)多光谱影像进行土地利用/覆被类型分类。数据分类类型包括10大类,分别为:耕地、森林、草地、灌木丛、水体、湿地、苔原、人造覆被、裸地、冰川与永久积雪。Globaland 30数据的总体精度达到60%以上。广州市主城区建筑密度数据来自广东省地理国情监测与综合分析工程技术研究中心,包括住宅区(高密度、低密度)和商业区。研究中将所有数据的空间分辨率均重采样为500 m。土地利用数据分类见表1。
表1 土地利用数据简介
Tab.1 Summary of land use/cover data
| 数据名称 | 数据分类 | 分辨率/m | |
|---|---|---|---|
| 一级类 | 二级类 | ||
| Globaland30 | 耕地 | 水田、旱地、菜地、雨养旱地、牧草种植地等 | 30 |
| 森林 | 落叶阔叶林、常绿阔叶林、落叶针叶林、常绿针叶林、混交林 | ||
| 草地 | 草原、草甸、稀树草原、荒漠草原、人工草地 | ||
| 灌木地 | 山地灌丛、落叶灌丛、常绿灌丛、荒漠灌丛 | ||
| 湿地 | 内陆沼泽、湖泊沼泽、河流洪泛湿地、森林/灌木湿地、泥潭沼泽、红树林 | ||
| 水体 | 江河、湖泊、水库、坑塘 | ||
| 苔原 | 灌丛苔原、禾本苔原、湿苔原、高寒苔原、裸地苔原 | ||
| 人造地表 | 居民地、工矿、交通设施 | ||
| 裸地 | 荒漠、沙地、砾石地、裸岩、盐碱地 | ||
| 冰川/永久积雪 | 永久积雪、冰川、极地冰盖 | ||
| 广州市中心城区建筑密度数据 | 居住地 | 高密度住宅区、低密度住宅区 | 500 |
| 商业用地 | |||
2.1.3 气象观测数据
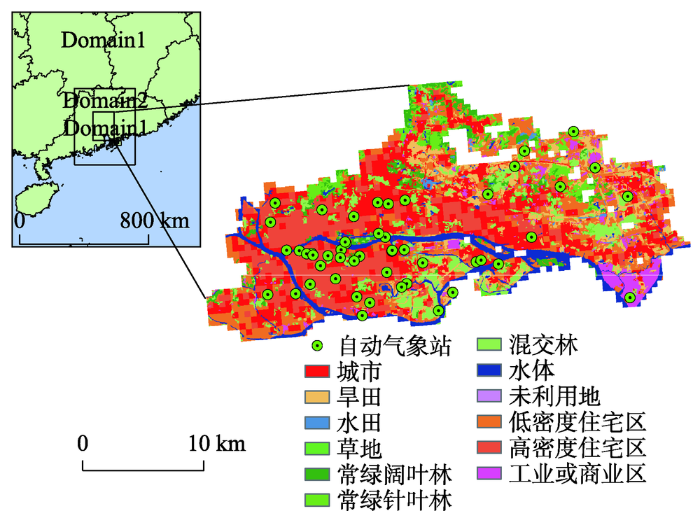
广州市中心城区2010年7月2-6日21个自动站点气象数据来自于广东省气候中心(图1),主要气象要素包含逐小时风速、逐小时正点气温、逐小时累计降雨量、逐小时正点相对湿度及逐小时正点气压。
2.2.1 研究区域概况
研究区域位于广州市中心城区,涉及荔湾区、越秀区、海珠区、天河区及黄浦区,介于113.17°E~113.56°E、23.03°N~23.24°N之间,总面积为467.75 km2,总人口为380.2万(2010人口普查数据)。主要用地类型包括居民居住地、商业用地、草地及林地等。研究区2010年能源消耗量为4 024 805 kW·h,占广州市能源消耗总量的50.3%,较高的能源消耗使得此地区成为人为热排放“热点区域”。
2.2.2 试验设计
数值模拟采用WRF 3.5版本,使用三重1∶3嵌套,中心经纬度为113.37°E、23.13°N,网格数分别为124×157、124×157、130×175,对应的网格分辨率为9 km (Domain1)、3 km (Domain2)、1 km (Domain3)(图2)。模拟时间为北京时间2010年6月30日8时0分0秒-2010年7月8日4时0分0秒,其中前40小时为模式spin-up。初始气象边界条件为1°×1°的fnl再分析资料,此数据空间分辨率为1°,时间分辨率为6 h。模式选用的物理参数方案为:Lin微物理过程,Goddard短波辐射方案,rrtm长波辐射方案,MYJ边界层条件,Noah陆面过程方案和UCM城市冠层方案,最外层 (Domain1)土地利用/覆被数据为模式自带的30 s分辨率数据,最内层 (Domain3)土地利用/覆被数据为Globaland 30数据。
图2 研究区域土地利用类型及自动站点空间分布图
Fig.2 Land use/cover type and spatial distribution of automatic meteorological stations in the study area
为探究人为热及城市化对热浪期间气温的影响,本文在第三重嵌套区域设计了3个敏感试验。试验A第三重嵌套即Domain 03不引入人为热排放,试验B引入真实人为热排放,试验C人为热排放为试验B的2倍;通过对比3次试验,能得出人为热排放对高温热浪期间气温的影响。
2.2.3 模拟结果验证
利用偏差(Bias)、相关系数(R)及均方根误差(RMSE)对模拟结果进行检验,各指标计算公式如下:
式中:Xexp表示以观测站点为圆心,100 m为半径的缓冲区内平均模拟气温值;Xms为气象站点气温逐日值;
2.2.4 地理探测器
地理探测器用于评估2种地理环境要素的空间异质性联系。其基本原理为:若要素Y与要素X的空间异质性特征一致,则认为两者存在空间关联。可利用式(4)进行计算:
式中:h=1,……,L为变量Y或因子X的分层;即分类或分区;Nh和N分别为层h和全区的单元数;
Xexp与Xms对比表明,模拟结果存在冷偏差,即模拟温度小于真实温度值。5天的气温模拟结果与真实观测数据相关系数均达到0.80以上,均方根误差均小于2.27。为进一步检验WRF模型对不同类型建成区气温的模拟能力,本文挑选了主城区内自动气象站进行进一步检验,结果显示不同建成区模拟气温与自动监测站数据的相关系数高于0.8,均方根误差小于2.27。以上结果表明:模拟结果无论是在时间尺度还是针对不同建成区类型都与观测结果具有较高的一致性(表2)。
表2 气温模拟结果验证
Tab.2 Validation of the simulated temperature at 2 meter height
| Bias/℃ | R | RMSE | |
|---|---|---|---|
| 7月2日 | -0.36 | 0.81 | 2.22 |
| 7月3日 | -0.25 | 0.85 | 2.20 |
| 7月4日 | -0.29 | 0.82 | 2.27 |
| 7月5日 | -0.22 | 0.88 | 2.16 |
| 7月6日 | -0.15 | 0.89 | 2.13 |
| 高密度住宅区(7月2-6日) | -0.17 | 0.91 | 2.01 |
| 低密度住宅区(7月2-6日) | -0.20 | 0.87 | 2.10 |
| 商业区(7月2-6日) | -0.26 | 0.80 | 2.25 |
本文选取了逐日平均气温及逐日气温日较差2个气象要素来分析不同类型建成区气象特征的时空分布特征。
3.2.1 不同类型建成区逐日平均气温时空特征
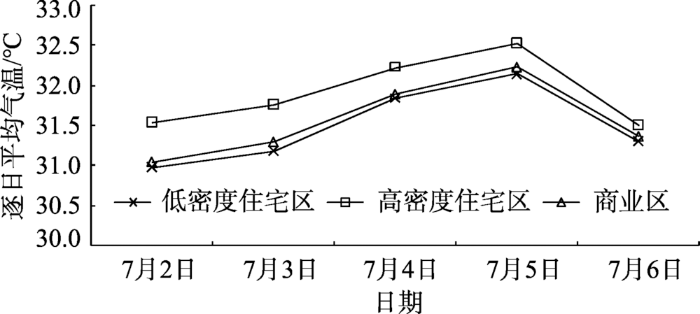
不同类型建成区逐日平均气温呈现先升高后下降的趋势,这可能与热浪强度趋势一致。高密度住宅区逐日平均气温最大,高密度住宅区与另外2种类型最大温差达到0.57 ℃(高密度住宅区—低密度住宅区)、0.50 ℃(高密度住宅区—商业区);商业区的逐日平均气温略高于低密度住宅区,两者最大温度差为0.10 ℃(图3)。这种现象的产生可能与建筑物密度相关。(Correa等(2012))与(Huang等(2015))的研究指出,高密度住宅区及商业区由于其建筑密度大,导致其通风廊道较短,从而使得风场的降温作用被减弱;同时由于建筑密度较高,使得此类型区域的植被覆盖度较低,进一步减弱了植被的降温作用。
图3 不同类型建成区逐日平均气温变化图
Fig.3 Daily average temperature in different types of built-up land
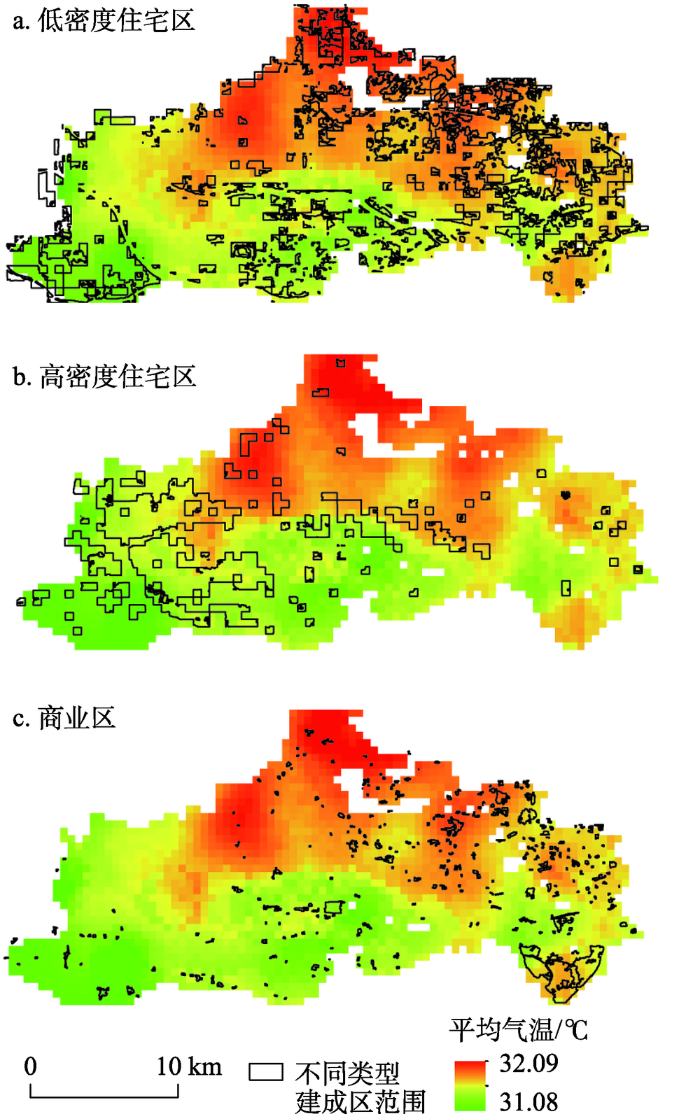
7月2-6日逐日气温平均值介于32.09~31.08℃之间(图4)。高温区位于荔湾区东北部、越秀区海珠区西部以及天河区西部,此区域的平均气温为31.94℃;天河区东部、海珠区东部及黄浦区为低温区,此区域的平均气温为31.22℃。气温与不同类型建成区类型叠加效果显示,高温区与高密度住宅区空间分布较为一致,低温区主要位于商业区与低密度住宅区。
图4 不同类型建成区逐日平均气温空间分布图
Fig.4 Spatial distribution of daily average temperature in different types of built-up land
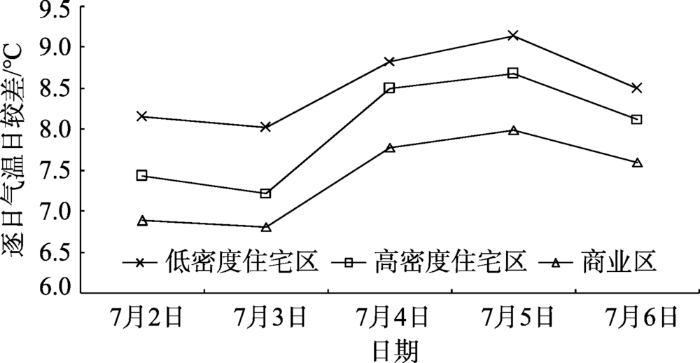
3.2.2 不同类型建成区逐日气温日较差差异
不同类型建成区逐日气温日较差呈现先降低后上升最后下降的趋势。低密度住宅区的逐日气温日较差最大,区域内最大值为9.12℃,出现在7月5日,最小值为8.02℃,出现在7月3日;高密度住宅区逐日气温日较差次之,最大值为8.67℃,出现在7月5日,最小值为7.22℃,出现在7月3日;商业区的气温日较差最小,最大值为7.99℃,同样出现在7月5日,最小值为6.89℃,出现在7月2日。不同类型建成区气温日较差的差异性可能与其所处区域的城市不透水面强度有关。(Hinkel等(2003))对阿拉斯加巴罗地区的研究表明,伴随着城市不透水面面积的增加,气温日较差有减小的趋势。而高密度住宅区、商业区下垫面类型多为不透水面,不透水面具有储热能力强的特征,可在白天将太阳辐射进行存储,在夜间进行释放使得夜间气温较高;同时,此过程使得高密度住宅区、商业区昼夜温差较小(图5)。
图5 不同类型建成区逐日平均气温变化图
Fig.5 Daily diurnal temperature range in different types of built-up land
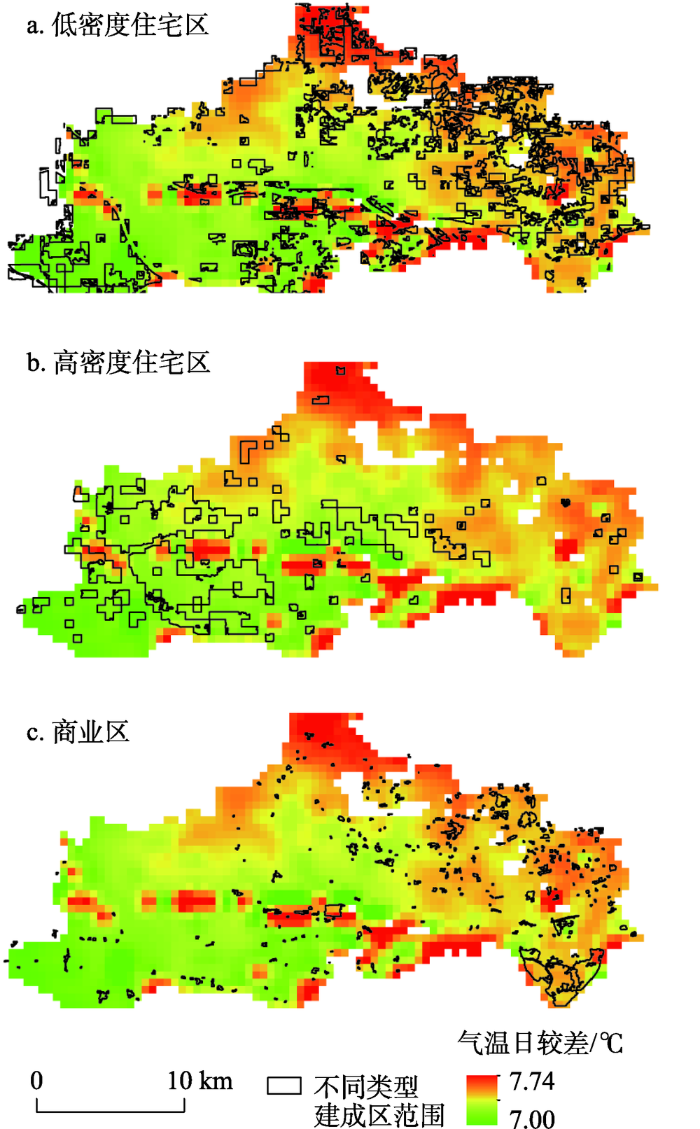
7月2-6日平均气温日较差介于7.00~7.74℃之间(图6)。气温日较差高值区位于荔湾区西南部、天河区北部及东北部、黄浦区西北部,此区域日较差平均值为7.59℃;气温日较差低值区位于荔湾区西北部、海珠区北部、天河区南部、黄浦区西南及东南部,此区域平均气温日较差为7.20℃。气温日较差与不同类型建成区数据叠合显示,气温日较差高值区与低密度住宅区空间重合度高,气温日较差低值区域则主要位于高密度住宅区与商业区内。
图6 不同类型建成区气温日较差空间分布图
Fig.6 Spatial distribution of temperature range in different types of built-up land
3.3.1 对逐日平均气温的影响
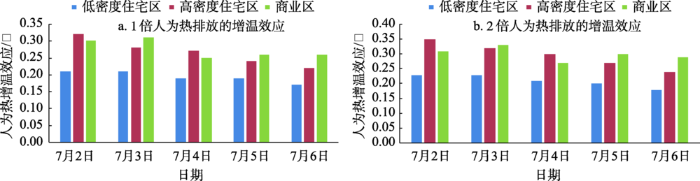
图7为人为热在低密度住宅区、高密度住宅区及商业区的增温作用。结果表明,人为热增温效应在研究时段内呈现缓慢减小的趋势,这可能与热浪过程减弱相关;人为热排放在不同类型建成区均有增温作用,且高密度住宅区(0.19℃)与商业区(0.32℃)的增温效应最为明显,低密度住宅区(0.18℃)增温效应较弱;当人为热排放量翻倍时,其增温效应在不同类型建成区更为明显,增幅表现为高密度住宅区(0.03℃)>商业区(0.02℃)>低密度住宅区(0.01℃)。
图7 不同类型建成区人为热增温效应对逐日气温影响
Fig.7 The impact of temperature rising caused by anthropogenic heat release on daily mean temperature in different types of built-up land
利用地理探测器分析不同建成区建筑物密度对于人为热增温效应的空间解释度(表3),结果表明:人为热增温效应与不同建成区建筑密度存在空间关联,且表现为高密度住宅区(0.17)>商业区(0.16)>低密度住宅区(0.13);伴随着人为热排放量的翻倍,人为热增温效应与建筑物密度的空间关联度均增强,增幅呈现为高密度住宅区(0.04)>商业区(0.03)>低密度住宅区(0.02)。上述现象表明不同类型建成区人为热的增温效应可能与建筑物的类型相关。(Strømann-Andersen等(2011))的研究表明,适当降低建筑密度将有助于缓解城市热环境。其研究认为,在夏季时建筑密度增大时,虽然楼体间遮阳作用使得制冷设备使用率下降,但照明设备的使用率却大幅度增加,使得城市温度大幅度上升。
表3 人为热增温效应与不同类型建成区建筑密度的空间关系
Tab.3 Spatial association between temperature rising caused by anthropogenic heat release and building density in different types of built-up land
| 建成区类型 | 高密度住宅区 | 低密度住宅区 | 商业区 |
|---|---|---|---|
| 1倍人为热增温效应q值 | 0.17** | 0.13** | 0.16** |
| 2倍人为热增温效应q值 | 0.21** | 0.15** | 0.19** |
| q值增幅 | 0.04 | 0.02 | 0.03 |
3.3.2 对逐日气温日较差的影响
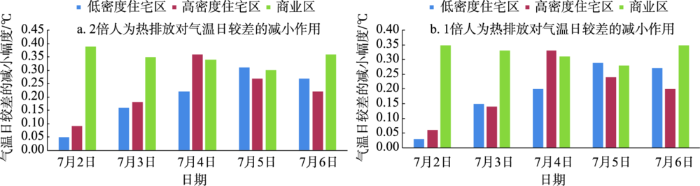
人为热排放对不同类型建成区气温日较差的影响分析表明(图8),人为热排放对气温日较差有减弱作用,且减弱作用表现为商业区(0.27℃)>高密度住宅区(0.26℃)>低密度住宅区(0.19℃) ;热浪期间人为热排放对气温日较差的减弱作用呈现先升高后减弱的趋势;当人为热排放量增加时,其对气温日较差的减弱作用也增强,增幅表现为高密度住宅区(0.03℃)>商业区(0.02℃)>低密度住宅区(0.01℃)。
图8 不同类型建成区人为热排放对气温日较差的减小作用
Fig.8 The impact of anthropogenic heat release on daily temperature range in different types of built-up land
利用地理探测器分析不同建成区建筑物密度对于人为热造成的气温日较差减小幅度的空间解释度(表4),结果表明,人为热造成的气温日较差减弱幅度与不同建成区建筑密度存在空间关联,且表现为商业区(0.19)>低密度住宅区(0.15)>高密度住宅区(0.14);伴随着人为热排放量的翻倍,人为热造成的气温日较差减弱程度与建筑物密度的空间关联度均增强,增幅呈现为商业区(0.04)>高密度住宅区(0.02)>低密度住宅区(0.01)。此现象表明人为热排放对气温日较差的影响与建筑物密度存在关联。(Yang等(2015))的研究表明,建筑物密度增加时逐日最高气温会有所增强。其原因可能是太阳辐射被道路、墙体多次反射,而这个反射过程导致墙体对太阳辐射的吸收能力增强,进而增强了逐日最高气温,逐日最高气温的升高又使气温日较差增大。
表4 气温日较差减弱程度与不同类型建成区建筑密度的空间关系
Tab.4 Spatial association between daily temperature range decreasing caused be anthropogenic heat release and building density in different types of built-up land
| 建成区类型 | 高密度住宅区 | 低密度住宅区 | 商业区 |
|---|---|---|---|
| 1倍人为热增温效应q值 | 0.14** | 0.15** | 0.19** |
| 2倍人为热增温效应q值 | 0.16** | 0.16** | 0.23** |
| q值增幅 | 0.02 | 0.01 | 0.04 |
本文利用WRF模型对广州市主城区2010年7月2-6日的一次热浪过程进行了模拟,并通过情景模拟的方法测定了不同类型建成区平均气温及气温日较差对于人为热排放的敏感性。结果表明:研究时段内广州市主城区逐日平均气温商业区>高密度住宅区>低密度住宅区,此结果与(Guo等(2015))对广州市主城区不同密度建筑热环境研究结论相似(即高层高密度区域处于高温区域)。这种现象的出现可能与其地表覆被类型相关(Weng et al, 2007)。首先,在高密度住宅区、商业区地表覆盖基本为不透水面,由于其具有比热小的热力特性,因此造成其升温快的特点,最终导致此地区成为高温区域;其次,此类型区域植被覆盖度较低,(Giridharan等(2008))的研究表明,当研究区域有低植被覆被时,其温度可比高植被覆盖地区高0.5~1℃,这可能是由于此类地区地表反照率较小,白天不能够将大部分的太阳辐射反射到大气层,而在夜晚地表长波辐射又不能轻易穿透,进一步使得此地区温度升高。
逐日气温日较差在空间上表现为:低密度住宅区>高密度住宅区>商业区。此结论与(吴风波等(2015))对长江三角洲地区城市化的局地气候效应研究结论相似。后者研究结果表明,伴随着城市化过程,大面积不透水面产生,其将导致气温日较差的减小,而这种现象产生的可能原因为:不透水面的增加会导致白天和夜间的气温均呈现升高的趋势,但在夜间最低气温上升更为明显,这主要是由于不透水面能的热力性质,导致其显热通量减小。
人为热排放的作用主要有2个:增强逐日平均气温、减小逐日气温日较差。这与(Chen等(2009))、(Wang等(2015))的研究结果一致。根据(Oke(1988))在1988年提出的城市能量平衡公式,太阳的短波辐射是城市区域主要的能量来源,地表除去存储的能量外将大部分能量以长波辐射的形式反射到大气中,但人为热的加入将使地表多出一部分额外的能量来源,因此产生了人为热的增温效应。逐日气温日较差减小则是由于,在白天以短波辐射为主,而人为热排放量远远小于短波辐射,因此人为热排放量对白天的气温影响较小;但在夜晚太阳短波辐射消失,以长波辐射为主,但长波辐射的能量与人为热排放量基本相当,因此当加入人为热时,夜间气温升高,最终导致气温日较差缩小。此外,地理探测器结果表明,人为热的增温效应和人为热排放对气温日较差的减小作用均与建成区密度有空间关联,但这种关联并不明显,可能是因为城市热环境并非单由人为热排放这一个因素所决定,也可能与植被覆盖、水体面积、大气环流等其他因素相关。不同与现有研究,本文着重对不同类型建成区的人为热敏感性进行探讨,结果表明,人为热增温作用表现为:商业区>高密度住宅区>低密度住宅区;人为热对逐日气温日较差减弱作用表现为:商业区>高密度住宅区>低密度住宅区。这种现象出现的可能原因与模式控制城市冠层参数变量有直接关系。UCM城市观测中对气温模拟会产生影响的参数包括人为热日排峰值、楼体高度、楼顶宽度、楼顶反照率、楼体热容量等(Kusaka et al, 2012)。以人为热日排放峰值为例,商业区的日排放峰值为90 W/m2,高密度住宅区为50 W/m2,低密度住宅区仅20 W/m2。虽然上述2种类型建成区每日人为热排放曲线一致,但每日人为热排放总量相差明显(商业区与高密度城区人为热排放相差610 W/m2,高密度住宅区与低密度住宅区相差475.5 W/m2),由此导致了2种类型的建成区人为热敏感性差异较大。
本文也存在一定的不足:所采用的UCM参数除人为热日排放曲线外,其余均为默认值,可能会使模拟结果与真实情景存在一定的偏差;其次,本文的关注重点为夏季,但冬季人为热排放更为明显,其对气温的影响有待进一步探索。
The authors have declared that no competing interests exist.
| [1] |
珠江三角洲高时空分辨率机动车污染排放清单开发及控制对策研究 [D].A highly resolved mobile source emission inventory in the Pearl River Delta and assessment of motor vehicle pollution control strategies [D]. |
| [2] |
京津唐城市群土地利用变化的区域增温效应模拟 [J].https://doi.org/10.5846/stxb201305191114 URL Magsci [本文引用: 1] 摘要
土地利用变化与大气相互作用,影响区域气候,而城市及其周边地区受人类活动影响很大,成为土地利用变化最为强烈的区域。利用耦合了城市冠层模型的中尺度大气模式(WRF/UCM),在2008年的初始大气条件和边界条件下,用20世纪70年代后期和2008年两期京津唐地区土地利用资料替换WRF/UCM模式推荐的地表覆盖数据,模拟分析不同土地利用类型及其变化对应的气候差异情况。在此过程中,利用插值方法(ANUSPLIN)得到京津唐及其周边26个气象站点观测气温的插值数据,并以此在时空尺度上对比验证了模式的模拟结果。结果表明:WRF/UCM较好地模拟出了近地表2 m的气温,无论在空间上还是在时间上都表现良好;由城市扩展主导的土地利用变化导致研究区大部分区域的增温幅度大于0.05 ℃,且最大的增温区域出现在城市扩展区,可达1.31 ℃。此外本研究初步探讨了土地利用变化的增温贡献率,结果显示研究区土地利用变化导致增温0.08 ℃,整体贡献率为9.88%,城市扩展区增温0.29 ℃,表示出了城市扩展导致的增温贡献率达到32.75%。
Modeling urban sprawl effects on regional warming in Beijing-Tianjing-Tangshan urban agglomeration [J].https://doi.org/10.5846/stxb201305191114 URL Magsci [本文引用: 1] 摘要
土地利用变化与大气相互作用,影响区域气候,而城市及其周边地区受人类活动影响很大,成为土地利用变化最为强烈的区域。利用耦合了城市冠层模型的中尺度大气模式(WRF/UCM),在2008年的初始大气条件和边界条件下,用20世纪70年代后期和2008年两期京津唐地区土地利用资料替换WRF/UCM模式推荐的地表覆盖数据,模拟分析不同土地利用类型及其变化对应的气候差异情况。在此过程中,利用插值方法(ANUSPLIN)得到京津唐及其周边26个气象站点观测气温的插值数据,并以此在时空尺度上对比验证了模式的模拟结果。结果表明:WRF/UCM较好地模拟出了近地表2 m的气温,无论在空间上还是在时间上都表现良好;由城市扩展主导的土地利用变化导致研究区大部分区域的增温幅度大于0.05 ℃,且最大的增温区域出现在城市扩展区,可达1.31 ℃。此外本研究初步探讨了土地利用变化的增温贡献率,结果显示研究区土地利用变化导致增温0.08 ℃,整体贡献率为9.88%,城市扩展区增温0.29 ℃,表示出了城市扩展导致的增温贡献率达到32.75%。
|
| [3] |
长三角城市群表面城市热岛日内逐时变化规律 [J].https://doi.org/10.11867/j.issn.1001-8166.2017.02.0187 URL [本文引用: 1] 摘要
表面城市热岛多时间尺度变化的遥感研究已取得了阶段性进展。然而,受限于热红外遥感模型与数据的不足,目前典型城市群表面城市热岛的日内逐时变化规律仍不清楚。以MODIS(Moderate-resolution Imaging Spectrometer)遥感影像为主要数据源,结合地表温度日内变化INA08模型,率先模拟并分析了长三角城市群在夏、冬两季的表面城市热岛空间格局与热岛强度的逐时变化特征。结果表明:在夏季,日内所有城市整体而言均呈现热岛效应,但由于城市植被或水体的降温作用,白天至上半夜(08:00~21:00)部分城市存在相对“冷点”,而这些“冷点”在21:00之后基本消失。此季节内城市热岛强度与地表温度日内逐时变化规律相似,两者均在上午迅速上升,并于12:00~14:00到达峰值,而后逐渐下降,并持续至次日日出前。在冬季,多数城市在白天出现了“城市冷岛”,但“冷岛”多在午后至傍晚(14:00~17:00)消失,此后所有城市均恢复为“热岛”。此季节内城市热岛强度与地表温度日内逐时变化规律区别较大,且以农田和森林为背景计算的城市热岛强度的逐时变化趋势存在明显差异,前者在日内到达峰值的时间(约18:00)显著晚于后者(约13:30)。
Hourly variation of surface urban heat island over the Yangtze River Delta urban agglomeration [J].https://doi.org/10.11867/j.issn.1001-8166.2017.02.0187 URL [本文引用: 1] 摘要
表面城市热岛多时间尺度变化的遥感研究已取得了阶段性进展。然而,受限于热红外遥感模型与数据的不足,目前典型城市群表面城市热岛的日内逐时变化规律仍不清楚。以MODIS(Moderate-resolution Imaging Spectrometer)遥感影像为主要数据源,结合地表温度日内变化INA08模型,率先模拟并分析了长三角城市群在夏、冬两季的表面城市热岛空间格局与热岛强度的逐时变化特征。结果表明:在夏季,日内所有城市整体而言均呈现热岛效应,但由于城市植被或水体的降温作用,白天至上半夜(08:00~21:00)部分城市存在相对“冷点”,而这些“冷点”在21:00之后基本消失。此季节内城市热岛强度与地表温度日内逐时变化规律相似,两者均在上午迅速上升,并于12:00~14:00到达峰值,而后逐渐下降,并持续至次日日出前。在冬季,多数城市在白天出现了“城市冷岛”,但“冷岛”多在午后至傍晚(14:00~17:00)消失,此后所有城市均恢复为“热岛”。此季节内城市热岛强度与地表温度日内逐时变化规律区别较大,且以农田和森林为背景计算的城市热岛强度的逐时变化趋势存在明显差异,前者在日内到达峰值的时间(约18:00)显著晚于后者(约13:30)。
|
| [4] |
基于土地利用和人为热修正的城市夏季高温数值试验 [J].A numerical simulation experiment of an urban summer heat wave based on modified data of land-use and anthropogenic heat [J]. |
| [5] |
基于遥感监测的城市热岛研究进展 [J].https://doi.org/10.18306/dlkxjz.2016.09.002 URL [本文引用: 1] 摘要
全球正经历快速、高强度的城市化,导致城市热岛加剧,并对城市、区域乃至全球许多的生态环境要素直接或间接地产生多方面的影响,与人类福祉密切相关。遥感具有宽覆盖、信息量大、重复观测周期短等优点,已成为地表城市热岛(Surface Urban Heat Island,SUHI)监测广泛采用的一种方法。针对前人相关研究对热红外数据源、监测指标及SUHI时空变化规律尚缺乏系统总结且内容需要更新等问题,本文首先分类评述了SUHI遥感监测所采用的热红外遥感数据源。其次将现有的SUHI监测指标分为土地覆盖类型驱动型、地表温度格局驱动型及两者复合驱动型3类来述评,详细介绍了它们的计算方法、应用案例及优缺点;并从日间变化、夜间变化及昼夜对比的变化3个方面述评了SUHI的年内时空变化规律;归纳了其年际变化规律。最后,依据现有研究结论中相互冲突或尚需深化的地方,指出几个潜在的关键问题或研究方向。
Progress in urban heat island monitoring by remote sensing [J].https://doi.org/10.18306/dlkxjz.2016.09.002 URL [本文引用: 1] 摘要
全球正经历快速、高强度的城市化,导致城市热岛加剧,并对城市、区域乃至全球许多的生态环境要素直接或间接地产生多方面的影响,与人类福祉密切相关。遥感具有宽覆盖、信息量大、重复观测周期短等优点,已成为地表城市热岛(Surface Urban Heat Island,SUHI)监测广泛采用的一种方法。针对前人相关研究对热红外数据源、监测指标及SUHI时空变化规律尚缺乏系统总结且内容需要更新等问题,本文首先分类评述了SUHI遥感监测所采用的热红外遥感数据源。其次将现有的SUHI监测指标分为土地覆盖类型驱动型、地表温度格局驱动型及两者复合驱动型3类来述评,详细介绍了它们的计算方法、应用案例及优缺点;并从日间变化、夜间变化及昼夜对比的变化3个方面述评了SUHI的年内时空变化规律;归纳了其年际变化规律。最后,依据现有研究结论中相互冲突或尚需深化的地方,指出几个潜在的关键问题或研究方向。
|
| [6] |
长江三角洲城市群人为热排放特征研究 [J].https://doi.org/10.3969/j.issn.1000-6923.2014.02.004 URL Magsci [本文引用: 1] 摘要
基于常规可获取的能源、交通、人口等统计资料,利用“自上而下”的能源清单法,研究了2010年长江三角洲(以下简称“长三角”)城市群地区各类人为热排放量及其时空分布特征.结果表明:该地区人为热排放总量为1.4′1019J/a,其中工业、交通、建筑、新陈代谢分别占75.1%、12.5%、9.9%和2.5%.上海、苏州、无锡、杭州和南京五个城市的人为热排放总量约占研究区域总量的71%.长三角城市群的人为热年平均排放通量为5.3W/m2,大部分地区介于5~30W/m2,城市高值区一般介于20~70W/m2,上海明显高于其他城市.为方便有关环境气候模式的输入,本文提供了人为热排放的网格化空间分布和简单的时间变化廓线.
Anthropogenic heat emissions in the Yangtze River Delta region [J].https://doi.org/10.3969/j.issn.1000-6923.2014.02.004 URL Magsci [本文引用: 1] 摘要
基于常规可获取的能源、交通、人口等统计资料,利用“自上而下”的能源清单法,研究了2010年长江三角洲(以下简称“长三角”)城市群地区各类人为热排放量及其时空分布特征.结果表明:该地区人为热排放总量为1.4′1019J/a,其中工业、交通、建筑、新陈代谢分别占75.1%、12.5%、9.9%和2.5%.上海、苏州、无锡、杭州和南京五个城市的人为热排放总量约占研究区域总量的71%.长三角城市群的人为热年平均排放通量为5.3W/m2,大部分地区介于5~30W/m2,城市高值区一般介于20~70W/m2,上海明显高于其他城市.为方便有关环境气候模式的输入,本文提供了人为热排放的网格化空间分布和简单的时间变化廓线.
|
| [7] |
城市化对珠江三角洲热岛效应影响的模拟 [J].https://doi.org/10.3969/j.issn.1001-5221.2011.02.012 URL Magsci [本文引用: 1] 摘要
利用新一代中尺度数值模式WRF以及其耦合的单层城市冠层模型(UCM),设计了3个模拟试验,以探讨下垫面改变以及引入人为热源对珠三角热岛效应的影响.结果表明:城市下垫面以及人为热排放均加强了该地区的城市热岛效应,而敏感性试验表明,下垫面的改变引起的城市地区增温幅度比引人人为热源的增温幅度相对要大.另外,珠三角城市区域为明显的感热通量大值中心和潜热通量小值中心,其表现出的总效果是使城市地区温度比其他地区要高,该地区的城市热岛效应主要是由感热通量决定的.
A simulation about the impact of urbanization on the urban heat island in the Pearl River Delta region [J].https://doi.org/10.3969/j.issn.1001-5221.2011.02.012 URL Magsci [本文引用: 1] 摘要
利用新一代中尺度数值模式WRF以及其耦合的单层城市冠层模型(UCM),设计了3个模拟试验,以探讨下垫面改变以及引入人为热源对珠三角热岛效应的影响.结果表明:城市下垫面以及人为热排放均加强了该地区的城市热岛效应,而敏感性试验表明,下垫面的改变引起的城市地区增温幅度比引人人为热源的增温幅度相对要大.另外,珠三角城市区域为明显的感热通量大值中心和潜热通量小值中心,其表现出的总效果是使城市地区温度比其他地区要高,该地区的城市热岛效应主要是由感热通量决定的.
|
| [8] |
WRF/UCM在广州高温天气及城市热岛模拟研究中的应用 [J].https://doi.org/10.3969/j.issn.1004-4965.2010.03.003 URL [本文引用: 1] 摘要
应用WRF及其耦合的城市冠层模式(UCM,Urban Canopy Model),对2004年6月底—7月初受副热带高压和台风外围气流影响下发生在广州地区的一次高温天气过程进行了数值模拟。考察了WRF/UCM对"城市热岛"及城市高温天气模拟的应用效果。三个不同设计的模拟试验表明,E-UCM试验(新土地利用资料,耦合UCM模式)比E-BPA试验(新土地利用资料,BPA方法)和E-NOU试验(旧土地利用资料,耦合UCM模式)更好地模拟出了城区2 m高度温度的演变,平均绝对误差最小。尤其在夜间,E-UCM试验成功地再现了夜间热岛的形成及分布。城区及郊区地表能量平衡差异的分析表明,日间城区高温与低反射率引起的短波辐射吸收增加有关,由于城区缺少水汽蒸发蒸腾冷却过程,大部分能量收入被分配为感热加热大气。夜间,地表能量收入来自土壤热通量的向上输送,收入能量除部分用于长波辐射之外,由于城区潜热通量小,其余部分仍主要以感热形式加热大气。夜间热岛的形成与感热加热的持续有关,有利于夜间高温的维持。
Application of WRF/UCM in the simulation of a heat wave event and urban heat island around Guangzhou City [J].https://doi.org/10.3969/j.issn.1004-4965.2010.03.003 URL [本文引用: 1] 摘要
应用WRF及其耦合的城市冠层模式(UCM,Urban Canopy Model),对2004年6月底—7月初受副热带高压和台风外围气流影响下发生在广州地区的一次高温天气过程进行了数值模拟。考察了WRF/UCM对"城市热岛"及城市高温天气模拟的应用效果。三个不同设计的模拟试验表明,E-UCM试验(新土地利用资料,耦合UCM模式)比E-BPA试验(新土地利用资料,BPA方法)和E-NOU试验(旧土地利用资料,耦合UCM模式)更好地模拟出了城区2 m高度温度的演变,平均绝对误差最小。尤其在夜间,E-UCM试验成功地再现了夜间热岛的形成及分布。城区及郊区地表能量平衡差异的分析表明,日间城区高温与低反射率引起的短波辐射吸收增加有关,由于城区缺少水汽蒸发蒸腾冷却过程,大部分能量收入被分配为感热加热大气。夜间,地表能量收入来自土壤热通量的向上输送,收入能量除部分用于长波辐射之外,由于城区潜热通量小,其余部分仍主要以感热形式加热大气。夜间热岛的形成与感热加热的持续有关,有利于夜间高温的维持。
|
| [9] |
全球变化科学中的碳循环研究进展与趋向 [J].https://doi.org/10.3321/j.issn:1001-8166.2003.06.021 URL Magsci [本文引用: 1] 摘要
<p>全球碳循环研究是全球变化科学中的研究重点之一,在过去的研究中已取得了长足的发展,但对碳源和汇的定量研究还是今后需要进一步加强的工作。综述了近年来全球碳库储量研究的主要进展,分析了岩石圈、陆地生态系统、海洋、大气以及人类社会等碳库的储量、在全球碳循环中的地位及其作用机制,针对与全球升温事件密切相关的人为碳排放问题专门作了论述,并结合最新的研究成果,对"未知汇"问题的新的研究方向作了阐述。碳循环研究已经进入一个新的发展时期,国际科学组织与各国政府对碳循环研究的关注与投入正逐步增加,但其关注的内容并不一致。分别以地球系统科学联盟的全球碳计划和美国的北美碳计划为例,介绍了国际碳循环研究的重点与趋势。最后提出了今后全球碳循环研究需要关注的一些领域:陆地碳循环机理与源汇定量研究;海洋大尺度碳循环及其机理研究;人类社会在碳循环中的作用研究等。</p>
Trends and advances of the global change studies on carbon cycle [J].https://doi.org/10.3321/j.issn:1001-8166.2003.06.021 URL Magsci [本文引用: 1] 摘要
<p>全球碳循环研究是全球变化科学中的研究重点之一,在过去的研究中已取得了长足的发展,但对碳源和汇的定量研究还是今后需要进一步加强的工作。综述了近年来全球碳库储量研究的主要进展,分析了岩石圈、陆地生态系统、海洋、大气以及人类社会等碳库的储量、在全球碳循环中的地位及其作用机制,针对与全球升温事件密切相关的人为碳排放问题专门作了论述,并结合最新的研究成果,对"未知汇"问题的新的研究方向作了阐述。碳循环研究已经进入一个新的发展时期,国际科学组织与各国政府对碳循环研究的关注与投入正逐步增加,但其关注的内容并不一致。分别以地球系统科学联盟的全球碳计划和美国的北美碳计划为例,介绍了国际碳循环研究的重点与趋势。最后提出了今后全球碳循环研究需要关注的一些领域:陆地碳循环机理与源汇定量研究;海洋大尺度碳循环及其机理研究;人类社会在碳循环中的作用研究等。</p>
|
| [10] |
城市化过程中下垫面改变对大气环境的影响 [J].
城市化发展,特别是下垫面特征的改变,对大气环境的外强迫是当前大气环境领域研究的热点问题。下垫面特征变化导致不同尺度气象场发生变化,而气象条件又决定着大气污染物的迁移转化。为了深入探讨这个问题,文章首先从3个方面总结了相关研究:1)城市气候的基本特征及其形成的内在机制;2)不同尺度下的城市污染气象学特征;3)定量描述城市下垫面地-气作用模式的相关进展。之后进一步综述了利用数值模式方法模拟城市化过程中下垫面变迁对大气环境(包括气象条件及空气质量)影响方面的研究进展。最后利用中尺度大气模式WRF/Chem和过程分析方法研究了中国东部地区城市下垫面扩张对臭氧(O3)和一氧化碳(CO)空间分布的影响。模拟结果显示:在人为源排放不变的情况下,城市下垫面扩张使得近地面和1~3 km高处的O3,以及距地面1~2 km高处的CO体积分数增大;但近地CO体积分数下降。
Effects of urban underlying surface change on ambient atmospheric environment [J].
城市化发展,特别是下垫面特征的改变,对大气环境的外强迫是当前大气环境领域研究的热点问题。下垫面特征变化导致不同尺度气象场发生变化,而气象条件又决定着大气污染物的迁移转化。为了深入探讨这个问题,文章首先从3个方面总结了相关研究:1)城市气候的基本特征及其形成的内在机制;2)不同尺度下的城市污染气象学特征;3)定量描述城市下垫面地-气作用模式的相关进展。之后进一步综述了利用数值模式方法模拟城市化过程中下垫面变迁对大气环境(包括气象条件及空气质量)影响方面的研究进展。最后利用中尺度大气模式WRF/Chem和过程分析方法研究了中国东部地区城市下垫面扩张对臭氧(O3)和一氧化碳(CO)空间分布的影响。模拟结果显示:在人为源排放不变的情况下,城市下垫面扩张使得近地面和1~3 km高处的O3,以及距地面1~2 km高处的CO体积分数增大;但近地CO体积分数下降。
|
| [11] |
城市化及人为热对西安市气象要素影响差异敏感性分析 [J].https://doi.org/10.11755/j.issn.1006-7639(2015)-03-0434 URL [本文引用: 1] 摘要
利用西安市工业和生活能源消耗量、汽车保有量、主干道车流量等数 据,对工业、交通和生活3种人为热排放量进行综合估算,利用耦合到WRF模式中的单层城市冠层模式(WRF/UCM),采用修订的西安人为热日逐时变化参 数,对城市化及人为热的影响进行敏感性分析.结果表明:(1)采取修订后的人为热源参数,耦合城市冠层的模式系统更能详细刻画出降水分布的局地性差异,人 为热源对城市温度分布及强度的模拟效果有一定的改进作用,对城市地面流场、降水分布及强度有一定的影响,模拟结果更接近实况;(2)城市冠层对长波辐射有 一定的截获作用,在增加人为热源的影响下,城市地表吸收的长波辐射增多更为明显,加强了地表对边界层大气向上的感热输送;(3)人为热源对增加边界层高度 的作用较为明显,平均在50~ 100 m;耦合城市冠层和人为热源后,在城市下风方向,垂直速度增大,局地垂直环流逐渐加强,对流系统水平尺度更小;在城市下垫面和人为热源共同影响下,大气的 垂直结构发生了变化,从而造成城区不同部位降水强度的差异.
Sensitivity test of impact of urbanization and anthropogenic heat on meteorological elements in Xi'an [J].https://doi.org/10.11755/j.issn.1006-7639(2015)-03-0434 URL [本文引用: 1] 摘要
利用西安市工业和生活能源消耗量、汽车保有量、主干道车流量等数 据,对工业、交通和生活3种人为热排放量进行综合估算,利用耦合到WRF模式中的单层城市冠层模式(WRF/UCM),采用修订的西安人为热日逐时变化参 数,对城市化及人为热的影响进行敏感性分析.结果表明:(1)采取修订后的人为热源参数,耦合城市冠层的模式系统更能详细刻画出降水分布的局地性差异,人 为热源对城市温度分布及强度的模拟效果有一定的改进作用,对城市地面流场、降水分布及强度有一定的影响,模拟结果更接近实况;(2)城市冠层对长波辐射有 一定的截获作用,在增加人为热源的影响下,城市地表吸收的长波辐射增多更为明显,加强了地表对边界层大气向上的感热输送;(3)人为热源对增加边界层高度 的作用较为明显,平均在50~ 100 m;耦合城市冠层和人为热源后,在城市下风方向,垂直速度增大,局地垂直环流逐渐加强,对流系统水平尺度更小;在城市下垫面和人为热源共同影响下,大气的 垂直结构发生了变化,从而造成城区不同部位降水强度的差异.
|
| [12] |
地理探测器: 原理与展望 [J].Geodetector: Principle and prospective [J]. |
| [13] |
广州人为热初步估算及敏感性分析 [J].https://doi.org/10.3969/j.issn.1009-0827.2011.04.009 URL [本文引用: 1] 摘要
考虑了工业、交通和生活三种人为热排放源,利用广州市工业和生活能源消耗量、汽车保有量、主干道车流量等数据,估算出广州人为热日变化排放通量,全天平均排放通量41.1 W·m-2,最大排放通量出现在11时,为72.3 W·m-2,其中工业排放占总排放量68.6%.利用耦合到WRF中的单层城市冠层模式(WRF/UCM),对人为热作用进行敏感性试验,包括无人为热、无日变化人为热、有日变化人为热、人为热排放通量翻倍四种方案.结果显示,方案之间冠层感热通量的差异与人为热设置的差异大致相等.试验方案之间冠层内气温差异较小,单倍人为热与双倍人为热的最大差值约只有0.2℃.另外,人为热使湍流得到发展,双倍人为热比单倍人为热湍流动能增加约0.1 ~0.4 m2·s-2.且人为热对白天城市边界层湍涡有增强作用,添加单倍人为热后使气流垂直速度最大增加可达0.1 m·s-1,使垂直混合加强.有日变化的人为热对热岛强度的贡献在中午时最大,单倍人为热的平均贡献率15.9%,双倍人为热为22.8%;而无日变化的人为热在凌晨时贡献最大,平均贡献率14.9%.
Estimation and sensitivity test of anthropogenic heat flux in Guangzhou [J].https://doi.org/10.3969/j.issn.1009-0827.2011.04.009 URL [本文引用: 1] 摘要
考虑了工业、交通和生活三种人为热排放源,利用广州市工业和生活能源消耗量、汽车保有量、主干道车流量等数据,估算出广州人为热日变化排放通量,全天平均排放通量41.1 W·m-2,最大排放通量出现在11时,为72.3 W·m-2,其中工业排放占总排放量68.6%.利用耦合到WRF中的单层城市冠层模式(WRF/UCM),对人为热作用进行敏感性试验,包括无人为热、无日变化人为热、有日变化人为热、人为热排放通量翻倍四种方案.结果显示,方案之间冠层感热通量的差异与人为热设置的差异大致相等.试验方案之间冠层内气温差异较小,单倍人为热与双倍人为热的最大差值约只有0.2℃.另外,人为热使湍流得到发展,双倍人为热比单倍人为热湍流动能增加约0.1 ~0.4 m2·s-2.且人为热对白天城市边界层湍涡有增强作用,添加单倍人为热后使气流垂直速度最大增加可达0.1 m·s-1,使垂直混合加强.有日变化的人为热对热岛强度的贡献在中午时最大,单倍人为热的平均贡献率15.9%,双倍人为热为22.8%;而无日变化的人为热在凌晨时贡献最大,平均贡献率14.9%.
|
| [14] |
城市化对长江三角洲地区夏季降水、气温的影响 [J].The impact of urbanization on summer precipitation and temperature in the Yangtze River Delta [J]. |
| [15] |
城市人为热排放分类研究及其对气温的影响 [J].
<p>随着城市化进程日益加速,城市热岛现象愈发严重。利用上海市近50 a各区县月均温数据,统计分析了各区与崇明夏季每5 a均温差,发现热岛效应由市区中心向郊区延伸,范围越来越大,特别是20世纪80年代开始温差呈较大幅增加,城市热岛现象显著;在前人工作的基础上,分析热岛产生机制中的主要原因之一:城市中人为热排。绘制人为热排放流程图,并将城市人为热源进行分类,分析所有可能成为人为热排放源的设施以便定性及控制研究;对供给,消费和排出3种阶段的计算方法进行对比归纳,根据目的不同分别使用;分别计算燃油排热和燃煤排热以估算上海市人为热排放总量,统计上海市区和郊区的年均温及年均温差随时间变化及其与人为热排放之间的关系,发现两者之间有很好的相关性;最后就上海市夏季空调使用排热对上海市温度影响进行了定性研究,数字化上海市航片得到上海市建筑物分布图,假设楼层和空调密度之间存在相关性,发现空调排热与地面温度反演有着非常良好的一致性,同时也是造成上海城市高温的主要因素之一</p>
Urban anthropogenic heat release categoriziing and its effects on urban temperature [J].
<p>随着城市化进程日益加速,城市热岛现象愈发严重。利用上海市近50 a各区县月均温数据,统计分析了各区与崇明夏季每5 a均温差,发现热岛效应由市区中心向郊区延伸,范围越来越大,特别是20世纪80年代开始温差呈较大幅增加,城市热岛现象显著;在前人工作的基础上,分析热岛产生机制中的主要原因之一:城市中人为热排。绘制人为热排放流程图,并将城市人为热源进行分类,分析所有可能成为人为热排放源的设施以便定性及控制研究;对供给,消费和排出3种阶段的计算方法进行对比归纳,根据目的不同分别使用;分别计算燃油排热和燃煤排热以估算上海市人为热排放总量,统计上海市区和郊区的年均温及年均温差随时间变化及其与人为热排放之间的关系,发现两者之间有很好的相关性;最后就上海市夏季空调使用排热对上海市温度影响进行了定性研究,数字化上海市航片得到上海市建筑物分布图,假设楼层和空调密度之间存在相关性,发现空调排热与地面温度反演有着非常良好的一致性,同时也是造成上海城市高温的主要因素之一</p>
|
| [16] |
建筑物制冷系统人为热排放与气象环境的相互作用 [J].https://doi.org/10.7522/j.issn.1000-0534.2016.00005 URL [本文引用: 1] 摘要
针对建筑物制冷系统人为热排放对城市气候和能源消耗影响越来越大的现状,利用改进后的建筑物能量模式BEM(Building Energy Model)与单层城市冠层模式SLUCM(Single Layer Urban Canopy Model)的耦合,实现对城市建筑物人为热排放的动态模拟;以2014年5月29日为例(北京地区极端高温个例),开展北京地区建筑物制冷系统人为热排放与城市气象环境相互作用的定量分析。WRF(Weather Research and Forecasting)/Noah/SLUCM/BEM耦合模式模拟分析表明,模式在不加入人为热时,对夜间的热岛模拟偏弱,且基本无法模拟出白天的热岛效应;加入城市交通人为热排放后,对城市热岛强度和范围的模拟有一定改善;进一步加入建筑人为热排放对气温、热通量、边界层高度等的模拟效果均有不同程度的改进。加入BEM模拟的人为热后(case2),15:00(北京时,下同)主城区地表感热通量增加30~50 W·m~(-2),相应地2 m气温升高0.4~0.8℃,二者对应关系较好。case2中的人为潜热排放导致地表潜热通量增加80~140 W·m~(-2),水汽通量增加0.04~0.09 g·m~(-2)·s-1,中心城区2 m比湿增加0.5~0.9 g·kg~(-1),边界层高度升高100~150 m,且傍晚边界层高度开始下降的时间推迟了约1 h。加入建筑人为热后,气温等气象条件的变化会对建筑物制冷系统能耗及人为热排放产生影响。case2对比case1,建筑物制冷系统能耗增加了1.11%~3.33%,建筑物制冷系统排放的感热通量增大0.67%~1.67%、潜热通量增大0.625%~1.56%(达2.0 W·m~(-2)以上)。研究表明,在中尺度模式中动态模拟建筑物制冷系统的人为热排放,能够改进对近地层气象要素的模拟效果。
Interaction of anthropogenic heat emission from building cooling system and meteorological environment [J].https://doi.org/10.7522/j.issn.1000-0534.2016.00005 URL [本文引用: 1] 摘要
针对建筑物制冷系统人为热排放对城市气候和能源消耗影响越来越大的现状,利用改进后的建筑物能量模式BEM(Building Energy Model)与单层城市冠层模式SLUCM(Single Layer Urban Canopy Model)的耦合,实现对城市建筑物人为热排放的动态模拟;以2014年5月29日为例(北京地区极端高温个例),开展北京地区建筑物制冷系统人为热排放与城市气象环境相互作用的定量分析。WRF(Weather Research and Forecasting)/Noah/SLUCM/BEM耦合模式模拟分析表明,模式在不加入人为热时,对夜间的热岛模拟偏弱,且基本无法模拟出白天的热岛效应;加入城市交通人为热排放后,对城市热岛强度和范围的模拟有一定改善;进一步加入建筑人为热排放对气温、热通量、边界层高度等的模拟效果均有不同程度的改进。加入BEM模拟的人为热后(case2),15:00(北京时,下同)主城区地表感热通量增加30~50 W·m~(-2),相应地2 m气温升高0.4~0.8℃,二者对应关系较好。case2中的人为潜热排放导致地表潜热通量增加80~140 W·m~(-2),水汽通量增加0.04~0.09 g·m~(-2)·s-1,中心城区2 m比湿增加0.5~0.9 g·kg~(-1),边界层高度升高100~150 m,且傍晚边界层高度开始下降的时间推迟了约1 h。加入建筑人为热后,气温等气象条件的变化会对建筑物制冷系统能耗及人为热排放产生影响。case2对比case1,建筑物制冷系统能耗增加了1.11%~3.33%,建筑物制冷系统排放的感热通量增大0.67%~1.67%、潜热通量增大0.625%~1.56%(达2.0 W·m~(-2)以上)。研究表明,在中尺度模式中动态模拟建筑物制冷系统的人为热排放,能够改进对近地层气象要素的模拟效果。
|
| [17] |
Impacts of anthropogenic heat on regional climate patterns [J].https://doi.org/10.1029/2004GL019852 URL [本文引用: 1] 摘要
Four different simulations of a winter period in Central Europe are carried out to investigate the principle effect of anthropogenic heat release from the highly industrialized and populated Ruhrarea region (Germany) on regional climate conditions. The results reveal a permanent warming due to anthropogenic heat emissions over affected areas ranging from 0.15 K over land area with an additional 2 W manthropogenic heat flux up to 0.5 K over the Ruhrarea with additional 20 W manthropogenic heat flux. The temperature effects induced by anthropogenic heat not only depend on the amount of added heat but also on orographical factors. No significant variations are found for precipitation.
|
| [18] |
Numerical simulation of the anthropogenic heat effect on urban boundary layer structure [J].https://doi.org/10.1007/s00704-008-0054-0 URL [本文引用: 1] 摘要
In this paper, several methods of incorporating anthropogenic heat release into the boundary layer are compared. The best scheme was one that included anthropogenic heat release in both the surface energy balance equation and the thermodynamic equations. In addition, it included diurnal variations and a distribution of heat based on building concentrations. We further investigated the influence of anthropogenic heat release on urban boundary layer structure and the urban heat island, and found that the contribution of anthropogenic heat release to the urban heat island is greatest in the evening and at night, and least at noon. The daily average contribution ratio of anthropogenic heat to urban heat island intensity in the winter is 54.5%, compared with just 43.6% in the summer. Anthropogenic heat strengthens the vertical movement of urban surface air flow, changing the urban heat island circulation. It also makes the urban boundary layer more turbulent and unstable, especially in the morning and evening. The degree of influence of anthropogenic heat release on local boundary layer structure depends on its importance to the surface energy budget.
|
| [19] |
Thermal comfort in forested urban canyons of low building density: An assessment for the city of Mendoza, Argentina [J].https://doi.org/10.1016/j.buildenv.2012.06.007 URL [本文引用: 1] 摘要
This research has established the degree of comfort achieved in road channels of Mendoza Metropolitan Area (AMM), in Argentina. They present different widths (16 m, 20 m and 30 m) with low building density and they are forested with First (Platanus acerifolia) and Second (Morus alba and Fraxinus excelsior) Magnitude species. The methodology is based on the selection of cases, the experimental observation and the assessment of thermal comfort condition by applying the COMFA method. The energy budget evaluation shows that the road channels forested with Platanus acerifolia -whose green structure is characterized for continuous tunnel over street and sidewalk-, has the best behavior. Nevertheless taking into account the urban problems of the city under study, it is necessary to settle the comfort conditions with the possibility of nocturnal cooling. During the daytime the solar radiation control is a key to getting comfort conditions. During the nighttime, sky vision is needed for radiative cooling. In addition, the forest structure combined with the urban morphology increase soil roughness and reduces the convective cooling. Therefore it is necessary to encourage those combinations of forest structure and urban morphologies that benefit both processes in order to reduce the urban heat island.
|
| [20] |
Modeling the impacts of anthropogenic heating on the urban climate of Philadelphia: A comparison of implementations in two pbl schemes [J].https://doi.org/10.1016/j.atmosenv.2004.09.031 URL [本文引用: 1] 摘要
Waste heat released from human activities (anthropogenic heating) can be a significant contributor to the urban energy balance, and can thus play an important role in affecting the urban thermal environment, ambient air quality, and other attributes of the urban climate system. To quantify the impacts of anthropogenic heating we have incorporated it as a source term in the near-surface energy balance within the MM5 mesoscale atmospheric model. This energy balance is calculated as part of the planetary boundary layer (PBL) module within the MM5. Because of the multiple PBL scheme options available within the MM5 and other atmospheric modeling systems we have enabled anthropogenic heating within two commonly used PBL modules—Blackadar (BL) and Gayno–Seaman (GS). Results from a case study series of simulations for Philadelphia suggest that anthropogenic heating plays an important role in the formation of the urban heat island, particularly during the night and winter. Control simulations (without anthropogenic heating) consistently underestimated urban air temperatures and the observed urban heat island effect. Simulations for winter suggest that anthropogenic heating contributes 2–302°C to the nighttime heat island. In addition, anthropogenic heating is also found to have impacts on the nocturnal PBL stability and PBL structure during the morning transition. The choice of PBL scheme affects the magnitude of these modeled impacts. In winter, for example, the addition of anthropogenic heating in the BL scheme resulted in a 302°C temperature increase at night compared with about a 202°C temperature increase in the corresponding GS simulation.
|
| [21] |
Simulating the regional impacts of urbanization and anthropogenic heat release on climate across China [J].https://doi.org/10.1175/JCLI-D-11-00333.1 URL [本文引用: 1] 摘要
Together with economic development and accelerated urbanization, the urban population in China has been increasing rapidly, and anthropogenic heat released by large-scale energy consumption in cities is expected to be a vital factor affecting the climate. In this paper, the Weather Research and Forecasting (WRF) model coupled with the Urban Canopy Model (UCM) is employed to simulate the regional impacts on climate under the two scenarios: the underlying surface changes due to urbanization (USCU) and anthropogenic heat release (AHR). Three experiments were performed from December 2006 to December 2008. With respect to the USCU, the surface albedo and the available surface soil water decrease markedly. With the inclusion of AHR, the two scenarios give rise to increased surface temperatures over most areas of China. Especially in the urban agglomeration area of the Yangtze River delta, the combination of USCU and AHR could result in an increase of 2 C in the surface air temperature. The influence of AHR on surface air temperature in winter is greater than the influence of USCU without considering any extra sources of heat, but the opposite is found in summer. The combination of USCU and AHR leads to changes in the surface energy budget. They both increase sensible heat flux, but USCU decreases latent heat flux significantly, and AHR increases latent heat flux slightly. Nevertheless, under the influence of these two scenarios, the precipitation increases in some areas, especially in the Beijing-Tianjin-Hebei region, while it decreases in other areas, most notably the Yangtze River delta.
|
| [22] |
Lowering the outdoor temperature in high-rise high-density residential developments of coastal Hong Kong: The vegetation influence [J].https://doi.org/10.1016/j.buildenv.2007.10.003 URL [本文引用: 1] 摘要
This paper investigates the impact of on-site variables on the influence of vegetation in lowering outdoor temperature. The study uses six critical on-site variables such as surface albedo, sky view factor, altitude, shrub cover, tree cover and average height to floor area ratio to carry out analysis in five data sets. The climatic parameters and physical characteristics were measured and surveyed, respectively in 216 stations in high-rise high-density residential developments of coastal Hong Kong. The data set is mainly categorised into peak summer clear sky days (PSCS-days), peak summer partially cloudy days (PSPC-days) and late summer days to address the issues related to cloudy sky conditions in Hong Kong. The trend analysis shows that at a lower sky view factor, ranging from 0.1 to 0.25, shrub cover as low as 10 15% in a 1000 m 2 open area is more effective in reducing outdoor temperature than the same level of tree cover in a location with a higher sky view factor (0.4 or above). The regression models used in this study were able to explain the influence of on-site variables on vegetation in lowering the outdoor temperature within the respective urban settings. In high-rise high-density environments, on-site variables such as sky view factor and altitude have a substantial impact on the influence of vegetation in lowering outdoor temperature. However, off-site variables such as high urban density and anthropogenic heat could negate the behaviour of sky view factor and altitude. The study suggests that increasing the tree cover from 25% to 40% in the pocket parks in coastal area residential developments of Hong Kong could reduce daytime urban heat island intensity (UHI) by further 0.5 C.
|
| [23] |
Impacts of urban biophysical composition on land surface temperature in urban heat island clusters [J].https://doi.org/10.1016/j.landurbplan.2014.11.007 URL [本文引用: 1] 摘要
The spatio-temporal pattern of biophysical composition significantly affects land surface temperature (LST). Previous studies, however, mostly characterized urban heat island (UHI) clusters being spatially homogeneous. The landscape spatial heterogeneity in urban across UHI clusters challenges us to more accurately characterize the relationships between LST and corresponding urban biophysical composition. In this study, we introduced an innovative integrated approach that combined object-oriented image segmentation with local indicators of spatial autocorrelations (LISA) to extract UHI clusters from an LST image. We used a regression tree model to examine the nonlinear relationships between LST and each of three satellite-based indices within the UHI clusters: normalized differential vegetation index (NDVI), normalized differential build-up index (NDBI), and normalized difference bareness index (NDBaI). We found that both NDVI and NDBI are strongly correlated with the variations of LST whereas NDBaI has a weaker correlation with LST. We also found that the regression tree model built in this study enabled us to effectively detect the nonlinear relationship between LST and biophysical composition. Furthermore, based on a set of rules derived from a regression tree analysis, we found that urban landscapes strongly affect LST and its spatial heterogeneity within a UHI. These rules were used to detect the nonlinear impacts of complex urban biophysical composition on LST. The results of this study provided insights into how LST within UHI varies with urban surface characteristics at fine spatial scale and also a new method for investigating effects of land surface composition on LST in urbanized areas.
|
| [24] |
Attribution of mortality to the urban heat island during heatwaves in the West Midlands, UK [J].https://doi.org/10.1186/s12940-016-0100-9 URL PMID: 26961286 [本文引用: 1] 摘要
Abstract BACKGROUND: The Urban Heat Island (UHI) effect describes the phenomenon whereby cities are generally warmer than surrounding rural areas. Traditionally, temperature monitoring sites are placed outside of city centres, which means that point measurements do not always reflect the true air temperature of urban centres, and estimates of health impacts based on such data may under-estimate the impact of heat on public health. Climate change is likely to exacerbate heatwaves in future, but because climate projections do not usually include the UHI, health impacts may be further underestimated. These factors motivate a two-dimensional analysis of population weighted temperature across an urban area, for heat related health impact assessments, since populations are typically densest in urban centres, where ambient temperatures are highest and the UHI is most pronounced. We investigate the sensitivity of health impact estimates to the use of population weighting and the inclusion of urban temperatures in exposure data. METHODS: We quantify the attribution of the UHI to heat related mortality in the West Midlands during the heatwave of August 2003 by comparing health impacts based on two modelled temperature simulations. The first simulation is based on detailed urban land use information and captures the extent of the UHI, whereas in the second simulation, urban land surfaces have been replaced by rural types. RESULTS AND CONCLUSIONS: The results suggest that the UHI contributed around 50 % of the total heat-related mortality during the 2003 heatwave in the West Midlands. We also find that taking a geographical, rather than population-weighted, mean of temperature across the regions under-estimates the population exposure to temperatures by around 1 C, roughly equivalent to a 20 % underestimation in mortality. We compare the mortality contribution of the UHI to impacts expected from a range of projected temperatures based on the UKCP09 Climate Projections. For a medium emissions scenario, a typical heatwave in 2080 could be responsible for an increase in mortality of around 3 times the rate in 2003 (278 vs. 90 deaths) when including changes in population, population weighting and the UHI effect in the West Midlands, and assuming no change in population adaptation to heat in future.
|
| [25] |
The urban heat island in winter at Barrow, Alaska [J].https://doi.org/10.1002/joc.971 URL [本文引用: 1] 摘要
The village of Barrow, Alaska, is the northernmost settlement in the USA and the largest native community in the Arctic. The population has grown from about 300 residents in 1900 to more than 4600 in 2000. In recent decades, a general increase of mean annual and mean winter air temperature has been recorded near the centre of the village, and a concurrent trend of progressively earlier snowmelt in the village has been documented. Satellite observations and data from a nearby climate observatory indicate a corresponding but much weaker snowmelt trend in the surrounding regions of relatively undisturbed tundra. Because the region is underlain by ice-rich permafrost, there is concern that early snowmelt will increase the thickness of the thawed layer in summer and threaten the structural stability of roads, buildings, and pipelines. Here, we demonstrate the existence of a strong urban heat island (UHI) during winter. Data loggers (54) were installed in the 65150 km2 study area to monitor hourly air and soil temperature, and daily spatial averages were calculated using the six or seven warmest and coldest sites. During winter (December 2001–March 2002), the urban area averaged 2.2 °C warmer than the hinterland. The strength of the UHI increased as the wind velocity decreased, reaching an average value of 3.2 °C under calm (s611) conditions and maximum single-day magnitude of 6 °C. UHI magnitude generally increased with decreasing air temperature in winter, reflecting the input of anthropogenic heat to maintain interior building temperatures. On a daily basis, the UHI reached its peak intensity in the late evening and early morning. There was a strong positive relation between monthly UHI magnitude and natural gas production/use. Integrated over the period September–May, there was a 9% reduction in accumulated freezing degree days in the urban area. The evidence suggests that urbanization has contributed to early snowmelt in the village.
|
| [26] |
Measurement of the thermal environment in temporary settlements with high building density after 2008 Wenchuan earthquake in China [J].https://doi.org/10.1016/j.proeng.2015.08.1027 URL [本文引用: 1] 摘要
After 2008 Wenchuan earthquake in China, a large amount of temporary settlements with high building density had appeared in the earthquake-stricken area. These temporary settlements all consisted of low-energy temporary buildings: prefab houses. In order to make clear the indoor and outdoor physical environments in the settlements, we measured the relevantly important parameters such as wind velocity, air temperature in Happy Homeland, a typical post-disaster temporary settlement. The field measurements results showed as followed: (1) the indoor thermal environment of the prefab houses in summer was always worse than that in winter, (2) the wind velocity inside settlement was much lower than that outside, and indoor ventilation was very poor, (3) a micro-scale heat island effect further deteriorated both the summer outdoor and indoor thermal environment.
|
| [27] |
|
| [28] |
Analysis of urban heat-island effect using ASTER and ETM+ data: Separation of anthropogenic heat discharge and natural heat radiation from sensible heat flux [J].https://doi.org/10.1016/j.rse.2005.04.026 URL [本文引用: 1] 摘要
The urban heat-island effect occurs as a result of increased sensible heat flux from the land surface to the atmosphere near cities. Sensible heat flux consists of two components: exhausted anthropogenic heat, and heat radiation due to solar input. The latter may be enhanced by changes in the usage of artificial land surface. The authors have developed a new method to separate the anthropogenically discharged heat and natural heat radiation from the sensible heat flux, based on a heat-balance model using satellite remote sensing and ground meteorological data. This method was applied to ASTER and ETM+ data for the daytime during spring, summer and winter and for the nighttime during autumn in Nagoya, Japan. The increased sensible heat flux was approximately 100 W/m 2 in the central part of the city during the summer. Sensible heat flux at night during autumn was approximately 0 W/m 2, except in urban areas and over bodies of water. During the winter, anthropogenic heat accounted for almost all of the sensible heat flux in urban areas. The contribution of anthropogenic heat to sensible heat flux in spring was lower than the contributions in summer and winter. The anthropogenic heat flux was high in industrial areas throughout the year. These results are consistent with the fact that anthropogenic energy consumption is high in summer and winter and low in spring and autumn.
|
| [29] |
The effects of land-use and anthropogenic heating on the surface temperature in the Tokyo metropolitan area: A numerical experiment [J].https://doi.org/10.1016/0957-1272(91)90050-O URL [本文引用: 1] 摘要
The diurnal variation of the simulated surface air temperature agrees well with the observed value; an average over 36 days which represent typical summer days; i.e. negligible gradient winds and almost clear skies. The model shows that the contribution of anthropogenic heat is much larger at night, in spite of the lower energy consumption as compared to daytime use. Due to the scarcity of green vegetated areas in the central part of the city, the surface air temperature is enhanced in this region during daytime, however this enhancement is small after midnight.
|
| [30] |
Estimation of anthropogenic heat emissions in urban Taiwan and their spatial patterns [J].https://doi.org/10.1016/j.envpol.2016.04.055 URL PMID: 27179327 [本文引用: 1] 摘要
61The results obtained evidence the impact of spatial distribution of land use types, particularly industries, main highways, population densities on anthropogenic heat fluxes (AHFs) generation in Taiwan.61Findings of this study will also fill the information gap with respect to anthropogenic heat emissions in urban Taiwan and their spatial distribution, in particular emissions related to vehicles and industries.
|
| [31] |
Numerical simulation of urban heat island effect by the WRF model with 4-km grid increment: An inter-comparison study between the urban canopy model and slab model [J].https://doi.org/10.2151/jmsj.2012-B03 URL [本文引用: 1] 摘要
Abstract The present study applies the WRF model involving the single-layer urban canopy model (hereafter, WRF_UCM) to urban climate simulation of the Tokyo metropolitan area for August (2004-2007) and compare results to (a) observations, and (b) the WRF model involving the slab urban model (hereafter, WRF_SLAB). In this urban area, WRF_UCM accurately captures the observed monthly mean daytime and nocturnal UHI, whereas WRF_SLAB does not show a nocturnal UHI. Moreover, the observed diurnal variations of the surface air temperature for central Tokyo and Kumagaya, a nearby inland city, are reproduced well by WRF_UCM. However, WRF_SLAB exhibits both a 1-hr phase shift and a 6.2 C excess oscillation magnitude over observations. In addition, WRF_UCM accurately reproduces the frequency distribution of surface air temperatures, showing a maximum at 27 C, whereas WRF_SLAB produce a bimodal distribution, with double peaks at 23 and 33 C. Finally, WRF_UCM does a much better job than WRF_SLAB at modeling the relative humidity.
|
| [32] |
A regression approach for estimation of anthropogenic heat flux based on a bottom-up air pollutant emission database [J].https://doi.org/10.1016/j.atmosenv.2014.07.009 URL [本文引用: 1] 摘要
A statistical regression method is presented for estimating hourly anthropogenic heat flux (AHF) using an anthropogenic pollutant emission inventory for use in mesoscale meteorological and air-quality modeling. Based on bottom-up AHF estimated from detailed energy consumption data and anthropogenic pollutant emissions of carbon monoxide (CO) and nitrogen oxides (NO x ) in the US National Emission Inventory year 2005 (NEI-2005), a robust regression relation between the AHF and the pollutant emissions is obtained for Houston. This relation is a combination of two power functions ( Y = aX b ) relating CO and NO x emissions to AHF, giving a determinant coefficient ( R 2 ) of 0.72. The AHF for Houston derived from the regression relation has high temporal ( R =0.91) and spatial ( R =0.83) correlations with the bottom-up AHF. Hourly AHF for the whole US in summer is estimated by applying the regression relation to the NEI-2005 summer pollutant emissions with a high spatial resolution of 4-km. The summer daily mean AHF range 10–40Wm 612 on a 4×4km 2 grid scale with maximum heat fluxes of 50–140Wm 612 for major US cities. The AHFs derived from the regression relations between the bottom-up AHF and either CO or NO x emissions show a small difference of less than 5% (4.7Wm 612 ) in city-scale daily mean AHF, and similar R 2 statistics, compared to results from their combination. Thus, emissions of either species can be used to estimate AHF in the US cities. An hourly AHF inventory at 4×4km 2 resolution over the entire US based on the combined regression is derived and made publicly available for use in mesoscale numerical modeling.
|
| [33] |
Estimation of anthropogenic heat emission in the Gyeong-In region of Korea [J].https://doi.org/10.1007/s00704-008-0040-6 URL [本文引用: 2] 摘要
The anthropogenic heat emission in the Gyeong-In region of Korea in 2002 is estimated based on the energy consumption statistics data. The energy consumption over the region is categorized into four energy sectors: electricity use, transportation, point sources, and area sources. The estimated annual mean anthropogenic heat emissions in Seoul, Incheon, and Gyeonggi are found to be 55, 53, and 2802W m 612 , respectively. A major contributing energy sector to anthropogenic heat emission in the Gyeong-In region is area sources including the residential, commercial, and small industrial sectors, which account for 40% of the total heat emission from the three administrative districts, and transportation and electricity use follow. The distributions of the annual, monthly, and hourly mean anthropogenic heat emission for all energy sectors are presented in the 0.01° longitude × 0.01° latitude grid domain. The presently estimated anthropogenic heat emission data can be used in mesoscale meteorological and environmental modeling in the Gyeong-In region.
|
| [34] |
Urbanization impact on temperature change in China with emphasis on land cover change and human activity [J].https://doi.org/10.1175/JCLI-D-12-00698.1 URL [本文引用: 1] 摘要
The impact of urbanization on temperature trends in China was investigated with emphasis on two aspects of urbanization, land cover change, and human activity. A new station classification scheme was developed to incorporate these two aspects by utilizing land cover and energy consumption data. Observation temperature data of 274 stations and National Centers for Environmental Prediction (NCEP)-National Center for Atmospheric Research (NCAR) reanalysis temperature from 1979 to 2010 were used in conducting the observation minus reanalysis (OMR) method to detect urban influence. Results indicated that nearly half of the stations in the study area have been converted from nonurban to urban stations as a result of land cover change associated with urban expansion. It was determined that both land cover change and human activity play important roles in temperature change and contribute to the observed warming, particularly in urbanized stations, where the highest amount of warming was detected. Urbanized stations showed higher OMR temperature trends than those of unchanged stations. In addition, a statistically significant positive relationship was detected between human activity and temperature trends, which suggests that the observed warming is closely related to the intensity and spatial extent of human activity. In fact, the urbanization effect is strongly affected by specific characteristics of urbanization in local and regional scales.
|
| [35] |
Effects of anthropogenic heat release upon the urban climate in a Japanese megacity [J].https://doi.org/10.1016/j.envres.2009.02.013 URL PMID: 19349044 [本文引用: 1] 摘要
This report presents results of investigations of the influence of anthropogenic heat release in Japanese megacity (Keihanshin district) upon the urban climate, using the energy database [Shimoda et al., 1999. Estimation and evaluation of artificial waste heat in urban area. Selected Papers from the Conference ICB-ICUC 99 WCASP-50 WMO/TD no. 1026] as a part of the land-surface boundary conditions of a mesoscale meteorological simulation model. The calculated results related to atmospheric temperature distribution were similar to observed values not only for daily averages but also for amplitudes and phases of diurnal change. To reproduce accurately, it is essential to reproduce urban characteristics such as an urban canopy and anthropogenic heat release in a fine resolution mesh. We attempted an analysis using current data for anthropogenic heat and under uniform heat release conditions, to investigate temporal and spatial characteristics in relation to the influence of anthropogenic heat release on the urban climate. The results of investigation into the influence of anthropogenic heat release on atmospheric temperature using current data indicate that the amount of heat released is lower at night than during the day, but the temperature rise is nearly 3 times greater. Results of investigation into the influence of anthropogenic heat release on wind systems using current data indicate that the onset of land breezes is delayed, particularly in a coastal area. Investigation into the temporal characteristics related to the influence of anthropogenic heat release under uniform heat release conditions showed a maximum influence on temperature during the predawn period.
|
| [36] |
Urban thermal environment dynamics and associated landscape pattern factors: A case study in the Beijing metropolitan region [J].https://doi.org/10.1016/j.rse.2015.11.027 URL [本文引用: 1] 摘要
61LST dynamic was examined in Beijing during 2001–2009.61LST increased averagely in the whole metropolitan area but decreased in city center.61Built-up areas and barren land contribute most to UHI.61Cooling effects of ecological land is obvious with the proportion above 70%.61LST is determined more by landscape composition than spatial configuration.
|
| [37] |
Anthropogenic heat release in an old European agglomeration (Toulouse, France) [J].https://doi.org/10.1002/joc.1530 URL [本文引用: 1] 摘要
At the scale of the agglomeration, the basal state of energy consumption (observed during the summer period) varies between 25 W m-2 for the densest areas to less than 5 W m-2 for the residential suburban areas. In the regions crossed by the major roads, the traffic is the major source during summer. Then during the winter period, Q F can reach 100 W m-2 in the densest areas of Toulouse whereas it ranges between 5 and 25 W m-2 in the suburban areas. Copyright 2007 Royal Meteorological Society
|
| [38] |
The urban canyon and building energy use: Urban density versus daylight and passive solar gains [J].https://doi.org/10.1016/j.enbuild.2011.04.007 URL [本文引用: 1] 摘要
The link between urban density and building energy use is a complex balance between climatic factors and the spatial, material and use patterns of urban spaces and the buildings that constitute them. This study uses the concept of the urban canyon to investigate the ways that the energy performance of low-energy buildings in a north-European setting is affected by their context. This study uses a comprehensive suite of climate-based dynamic thermal and daylight simulations to describe how these primary factors in the passive energy properties of buildings are affected by increases in urban density. It was found that the geometry of urban canyons has an impact on total energy consumption in the range of up to +30% for offices and +19% for housing, which shows that the geometry of urban canyons is a key factor in energy use in buildings. It was demonstrated how the reflectivity of urban canyons plays an important, previously underestimated role, which needs to be taken into account when designing low-energy buildings in dense cities. Energy optimization of urban and building design requires a detailed understanding of the complex interplay between the temporal and spatial phenomena taking place, merging qualitative and quantitative considerations.
|
| [39] |
The urban energy balance [J].https://doi.org/10.1177/030913338801200401 URL [本文引用: 1] |
| [40] |
Urbanization-induced regional warming in Yangtze River Delta: Potential role of anthropogenic heat release [J].https://doi.org/10.1002/joc.4296 URL [本文引用: 1] 摘要
ABSTRACT Accompanying with the rapid urbanization in Yangtze River Delta (YRD), large amounts of anthropogenic heat are released into the atmosphere, which is becoming a more and more severe issue for the local climate. To understand what role anthropogenic heat release (AHR) plays in the urbanization-induced regional warming, high-resolution (3 km) Weather Research and Forecast WRF model experiments are carried out for 7 years (2001 2007) with different configurations of urban land use (ULU) and AHR. The results show that AHR can cause notable warming in almost the whole YRD rather than confining to the local cities where it releases, which is more significant in winter than in summer if the same amounts of AHR apply, especially at winter night. And furthermore, it can decrease (somewhat increase) the diurnal temperature range (DTR) in winter (summer). On the contrary, urban canopy effect due to the change from rural to ULU can produce a stronger warming in summer than in winter, and always reduce DTR in both winter and summer. Contribution of AHR to the sensible heat flux in urban regions is responsible for those AHR-caused warming and DTR features, because it is larger in winter and at winter night but much smaller in summer and at summer night. Without ambient wind effect, AHR-caused warming centres in cities and spreads around homogeneously. However, under the prevailing wind, it has less magnitude, shifts to the downwind city edges and forms a warming belt along the wind direction, which may favour linking the adjacent AHR-caused warming together. On the other hand, AHR-caused warming depends on the city sizes that are proportional to the total amount of AHR emitted.
|
| [41] |
Assessing the effects of land use and land cover patterns on thermal conditions using landscape metrics in city of Indianapolis, United States [J].https://doi.org/10.1007/s11252-007-0020-0 URL [本文引用: 1] 摘要
Direct applications of remote sensing thermal infrared (TIR) data in landscape ecological research are rare due to limitations in the sensors, calibration, and difficulty in interpretation. Currently there is a general lack of methodology for examining the relationship between land surface temperatures (LST) derived from TIR data and landscape patterns extracted from optical sensors. A separation of landscapes into values directly related to their scale and signature is a key step. In this study, a Landsat ETM+ image of Indianapolis, Unites States, acquired on June 22, 2000, was spectrally unmixed (using spectral mixture analysis, SMA) into fraction endmembers of green vegetation, soil, high albedo, and low albedo. Impervious surface was then computed from the high and low albedo images. A hybrid classification procedure was developed to classify the fraction images into seven land use and land cover (LULC) classes. Using the fractional images, the landscape composition and pattern were examined. Next, pixel-based LST measurements were correlated with the landscape fractional components to investigate LULC based relationships between LST and impervious surface and green vegetation fractions. An examination of the relationship between the LULC and LST maps with landscape metrics was finally conducted to deepen understanding of their interactions. Results indicate that SMA-derived fraction images were effective for quantifying the urban morphology and for providing reliable measurements of biophysical variables. LST was found to be positively correlated with impervious surface fraction but negatively correlated with green vegetation fraction. Each temperature zone was associated with a dominant LULC category. Further research should be directed to the theoretical and applied implications of describing such relationships between LULC patterns and urban thermal conditions.
|
| [42] |
Urbanization and heterogeneous surface warming in eastern China [J].https://doi.org/10.1007/s11434-012-5627-8 URL [本文引用: 1] 摘要
With the homogeneity-adjusted surface air temperature (SAT) data at 312 stations in eastern China for 1979-2008 and the Defense Meteorological Satellite Program/Operational Linescan System (DMSP/OLS) nighttime light data, the spatial heterogeneities of the SAT trends on different scales are detected with a spatial filtering (i.e. moving spatial anomaly) method, and the impact of urbanization in eastern China on surface warming is analyzed. Results show that the urbanization can induce a remarkable summer warming in Yangtze River Delta (YRD) city cluster region and a winter warming in Beijing-Tianjin-Hebei (BTH) city cluster region. The YRD warming in summer primarily results from the significant increasing of maximum temperature, with an estimated urban warming rate at 0.132-0.250 degrees C per decade, accounting for 36%-68% of the total regional warming. The BTH warming in winter is primarily due to the remarkable increasing of minimum temperature, with an estimated urban warming rate at 0.102-0.214 degrees C per decade, accounting for 12%-24% of the total regional warming. The temporal-spatial differences of urban warming effect may be attributed to the variation of regional climatic background and the change of anthropogenic heat release.
|
| [43] |
The impact of building density and building height heterogeneity on average urban albedo and street surface temperature [J].https://doi.org/10.1016/j.buildenv.2015.03.037 URL [本文引用: 1] 摘要
61The impact of canyon geometry on average urban albedo and street surface temperature are investigated.61The medium-density urban absorbs the solar radiation most.61The average urban albedo increase as building height become uniformity.61Obviously relationship is found between the sky view factor of the canyon and the street surface temperature.
|

/
| 〈 |
|
〉 |