陈世莉 , 李郇, 赖安琪
CHEN Shili, LI Xun, LAI Anqi
通讯作者:
版权声明: 2017 地理科学进展 《地理科学进展》杂志 版权所有
基金资助:
作者简介:
作者简介:陈世莉(1990-),女,四川达州人,博士生,主要方向为空间数据挖掘、城市空间结构研究,E-mail:SLChen@126.com。
展开
摘要
在新常态区域协同发展的机制下,同城化发展的进程不断加快,由此导致的热岛效应影响不断凸显。城市热岛效应的时空变化,是土地利用类型的改变和人们活动等相互作用的结果。本文以广佛同城区域为例,采用2000年和2010年珠三角的土地利用类型数据,利用WRF(Weather & Research Forecasting Model)气象数值模式,分析广佛同城化加速发展带来的热岛效应强度变化。同时,应用连续变化的灯光数据提取2000-2010年间广佛的建成区变化,从个人口密度、户籍数及工业生产总值等角度出发,对广佛同城化区域热岛强度的湿度变化进行相关性和二元回归分析,研究同城化过程中对热岛效应产生的决定性影响。研究表明,广佛交界处的荔湾、南海、白云、三水、番禺、顺德等地区的气温明显高于其他地区,而月平均相对湿度明显低于其他地区,形成大范围的城市热岛和城市干岛。研究还发现,随着建成区面积的增加,热岛强度增强;人口增长及地区生产总值的变化,与广佛同城化区域热岛强度的相关系数超过0.68。总体而言,广佛同城化发展带来人类活动的加强与土地利用类型的改变,对热岛效应具有重要的影响。
关键词:
Abstract
Under the new-normal mechanism of coordinated regional development, the trend of urban integration has been gathering momentum and consequently intensifying urban heat island effects. Spatial-temporal changes in urban heat island effects are a result of interactions between changing land-use pattern, underlying surface variation, and human activities. Base on the case of the Guangzhou-Foshan urban integration area, this study examined the changing intensities of urban heat island effects in the heightened process of Guangzhou-Foshan integration. Apart from analyzing the land-use classification data in the Pearl River Delta as well as formulating a meteorological numerical model—Weather & Research Forecasting Model (WRF), this research aimed to ascertain the determinant factors of urban heat island effects through the following methodology: (1) use the constantly changing nightlight data to investigate the expansion of built-up areas in the Guangzhou-Foshan region between 2000 and 2010; (2) use data on population density, household numbers, and total output values to conduct correlation and multiple regression analyses with the variation of air humidity to reflect the intensity of urban heat island effects in the Guangzhou-Foshan urban integration area. The research findings show that, with the development of Guangzhou-Foshan integration, temperature of the Liwan, Nanhai, Baiyun, Sanshui, Panyu, and Shunde areas at the junction of Guangzhou and Foshan is clearly higher than that of other areas, and the monthly mean relative humidity is clearly lower than other regions, which results in the formation of a large-scale urban heat island and urban dry island. Meanwhile, the size of the built-up area in the city-region is a major factor contributing to the intensity of urban heat island effects in the Guangzhou-Foshan urban integration area. Considerable intensifying impact has also been brought about by population growth and resultant increase in regional output values, the correlation coefficient of the two exceeded 0.68, which indicates that human activities and changes in land-use pattern have also played their part.
Keywords:
自工业化以来,世界各地城市化进程不断加快,推动经济全球化和区域经济一体化的发展。尤其在国内,伴随城市建设和城市群的兴起,“同城化”的概念逐渐发展,并成为众多区域板块的发展思路和理念(邢铭, 2007; 曾群华, 2013)。由于城市化将自然生态系统转变为人与自然耦合系统,不可避免地会对生态环境、区域气候以及生命健康造成各种影响,也因此愈发受到关注(陈述彭, 1999; Carlson et al, 2000; Gunawardhana et al, 2011; Peng et al, 2012; Peng et al, 2016)。相应地,同城化进程中城市间相互融合,城市土地利用方式、程度和性质,与早期城市化过程中“摊大饼”式的用地发展规律有所不同,产生的负面影响也不尽相同。因此,揭示同城化过程中,城市中气温、湿度、风场等变化,有助于了解这一阶段的负面环境效应;另一方面,掌握同城化过程中人们行为活动区域内气候的变化规律,以此来控制能耗和减少城市环境污染,对于增强城市居民的健康水平具有重要意义。
城市热岛是城市化引起环境变化的典型代表之一,是城市地表及大气温度高于周边非城市环境的现象,由城市下垫面土地利用、热力动力性质、人为热量的释放等原因导致,在都市区中很常见(Oke, 1982; Taha, 1997; Voogt et al, 2003; Buyantuyev et al, 2010; 彭保发等, 2013)。1883年Howard首次发现城市热岛现象,但直到1958年,Manley将这种现象命名为城市热岛效应,研究才发展起来(寿亦萱等, 2012)。早期研究主要是根据单站资料进行分析。20世纪70年代以来,观测数据的丰富和遥感技术的发展使得研究由点拓展到面,从而取得了关于城市热岛效应的现象、规律等多方面的研究成果(Unwin, 1980; Magee et al, 1999)。同时,实验室仿真试验(Cenedese et al, 2003)和数值模拟(Kusaka et al, 2000; Zhang et al, 2009, 2011)等技术的发展,进一步推动了城市热岛效应的研究。
近年来,国内外学者对城市热岛的研究主要关注形态与结构(Morris et al, 2001; Miao et al, 2009)、能量变化(Champollion et al, 2009; Ryu et al, 2012)以及交互机制与模拟(Sarkar, 2004; Freitas et al, 2007; King et al, 2007)等方面。研究发现,城市化建设使大气动力学特征和下垫面热交换性质发生改变,地表覆盖和土地利用也迅速变化,促进城市热岛的形成(彭保发等, 2013)。尤其是一些学者指出,土地利用及植被覆盖变化是城市热岛效应形成、演变的主要因素(Saitoh et al, 1996; Kolokotroni et al, 2008; 岳文泽等, 2008)。因为每种土地利用类型的热学或辐射特征不同,往往表现为城市用地类型温度高,而自然要素例如裸土、植被以及水体等具有降温效应(Streutker, 2003; Sun, Chen, 2012; Sun, Chen, et al, 2012)。因此,城市的扩张引起土地利用类型的变化,从而使城市热岛效应产生相应的变化(杨英宝等, 2007)。
国内对于城市热岛的研究主要利用气象观测资料(曹爱丽等, 2008; 穆海振等, 2008)、遥感技术(徐祥德等, 2004; 杨英宝等, 2007; 岳文泽等, 2008)或者数值模拟(桑建国等, 2000; 蒋维楣等, 2007)等方法,对上海、北京、南京等城市热岛效应进行研究;一些学者也分析了广州市的热岛效应的影响因素(Ma et al, 2010; 樊亚鹏等, 2014)。但这些研究总体上偏向于城市热岛效应的特点、影响因素、作用机理等方面,很少有对几个城市或城市群的影响因素结合作用机理的综合研究,针对“同城化”这一特殊发展模式的热岛效应研究基本处于空白。
作为国内最早推动同城化发展的地区之一,广州、佛山两市是国内同城化发展较为成功的个案之一(王德等, 2009; 魏宗财等, 2014)。因此,本文以广佛同城化区域为例,首先采用2000和2010年珠三角区域的土地利用类型数据,利用美国国家大气研究中心(NCAR)研发的高分辨率天气研究预报模式WRF (Weather & Research and Forecasting Model),模拟并解析同城化发展前后热岛效应各方面要素的变化。其次,采用DMSP/OLS夜间灯光数据提取同城化区域内的城市建成区,结合人口密度等辅助数据,探究广佛同城化过程中城市热岛效应的决定性影响因素。最后,定量分析影响城市热岛效应的各因素所占比重以及各因素之间的相关性。
广州作为广东省省会,一直是华南地区的政治、经济、文化中心。佛山,位于广东省中部,东接广州,南邻中山,是珠三角重要的工业基地。广佛同城化从2002年开始,2009年政府编制了《广佛同城化发展规划》,由于具备了同城化的基础条件和良好的动力机制,该区域同城化发展较为成功。广佛同城化的发展并非强调广佛两地所有地区同时实现同城,而是让重要且联系紧密的核心区先实现同城化发展,进而带动其余地区实现同城化。因此,本文主要选取广佛交界处以及对周边地区有较大经济联系强度的辐射区域,最终选定广州的白云区、番禺区、荔湾区、越秀区、花都区以及南沙区,佛山的顺德区、南海区以及三水区,共9个区作为研究对象,土地面积共计10895.37 km2。
本文使用的下垫面数据分别来自于SPOT卫星、Envisat卫星2000年及2009年反演数据得到的GLC2000数据和GLC2009数据,空间分辨率分别为1 km和300 m,分类标准为Land Cover Classification System(LCCS)。
研究使用的夜间灯光数据为由美国国防气象卫星(Defense Meteorological Satellite Program, DMSP)搭载的业务型线扫描传感器(Operational Linescan System, OLS)探测获得的2000年和2010年的DMSP/OLS夜间灯光影像。
WRF模式是美国国家大气研究中心(National Center for Atmospheric Research, NCAR)研发的高分辨率天气研究与预报模式,是目前应用最广的气象模式之一。近年来适用模式研究城市效应已有很多相关成果(Masson, 2006)。其中,由于WRF模式采用了更先进的数值计算和资料同化技术,对不同地形、多种嵌套网络具有更好地计算效果,近年来已开始广泛应用于热岛效应的模拟理论与应用研究,并逐渐成为热岛效应研究中的重要中尺度数值模式之一。
本文利用WRF气象模式,采用两套不同时间和来源的土地利用类型资料,对广州、佛山两地区2010年1月、7月的气温、湿度、感热和潜热通量4个方面进行数值模拟研究,分析在同城化作用加强的背景下,广佛同城化区域热岛效应强度的变化特征。
2.3.1 模拟实验设计
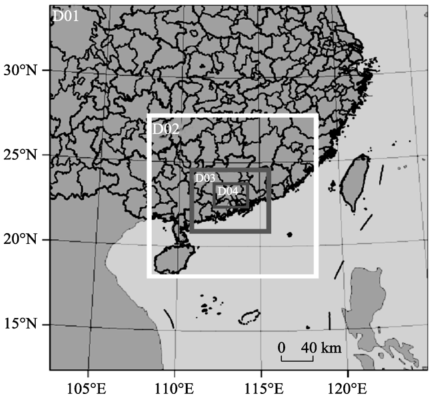
本文以WRF-ARW模式作为研究工具,设计了采取Lambert地图投影的四重嵌套网格,水平格距分别为27 km、9 km、3 km和1 km(图1)。研究着重分析包含广州和佛山两地的第四重网格的模拟结果,垂直方向层数为30层,模式顶层为50 hPa。通过参考珠三角地区WRF数值模拟的相关研究(麦健华等, 2011; 张艳霞等, 2013; 洪莹莹等, 2015),总结了一套适合珠三角区域的参数选取方案。模式采用双参数云微物理方案(WRF Double-Moment 6-Class,WDM 6)(Lim et al, 2010)、Monin-Obukhov表层方案、Noah地表方案(Chen et al, 2001)、YSU边界层方案(Noh et al, 2003),积云参数化在模拟区域D01、D02中采用Kain-Fritsch 2积云方案(Kain et al, 1990);在模拟区域D03和D04中由于网格可分辨出云尺度物理量,不采用任何积云对流参数化方案。初始条件和边界条件由每6小时1次的1°×1°FNL再分析资料提供,并内插至模拟区域。
图1 WRF四重嵌套网格
Fig.1 Weather & Research Forecasting Model (WRF) four nested grids
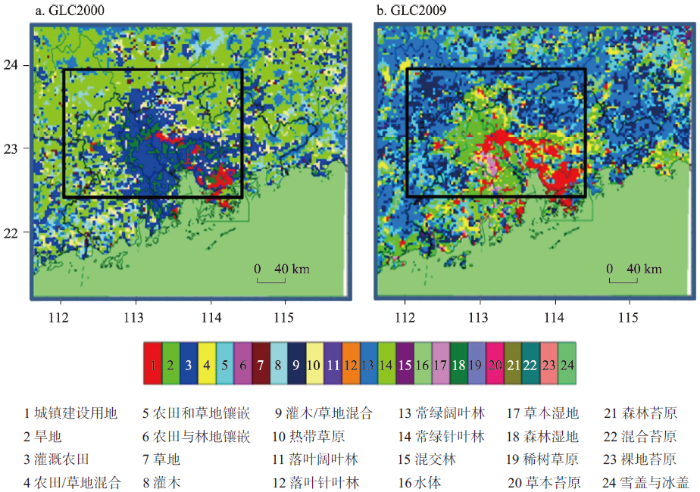
分别对1月和7月设置了2个模拟试验,1月模拟时间为2009年12月30日00时-2014年2月1日00时(UTC),7月模拟时间为2010年6月29日00时-8月1日00时(UTC),其中前两天为启动时间(spin-up)。1月和7月的控制试验(GLC2009)和敏感性试验(GLC2000)均分别采用相同的物理参数方案、初始和边界条件,唯一不同的是下垫面类型资料,以此来探讨广佛同城化发展导致下垫面改变的影响。图2(a)和2(b)分别是控制试验和敏感性试验中采用的两套下垫面类型数据,分别代表2010年下垫面类型情况的GLC2009和代表2000年的GLC2000。
对比图2(a)和2(b),可以看出,从2000年到2010年广佛交界处经历了快速的城市扩张,大量农田转变为城镇,这一改变会对该地区的气象场产生重要的影响。
图2 珠三角土地利用类型空间分布图
Fig.2 Spatial distribution of land use types in the Pearl River Delta, (a) GLC2000;(b)GLC2009
2.3.2 模式验证
为了检验模式模拟气象场的准确性,选取了模拟区域内广州、东莞和高要3个站点的观测数据对模拟结果进行统计检验,主要检验的要素包括2 m气温,2 m相对湿度和10 m风速。表1是GLC2009试验模拟的1月和7月的2气温(T2)、2 m相对湿度(Rh2)和10 m风速(WS10)的验证结果,其中OBS为观测平均值,SIM为模拟平均值,MB为平均偏差,MAE为平均绝对误差,RMSE为均方根误差,R为相关系数,IOA为符合指数,计算公式参考蓝静(2013)。从统计表1可见,1月和7月相对湿度,温度和风速的IOA都在0.88以上,其中温度和湿度的IOA达到了0.99。模式对1月份湿度和温度的模拟较准确,相关系数都超过0.8;7月份模拟效果不如1月份,但是相关系数也在0.66以上。总体而言,模拟结果可较好地反映实际大气的情况。
表1 气温、相对湿度以及风速的模拟值和观测值的比较
Tab.1 Comparison of simulated and observed temperature, relative humidity, and wind speed
| 气象要素 | OBS | SIM | MB | MAE | RMSE | R | IOA | |
|---|---|---|---|---|---|---|---|---|
| 1月 | Rh2 /% | 76.43 | 73.19 | -3.24 | 6.23 | 7.49 | 0.87 | 0.99 |
| T2/℃ | 14.79 | 16.45 | 1.66 | 2.39 | 2.84 | 0.80 | 0.99 | |
| WS10/(m/s) | 1.71 | 2.43 | 0.72 | 0.91 | 1.17 | 0.60 | 0.92 | |
| 7月 | Rh2/% | 74.01 | 74.96 | 0.95 | 6.49 | 7.71 | 0.66 | 0.99 |
| T2/℃ | 29.21 | 29.69 | 0.48 | 1.37 | 1.71 | 0.75 | 0.99 | |
| WS10/(m/s) | 2.12 | 2.63 | 0.51 | 1.31 | 1.76 | 0.67 | 0.88 |
DMSP/OLS夜间灯光数据已广泛应用于城市建成区的提取,因此本文采用夜间灯光数据提取研究区域内2000年和2010年的建成区。由于长时间序列的DMSP/OLS夜间灯光影像数据主要存在2个问题:一是原始数据中的影像是非连续性的;二是数据中的每一期影像都存在着像元DN值饱和的现象。因此,在使用灯光数据提取城市建成区之前需要对其进行预处理以及校正。
首先对2000年和2010年的DMSP/OLS夜间灯光影像采取一种不变目标区域法的影像校正方法对数据进行校正(曹子阳等, 2015)。该校正方法包括相互校正、饱和校正和影像间的连续性校正3个部分。同时,对校正后的夜间灯光提取建成区阈值方法主要有4类:经验阈值法、突变检测法、统计数据法和较高分辨率影像数据空间比较法(舒松等, 2011)。本文采用统计数据法提取建成区,该方法是通过测试不断逼近已知建成区的统计面积,得到未知建成区的灯光面积提取阈值。结果如图3所示。
本文利用广州市2000年和2010年的土地利用类型变化数据作为输入参数,从能反映热岛效应强度的气温、湿度以及感热和潜热通量4个方面分析广佛地区土地利用类型改变后热岛效应强度的变化。
3.1.1 气温变化
土地利用类型改变后,地表的几何、辐射以及热力特性参数的变化会改变地表能量平衡,导致近地层气温发生变化。城市化发展对气温影响最突出的特征就是热岛效应,本文将WRF模式输出结果中的2 m温度(T2)作为气温,讨论城市扩张对全天、白天和夜间气温的影响。
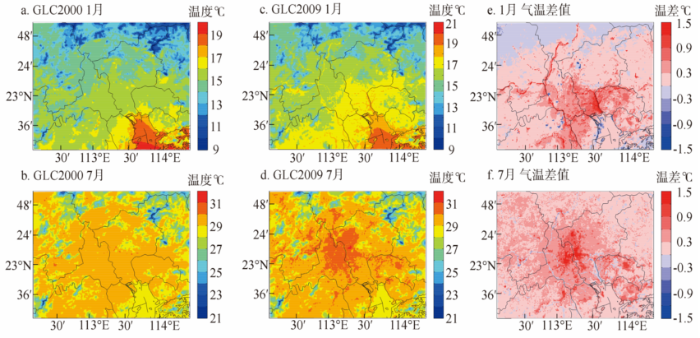
图4 GLC2000试验和GLC2009试验模拟的月平均2 m气温及其差值(差值 = GLC2009-GLC2000)
Fig.4 Simulated spatial distribution of monthly average 2-m temperature (°C) in GLC2000 case and GLC2009 case, and monthly average 2-m temperature differences (differences = GLC2009 - GLC2000).
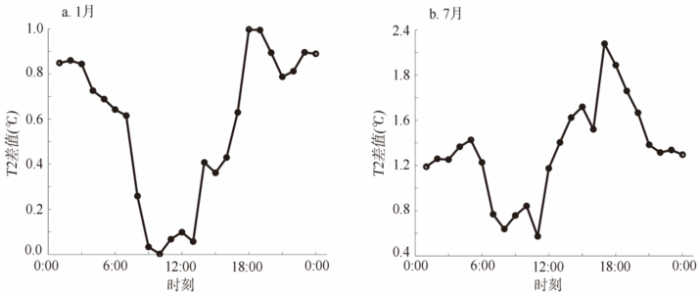
图5 GLC2009试验与GLC2000试验模拟的2 m气温差值的日变化曲线 (差值 = GLC2009 - GLC2000)
Figure.5 GLC2009 test and GLC2000 test simulation of the daily variation of the temperature difference of the 2m curve (a: January, b: July) (difference = GLC2009 - GLC2000)
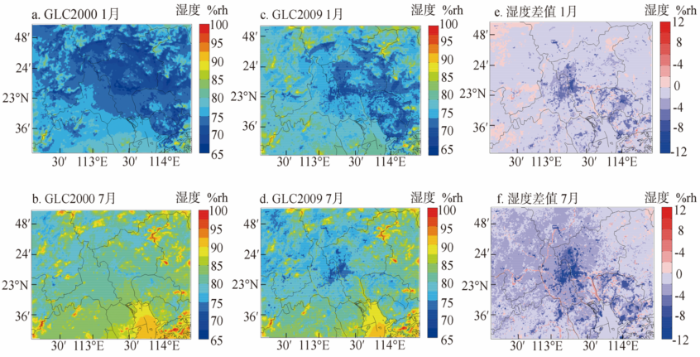
图6 GLC2000试验和GLC2009试验模拟的月平均2 m相对湿度及其差值(差值 = GLC2009 - GLC2000)
Fig.6 Simulated spatial distribution of monthly average 2-m relative humidity (%) in GLC2000 case and GLC2009 case, and monthly average 2-m relative humidity differences (differences = GLC2009 - GLC2000).
图4为同城化前后,1月和7月温度的模拟结果的对比,由图看出,在同城化之前,除了较为偏远的从化外,广州、佛山两地的月平均气温基本保持一致;随着同城化的发展,广佛交界处的荔湾、南海、白云、三水、番禺、顺德等地区的气温明显高于其他地区,形成大范围的城市热岛。2个试验的地表温度差异可很好地反映城市发展造成的增温效应。从差值图看,1月和7月模拟区域内2 m气温均有不同程度的升高,1月平均气温上升了0.20 ℃,7月则上升了0.31 ℃。其中广佛交界处的增温最为明显,形成明显的高温峰值区域,说明该地区由于城市化而出现了明显的城市热岛效应。城市区域增温主要是城市下垫面建筑材料的热容量吸收大量太阳辐射热量及人为热释放等作用形成的。
由图5可见,与城市发展相伴随的增温效应具有明显的日变化,在日落前的18时左右达到最大值,1月最大为1 ℃,7月则高达2.2 ℃。城市发展对大气的增温效应在夜间比较明显,一方面由于城市储热能力高于农田,白天积蓄的热量会在夜间释放(张璐等, 2011);另一方面,夜间边界层高度较低,热量的垂直交换比白天弱,城市下垫面比农田下垫面多释放出的热量被分配在一段相对较短的空气柱中,因此夜间的城市地表温度上升更多。
3.1.2 湿度变化
同城化在影响广佛地区气温的同时,对相对湿度也有一定影响。图6为同城化前后1月和7月模式对2 m相对湿度(Rh2)模拟结果的对比。由此可见,发展迅速的广佛交界处的月平均相对湿度明显低于其他地区,形成了大范围的城市干岛。从差值图来看,城市下垫面的扩张造成了1月和7月珠三角中心城区2 m相对湿度的一致减小,其中1月相对湿度的月平均值减小了1.14%,7月则减小了2.1%。相对湿度表示气块的潮湿程度,受绝对湿度和温度共同影响。在城市化过程中,大量耕地被改用为建筑用地,地面透水性变差,植被覆盖面积减少,从而降雨后雨水迅速流失,地面快速干燥,导致城市绝对水汽含量减少。同时,城市温度增加使得饱和水汽压增加,因此相对湿度减小。
3.1.3 感热和潜热通量的变化
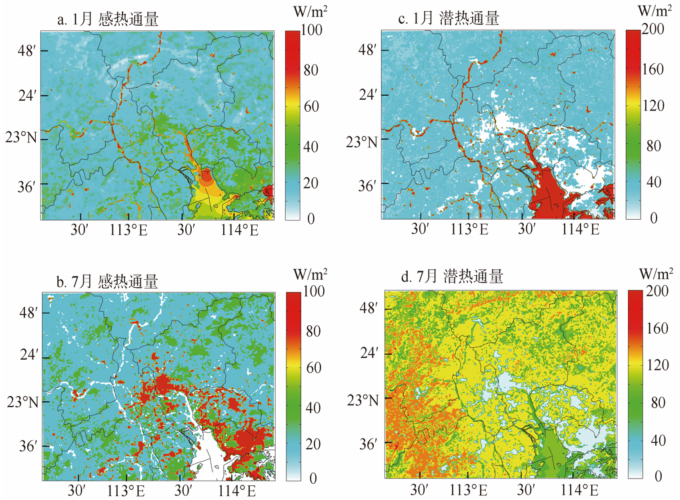
广佛同城化发展后,1月和7月模拟区域内月平均感热通量的分布如图7a-7b所示,由图可见,感热通量的分布随下垫面的不同差别很大。1月和7月,广佛交界处都为感热通量的大值中心,1月感热通量在50 W/m2左右,7月则高达135 W/m2,其他地区感热通量则明显较小。这种差别主要是由于城市与非城市下垫面不同的热力学性质所导致。与非城市下垫面相比,城市下垫面基本是基于不透水、热容量小的建筑材料组成,经太阳辐射后升温更迅速,导致向大气层传输的感热通量自然比郊区大,因此,城市的地面温度高于其他用地类型的温度。而潜热通量与感热通量呈现相反的特点,由图7c-7d可见,广佛交界处为潜热通量的低值中心,量值在20 W/m2以下。这是由于城市地区水汽含量较少,相比于非城市下垫面,城市区域可供蒸发的水分明显少于郊区,因此其地表向大气提供的潜热通量也小于郊区。广佛交界处为明显的感热通量大值中心和潜热通量小值中心,说明该地区的城市热岛效应主要取决于感热通量。
图7 GLC2009试验模拟的月平均感热通量及潜热通量
Fig.7 GLC2009 experimental simulation of the monthly mean sensible heat flux and latent heat flux
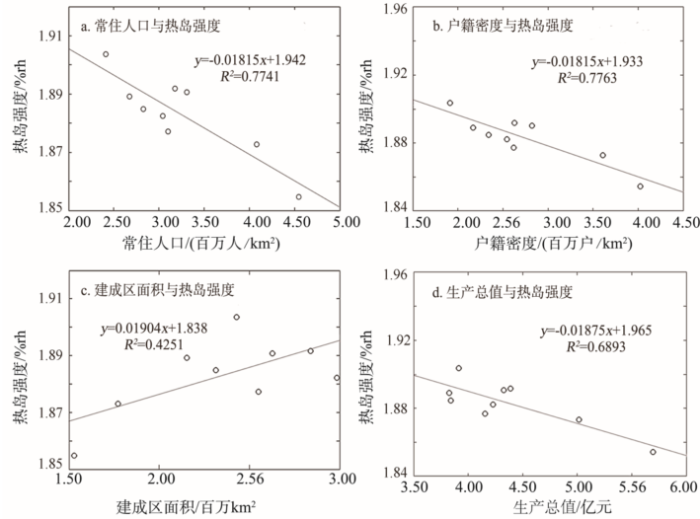
城市热岛强度主要体现为城市内部及城市间的气温、湿度、感热和潜热通量的变化,而影响强度变化的因素则是多个方面,本文主要从影响热岛强度最主要的4个方面即城市人口密度、户籍数、建成区面积以及生产总值,采取二元回归模型和相关分析方法,分析广佛地区同城化之后热岛强度变化的影响因素,其结果分别如图8和图9所示。
由图8可见,湿度与常住人口数、户籍数、生产总值呈现负相关关系,且R2整体高于0.68,说明随着人口的增加,产业的发展,城市空气中水分减少,温度增高,热岛效应加强;而建成区面积与湿度却呈现出正相关关系,说明广佛两地的同城化发展带来的建成区的增加主要是郊区的扩张,城区的扩张速度相对较慢。不过,1月和7月分别是广东最冷和最热的月份之一,其湿度总体会比其他月份高。
图8 各影响因素与湿度之间的关系
Fig. 8 Relationship between (a) permanent resident population, (b) household density, (c) urban area, (d) gross domestic product, and humidity of the urban area
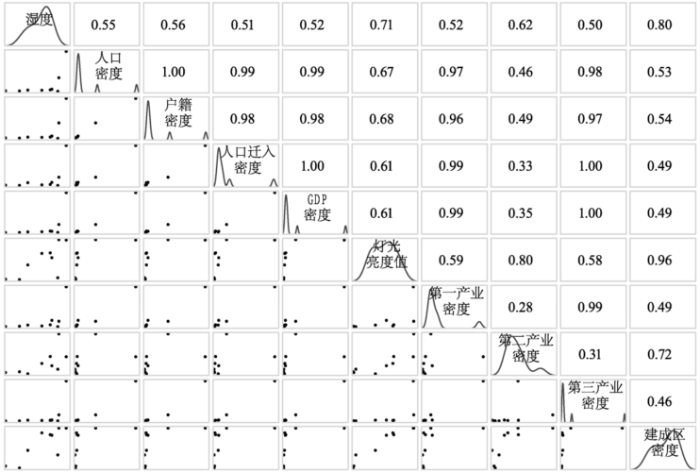
由图9可见,人口与产业密度密切相关。建成区总面积与湿度的相关系数为0.80,这是由于提取的建成区很大程度上由郊区组成所致。同时,常住人口密度、城市户籍数、工业生产总值与湿度的相关系数分别为0.55、0.56及0.52,说明随着城市化进程的不断加快,城市人口密度增加、工业发展迅速对城市气温、气候和环境有着重要的影响。特别是,人们活动的加强对城市热岛效应增强起至关重要的作用。
本文通过WRF模式提取广佛同城化区域内的气温、湿度以及感热和潜热通度的变化,利用夜间灯光数据提取建成区面积并结合经典的统计数据,采用二元回归与相关分析方法对影响广佛同城化区域内热岛效应的因素进行分析。研究发现,广佛同城化发展带来的人类活动加强与土地利用类型的改变,对热岛效应产生了重要的影响,主要表现为同城化区域气温、湿度、感热和潜热通量的不断变化。
同城化区域内的气温、湿度以及感热和潜热通量因素变化不仅具有时间上的波动性,还具有空间上的差异性。单从多年的变化来看,气温、湿度以及感热和潜热通量的变化在1月、7月稍有波动,总体呈现不断上升趋势;空间上佛山的顺德区、南海区、三水区的气温、湿度以及感热和潜热通量变化非常明显,广州的白云区、番禺区、花都区也有着显著变化,而广州越秀区的气温、湿度以及感热和潜热通量变化却不显著。具体地,随着同城化的发展,广佛交界处的荔湾、南海、白云、三水、番禺、顺德等地区的气温明显高于其他地区,1月、7月模拟区域内月平均气温分别上升了0.20℃和0.31℃。而广佛交界处的月平均相对湿度明显低于其他地区,其中1月、7月相对湿度的月平均值分别减少1.14%和2.1%,形成了大范围的城市干岛。同时,广佛交界处都为感热通量的大值中心,1月、7月感热通量分别在50 W/m2和100 W/m2。广佛同城化区域呈现增温明显、湿度低、感热通量高的特征,呈现明显的城市热岛效应。
由于热岛效应的强度变化与区域气温的波动呈现正相关关系,即气温升高的7月的热岛效应强度明显高于气温低的1月,说明区域气温升高,热岛效应也变强;区域气温降低,热岛效应也相对变弱。同时,热岛效应的强度变化与区域湿度、感热和潜热通量也呈现正相关关系,区域湿度、潜热通量低,热岛效应强,反之亦反。同时,研究结果表明,建成区面积的变化是广佛同城化区域热岛强度的主要因素,人口密度、户籍数以及地区生产总值都是影响广佛同城化区域热岛强度的重要因素。对热岛效应影响因素的分析,本文考虑了影响热岛效应强度最重要的四种因素,并未考虑更多的因素,后续研究会将影响热岛效应的多种人为因素考虑在内。
The authors have declared that no competing interests exist.
| [1] |
上海近50年气温变化与城市化发展的关系 [J].
<FONT face=Verdana>根据上海地区2个气象站近50年的年均气温数据,采用回归分析、滑动平均和Mann\|Kendall检验法研究上海地区气温的年代际变化与跃变,城郊温差的年际变化;采用趋势拟合与相关分析,研究城郊温差与城市人口、GDP、能源消耗量、建成区面积和住宅竣工面积等各项城市发展指标的关系.结果表明:(1)近50年来,上海地区年均气温缓慢上升,20世纪90年代后城郊温差呈锯齿状上升趋势,若以徐家汇代表城区,奉贤代表郊区,则近50年来,城郊温差增温率为0.23℃/10a.(2)1989~1990年为上海城区气温的跃变年份,而郊区的气温跃变出现在20世纪90年代中期.(3)各项城市发展指标均与上海城郊温差有着显著的相关性,表明它们与上海城市热岛的发展关系密切,其中,住宅建设是上海城市热岛最主要的驱动因素,城市人口和经济发展也具有重要影响.</FONT>
Decadal changes of air temperature in Shanghai in recent 50 years and its relation to urbanization [J].
<FONT face=Verdana>根据上海地区2个气象站近50年的年均气温数据,采用回归分析、滑动平均和Mann\|Kendall检验法研究上海地区气温的年代际变化与跃变,城郊温差的年际变化;采用趋势拟合与相关分析,研究城郊温差与城市人口、GDP、能源消耗量、建成区面积和住宅竣工面积等各项城市发展指标的关系.结果表明:(1)近50年来,上海地区年均气温缓慢上升,20世纪90年代后城郊温差呈锯齿状上升趋势,若以徐家汇代表城区,奉贤代表郊区,则近50年来,城郊温差增温率为0.23℃/10a.(2)1989~1990年为上海城区气温的跃变年份,而郊区的气温跃变出现在20世纪90年代中期.(3)各项城市发展指标均与上海城郊温差有着显著的相关性,表明它们与上海城市热岛的发展关系密切,其中,住宅建设是上海城市热岛最主要的驱动因素,城市人口和经济发展也具有重要影响.</FONT>
|
| [2] |
DMSP/OLS夜间灯光影像中国区域的校正及应用 [J].https://doi.org/10.3724/SP.J.1047.2015.01092 URL Magsci 摘要
美国国防气象卫星搭载的业务型线扫描传感器(DMSP/OLS)获取的夜间灯光影像,可客观地反映人类开发建设活动强度,其广泛应用于城市遥感的多个领域.但该数据缺少星上的辐射校正,下载的原始影像数据集不能直接用于研究,需进行区域校正.长时间序列的DMSP/OLS夜间灯光影像数据集主要存在2个问题需在校正过程中解决:(1)原始影像数据集中的影像是非连续性的;(2)数据集中的每一期影像都存在着像元DN值饱和的现象.针对这2个问题,本文提出了一种不变目标区域法的影像校正方法,对提取出来的每一期中国区域的夜间灯光影像进行了校正,该校正方法包括相互校正、饱和校正和影像间的连续性校正.最后,为了检验校正方法的合理性与可靠性,本文将校正前后中国夜间灯光影像与GDP和电力消耗值,分别进行回归分析评价表明,校正后的影像更客观合理地反映区域经济发展的差异.
Correction of DMSP/OLS night-time light images and its application in China [J].https://doi.org/10.3724/SP.J.1047.2015.01092 URL Magsci 摘要
美国国防气象卫星搭载的业务型线扫描传感器(DMSP/OLS)获取的夜间灯光影像,可客观地反映人类开发建设活动强度,其广泛应用于城市遥感的多个领域.但该数据缺少星上的辐射校正,下载的原始影像数据集不能直接用于研究,需进行区域校正.长时间序列的DMSP/OLS夜间灯光影像数据集主要存在2个问题需在校正过程中解决:(1)原始影像数据集中的影像是非连续性的;(2)数据集中的每一期影像都存在着像元DN值饱和的现象.针对这2个问题,本文提出了一种不变目标区域法的影像校正方法,对提取出来的每一期中国区域的夜间灯光影像进行了校正,该校正方法包括相互校正、饱和校正和影像间的连续性校正.最后,为了检验校正方法的合理性与可靠性,本文将校正前后中国夜间灯光影像与GDP和电力消耗值,分别进行回归分析评价表明,校正后的影像更客观合理地反映区域经济发展的差异.
|
| [3] |
|
| [4] |
广州市城市扩展及其城市热岛效应分析 [J].
Analysis of urban expansion and urban heat island effect in Guangzhou City [J].
|
| [5] |
珠三角城市化对大气边界层特征影响的数值模拟 [J].https://doi.org/10.1347/j.cnki.acta.snus.2015.01.023 URL [本文引用: 1] 摘要
利用WRF/UCM模式对珠江三角洲2008年秋季一次大气污染过程的气象场特征进行模拟。在模式中针对下垫面类型数据和人为热通量来设置敏感性试验以探讨城市化对大气边界层特征的影响。研究结果表明:城市化发展(包括城市土地利用类型的改变以及人为热通量的加入和增加)均能增强城市热岛效应和干岛效应,使夜间地面逆温现象更加显著,地面污染物容易积累;地表粗糙度的增加使风速减小,城市化使热岛环流增强,污染物难以扩散,这也是造成空气污染事件的原因;同时城市的发展能抬升白天和夜晚的大气边界层高度。
Numerical simulation of the ur-banization impact on atmospheric boundary layer characteristics over the Pearl River Delta, China [J].https://doi.org/10.1347/j.cnki.acta.snus.2015.01.023 URL [本文引用: 1] 摘要
利用WRF/UCM模式对珠江三角洲2008年秋季一次大气污染过程的气象场特征进行模拟。在模式中针对下垫面类型数据和人为热通量来设置敏感性试验以探讨城市化对大气边界层特征的影响。研究结果表明:城市化发展(包括城市土地利用类型的改变以及人为热通量的加入和增加)均能增强城市热岛效应和干岛效应,使夜间地面逆温现象更加显著,地面污染物容易积累;地表粗糙度的增加使风速减小,城市化使热岛环流增强,污染物难以扩散,这也是造成空气污染事件的原因;同时城市的发展能抬升白天和夜晚的大气边界层高度。
|
| [6] |
人为热对城市边界层结构影响研究 [J].https://doi.org/10.3878/j.issn.1006-9895.2007.01.04 URL Magsci 摘要
为研究不同人为热源引入方案对城市边界层结构模拟性能的影响,以杭州地区为例,在区域边界层模式(RBLM)中引入一种新人为热源处理方案,即对城市中的人为热排放分层考虑,将低层的人为热源加入地表能量平衡方程,将高层人为热源分布与建筑物高度和密度联系起来,加入热量方程中,同时考虑了人为热源强度的日变化。数值试验结果表明,这是一种比较合理的处理方案。人为热源引入方案对城市边界层结构的影响表现在:气温、湍流动能增加,并通过湍流交换输送到较高层大气;大气不稳定度增加,混合层高度最高抬升了400m;城市地区上升速度增加,热岛环流加强;白天人为热源一般为太阳辐射的10%~20%,对地气交换的影响较小。夜间没有了太阳辐射能量,对地气交换的影响比日间更明显;冬季低层湍流活动加强,湍能约增加40%,大气层结稳定度降低。
The impact of anthropogenic heat on urban boundary layer structure [J].https://doi.org/10.3878/j.issn.1006-9895.2007.01.04 URL Magsci 摘要
为研究不同人为热源引入方案对城市边界层结构模拟性能的影响,以杭州地区为例,在区域边界层模式(RBLM)中引入一种新人为热源处理方案,即对城市中的人为热排放分层考虑,将低层的人为热源加入地表能量平衡方程,将高层人为热源分布与建筑物高度和密度联系起来,加入热量方程中,同时考虑了人为热源强度的日变化。数值试验结果表明,这是一种比较合理的处理方案。人为热源引入方案对城市边界层结构的影响表现在:气温、湍流动能增加,并通过湍流交换输送到较高层大气;大气不稳定度增加,混合层高度最高抬升了400m;城市地区上升速度增加,热岛环流加强;白天人为热源一般为太阳辐射的10%~20%,对地气交换的影响较小。夜间没有了太阳辐射能量,对地气交换的影响比日间更明显;冬季低层湍流活动加强,湍能约增加40%,大气层结稳定度降低。
|
| [7] |
珠三角区域气溶胶污染及低能见度过程的数值模拟[D] .Nu-merical simulations of the aerosol pollution and low-visibility events over PRD region[D]. |
| [8] |
城市化对珠江三角洲热岛效应影响的模拟 [J].https://doi.org/10.3969/j.issn.1001-5221.2011.02.012 URL Magsci 摘要
利用新一代中尺度数值模式WRF以及其耦合的单层城市冠层模型 (UCM),设计了3个模拟试验,以探讨下垫面改变以及引入人为热源对珠三角热岛效应的影响.结果表明:城市下垫面以及人为热排放均加强了该地区的城市热 岛效应,而敏感性试验表明,下垫面的改变引起的城市地区增温幅度比引人人为热源的增温幅度相对要大.另外,珠三角城市区域为明显的感热通量大值中心和潜热 通量小值中心,其表现出的总效果是使城市地区温度比其他地区要高,该地区的城市热岛效应主要是由感热通量决定的.
A simulation about the impact of urbanization on the urban heat island in the Pearl River Delta region [J].https://doi.org/10.3969/j.issn.1001-5221.2011.02.012 URL Magsci 摘要
利用新一代中尺度数值模式WRF以及其耦合的单层城市冠层模型 (UCM),设计了3个模拟试验,以探讨下垫面改变以及引入人为热源对珠三角热岛效应的影响.结果表明:城市下垫面以及人为热排放均加强了该地区的城市热 岛效应,而敏感性试验表明,下垫面的改变引起的城市地区增温幅度比引人人为热源的增温幅度相对要大.另外,珠三角城市区域为明显的感热通量大值中心和潜热 通量小值中心,其表现出的总效果是使城市地区温度比其他地区要高,该地区的城市热岛效应主要是由感热通量决定的.
|
| [9] |
上海气温变化及城市化影响初步分析 [J].Preliminary analysis of temperature change in Shanghai and ur-banization impacts [J]. |
| [10] |
城市热岛效应的影响机理及其作用规律: 以上海市为例 [J].https://doi.org/10.11821/dlxb201311002 URL Magsci 摘要
以上海市为例,从土地利用规模和强度的变化、类型和布局的变化、利用方式的变化三个方面揭示其对热岛效应的影响机理;实证分析结果表明:(1)土地城市化是上海城市热岛强度的主要影响因素;就建成区扩张对热岛强度的具体影响而言,累积效应大于其增量效应;(2)工业化、房地产开发、人口增长对上海城市热岛强度均具有较大的影响;就经济发展和能源消耗对城市热岛强度的具体影响而言,密度效应通常大于其规模效应;就全社会房屋竣工面积、20层以上高层建筑数量对热岛强度的影响而言,累积效应小于增量效应;就人口增长对城市热岛强度的具体影响而言,密度效应与规模效应大体相近;(3)土地利用和城市发展模式的差异导致了城市热岛效应的空间差异.
The impacting mechanism and laws of function of urban heat islands effect: A case study of Shanghai [J].https://doi.org/10.11821/dlxb201311002 URL Magsci 摘要
以上海市为例,从土地利用规模和强度的变化、类型和布局的变化、利用方式的变化三个方面揭示其对热岛效应的影响机理;实证分析结果表明:(1)土地城市化是上海城市热岛强度的主要影响因素;就建成区扩张对热岛强度的具体影响而言,累积效应大于其增量效应;(2)工业化、房地产开发、人口增长对上海城市热岛强度均具有较大的影响;就经济发展和能源消耗对城市热岛强度的具体影响而言,密度效应通常大于其规模效应;就全社会房屋竣工面积、20层以上高层建筑数量对热岛强度的影响而言,累积效应小于增量效应;就人口增长对城市热岛强度的具体影响而言,密度效应与规模效应大体相近;(3)土地利用和城市发展模式的差异导致了城市热岛效应的空间差异.
|
| [11] |
热岛环流的动力学分析 [J].https://doi.org/10.11676/qxxb2000.033 Magsci [本文引用: 1] 摘要
文中根据线性化的大气方程组求得了城市热岛环流的理论模式。利用此模式分析了温度场和流场的三维结构,并和观测结果做了对比。在解析解中,研究了大气条件诸如风速、湍流扩散系数、Ragleigh摩擦以及层结的影响,同时讨论了重力波对温度分布垂直结构的效应。
Dynamical analyses on heat island circulation [J].https://doi.org/10.11676/qxxb2000.033 Magsci [本文引用: 1] 摘要
文中根据线性化的大气方程组求得了城市热岛环流的理论模式。利用此模式分析了温度场和流场的三维结构,并和观测结果做了对比。在解析解中,研究了大气条件诸如风速、湍流扩散系数、Ragleigh摩擦以及层结的影响,同时讨论了重力波对温度分布垂直结构的效应。
|
| [12] |
城市热岛效应的研究进展与展望 [J].https://doi.org/10.11676/qxxb2012.031 Magsci 摘要
随着世界各国城市化的进展,城市热岛效应已经成为一个跨学科领域的问题,受到包括大气环境、区域气候、水文和生态等多学科科学家的关注。在过去半个多世纪中,城市热岛问题的研究获得了相当丰富的研究成果,通过对这些成果的综合分析,归纳出城市热岛研究中采用的3类主要方法——观测(外场试验和遥感技术)、数值模拟以及实验室仿真法。系统地回顾了城市热岛效应的研究历史,重点对与城市热岛关系最密切的城市边界层、热岛环流与复杂地形的相互作用以及能量平衡研究所取得的成果进行了总结和评述。最后对城市热岛问题未来8个可能的研究方向进行了探讨,其中,包括沿海和复杂地形附近的城市热岛问题、城市群间热岛环流的相互作用、城市化与空气污染问题、城市热岛效应对平均降水的影响、 城市化对雾和闪电的影响、城市天气预报的精细化、城市气候变化预测以及城市热岛效应减缓方案的制定,并对其发展前景进行了粗略的展望。
Recent advances in understanding urban heat island effects with some future prospects [J].https://doi.org/10.11676/qxxb2012.031 Magsci 摘要
随着世界各国城市化的进展,城市热岛效应已经成为一个跨学科领域的问题,受到包括大气环境、区域气候、水文和生态等多学科科学家的关注。在过去半个多世纪中,城市热岛问题的研究获得了相当丰富的研究成果,通过对这些成果的综合分析,归纳出城市热岛研究中采用的3类主要方法——观测(外场试验和遥感技术)、数值模拟以及实验室仿真法。系统地回顾了城市热岛效应的研究历史,重点对与城市热岛关系最密切的城市边界层、热岛环流与复杂地形的相互作用以及能量平衡研究所取得的成果进行了总结和评述。最后对城市热岛问题未来8个可能的研究方向进行了探讨,其中,包括沿海和复杂地形附近的城市热岛问题、城市群间热岛环流的相互作用、城市化与空气污染问题、城市热岛效应对平均降水的影响、 城市化对雾和闪电的影响、城市天气预报的精细化、城市气候变化预测以及城市热岛效应减缓方案的制定,并对其发展前景进行了粗略的展望。
|
| [13] |
基于夜间灯光数据的城市建成区提取方法评价与应用 [J].
<p>DMSP/OLS夜间灯光数据已被广泛应用于城市建成区的提取。目前主要存在4类提取方法:经验阈值法、突变检测法、统计数据法和较高分辨率影像数据空间比较法。以上海为例,在2000年、2003年、2006年夜间灯光数据的基础上,利用4种方法完成了城市建成区的提取。通过对不同年份数据提取结果的比较,证明了相同的灰度分割阈值对不同年份的夜间灯光数据中不存在通用性;在对2003年夜间灯光数据的提取中,4类方法所得结果精确度从高到低依次为统计数据法、突变检测法、经验阈值法和较高分辨率影像数据空间比较法,相对误差分别为1.3%、2.1%、5.1%和11.2%,在对4种方法的便捷性和可实现性进行分析与评价后,使用突变检测法完成了上海市2000~2006年城市建成区的提取。</p>
Methods for deriving urban built-up area using night-light data: Assessment and application [J].
<p>DMSP/OLS夜间灯光数据已被广泛应用于城市建成区的提取。目前主要存在4类提取方法:经验阈值法、突变检测法、统计数据法和较高分辨率影像数据空间比较法。以上海为例,在2000年、2003年、2006年夜间灯光数据的基础上,利用4种方法完成了城市建成区的提取。通过对不同年份数据提取结果的比较,证明了相同的灰度分割阈值对不同年份的夜间灯光数据中不存在通用性;在对2003年夜间灯光数据的提取中,4类方法所得结果精确度从高到低依次为统计数据法、突变检测法、经验阈值法和较高分辨率影像数据空间比较法,相对误差分别为1.3%、2.1%、5.1%和11.2%,在对4种方法的便捷性和可实现性进行分析与评价后,使用突变检测法完成了上海市2000~2006年城市建成区的提取。</p>
|
| [14] |
同城化发展战略的实施进展回顾 [J].
A review on the implementation of city integration strategy [J].
|
| [15] |
对我国同城化规划实施的思考: 以《广佛同城化发展规划》为例 [J].https://doi.org/10.3969/j.issn.1000-3363.2014.02.010 URL [本文引用: 1] 摘要
自2008年开始,国务院先后 批复了20余项区域规划,将区域发展上升到国家战略层面。而"同城化"作为一个新的区域发展理念,也成为规划实践的"热点".成为国内城市与区域发展、区 域协调的一种新的模式。广佛、郑汴、沈抚、长株潭、西咸等地的同城化、一体化规划不断涌现。但当前同城化规划的实施情况如何?地方政府是如何发挥作用的? 它们之间的关系有何变化?这对规划的实施又有何影响?以《广佛同城化发展规划(2009—2020年)》为例,采用文献综述、实地调查、半结构式访谈等研 究方法,从同城化过程中的个案分析视角切入,对同城化规划的实施效果以及不同层次的地方政府的"对话"过程进行研究,以期对我国新一轮区域规划实施及其动 力机制进行深入分析。认为规划实施过程中还存在多层级的管制平台尚未建立、相关鼓励机制欠缺、专职的管治机构有待设立,城市规划管理和编制方面缺少对话的 基础等问题,并提出相应的建议。
Reconsideration on the implementation thoughts on city integration planning in China: Case of Guang-Fo integration development planning [J].https://doi.org/10.3969/j.issn.1000-3363.2014.02.010 URL [本文引用: 1] 摘要
自2008年开始,国务院先后 批复了20余项区域规划,将区域发展上升到国家战略层面。而"同城化"作为一个新的区域发展理念,也成为规划实践的"热点".成为国内城市与区域发展、区 域协调的一种新的模式。广佛、郑汴、沈抚、长株潭、西咸等地的同城化、一体化规划不断涌现。但当前同城化规划的实施情况如何?地方政府是如何发挥作用的? 它们之间的关系有何变化?这对规划的实施又有何影响?以《广佛同城化发展规划(2009—2020年)》为例,采用文献综述、实地调查、半结构式访谈等研 究方法,从同城化过程中的个案分析视角切入,对同城化规划的实施效果以及不同层次的地方政府的"对话"过程进行研究,以期对我国新一轮区域规划实施及其动 力机制进行深入分析。认为规划实施过程中还存在多层级的管制平台尚未建立、相关鼓励机制欠缺、专职的管治机构有待设立,城市规划管理和编制方面缺少对话的 基础等问题,并提出相应的建议。
|
| [16] |
沈抚同城化建设的若干思考 [J].https://doi.org/10.3321/j.issn:1002-1329.2007.10.010 URL 摘要
辽中城市群一体化是一个复杂的系统工程,七城市联系的紧密程度和发展重点各不相同。沈抚同城化是辽中城市群一体化的重要组成部分。本文主要论述沈抚同城化的条件、思路以及同城化建设内容,尤其强调了联合大都市区构建、沈抚城市空间重构、基础设施同建、生态环境协同治理、统一开发旅游资源和消除行政壁垒等,并就沈抚连接带地区开发的规划结构和功能区布局进行了论述。
Thoughts over inte-gration of Shenyang-Fushun metropolitan area [J].https://doi.org/10.3321/j.issn:1002-1329.2007.10.010 URL 摘要
辽中城市群一体化是一个复杂的系统工程,七城市联系的紧密程度和发展重点各不相同。沈抚同城化是辽中城市群一体化的重要组成部分。本文主要论述沈抚同城化的条件、思路以及同城化建设内容,尤其强调了联合大都市区构建、沈抚城市空间重构、基础设施同建、生态环境协同治理、统一开发旅游资源和消除行政壁垒等,并就沈抚连接带地区开发的规划结构和功能区布局进行了论述。
|
| [17] |
BECAPEX科学试验城市建筑群落边界层大气环境特征及其影响 [J].https://doi.org/10.11676/qxxb2004.064 Magsci [本文引用: 1] 摘要
2001~2003年在北京实施了大气边界层动力、热力、化学综合观测试验(BECAPEX,Beijing City Atmospheric Pollution Observation Field Experiment),获取了北京城市大气动力和大气化学三维结构图像。综合观测试验分析研究发现,城市区域呈非均匀次生尺度热岛分布,并伴随着城市次生尺度环流,影响了局地空气污染物分布特征。MODIS卫星遥感地面观测资料经过变分分析,可发现北京城市空气污染与周边区域影响源有密切关系,并影响城市群落环境气候特征,导致该区域日照、雾日、低云量和能见度呈显著年代际变化趋势。
Characteristics of atmospheric envin-ronment of boundary layer structure of city community in BECAPEX and integrate influence [J].https://doi.org/10.11676/qxxb2004.064 Magsci [本文引用: 1] 摘要
2001~2003年在北京实施了大气边界层动力、热力、化学综合观测试验(BECAPEX,Beijing City Atmospheric Pollution Observation Field Experiment),获取了北京城市大气动力和大气化学三维结构图像。综合观测试验分析研究发现,城市区域呈非均匀次生尺度热岛分布,并伴随着城市次生尺度环流,影响了局地空气污染物分布特征。MODIS卫星遥感地面观测资料经过变分分析,可发现北京城市空气污染与周边区域影响源有密切关系,并影响城市群落环境气候特征,导致该区域日照、雾日、低云量和能见度呈显著年代际变化趋势。
|
| [18] |
南京市热岛效应变化时空特征及其与土地利用变化的关系 [J].https://doi.org/10.3321/j.issn:1000-0585.2007.05.003 URL Magsci 摘要
利用遥感数据和气象统计数据分析自1985年以来南京市热岛效应变化的时空特征及其与土地利用变化的关系。结果表明:自1985年以来,南京市热岛效应强度和范围在增长。南京市的年均温逐年上升,与郊区六合县的温差呈上升趋势;南京市建成区内4级热岛效应面积增加了107.88km2。热岛效应增长在空间上存在差异,大厂雨花台市辖区栖霞浦口江宁。南京市土地利用变化的结果使得热岛效应空间分布更广泛,城镇居民点及工矿用地利用强度变化最大的地方即城市热岛效应增加最多的地方,两者在空间上具有很好的吻合;而和城镇居民点及工矿用地的扩展规模没有很好的空间相关性。
Spatial-temporal characteristics of urban heat island effect change of Nanjing City and its relation with land use change [J].https://doi.org/10.3321/j.issn:1000-0585.2007.05.003 URL Magsci 摘要
利用遥感数据和气象统计数据分析自1985年以来南京市热岛效应变化的时空特征及其与土地利用变化的关系。结果表明:自1985年以来,南京市热岛效应强度和范围在增长。南京市的年均温逐年上升,与郊区六合县的温差呈上升趋势;南京市建成区内4级热岛效应面积增加了107.88km2。热岛效应增长在空间上存在差异,大厂雨花台市辖区栖霞浦口江宁。南京市土地利用变化的结果使得热岛效应空间分布更广泛,城镇居民点及工矿用地利用强度变化最大的地方即城市热岛效应增加最多的地方,两者在空间上具有很好的吻合;而和城镇居民点及工矿用地的扩展规模没有很好的空间相关性。
|
| [19] |
上海市人类活动对热环境的影响 [J].
<p>随着城市规模不断扩张, 由城市热岛现象而导致的热环境问题不断凸现。城市热环境 的时空变化, 是下垫面改变、人为热释放和环境污染等人类活动因素相互交织作用的结果。 由于城市热环境影响因子的复杂性, 传统观测手段和统计方法在获取数据和分析人类活动对 热环境响应机制方面存在着局限性。而卫星遥感和GIS 技术为人类活动对城市热环境的影响 分析提供了技术支撑。选用Landsat ETM+ 影像, 以上海市外环内区域为研究靶区, 在探讨热 环境的空间格局基础上, 运用空间主成分分析方法替代传统的多准则判断(MCE) 方法, 分析 了人类活动对城市热环境的影响特征。结果发现, 对于上海主城区而言, 城市建筑与人口密 度、工业区布局、下垫面类型以及城市景观多样性四个因子是影响城市热环境空间格局的主 导因子; 四个因子的线性模型, 较好地模拟了热环境的空间变化, 定量揭示了上海城市人类活动对热环境的影响机制。</p>
Impact of human activities on urban thermal environment in Shanghai [J].
<p>随着城市规模不断扩张, 由城市热岛现象而导致的热环境问题不断凸现。城市热环境 的时空变化, 是下垫面改变、人为热释放和环境污染等人类活动因素相互交织作用的结果。 由于城市热环境影响因子的复杂性, 传统观测手段和统计方法在获取数据和分析人类活动对 热环境响应机制方面存在着局限性。而卫星遥感和GIS 技术为人类活动对城市热环境的影响 分析提供了技术支撑。选用Landsat ETM+ 影像, 以上海市外环内区域为研究靶区, 在探讨热 环境的空间格局基础上, 运用空间主成分分析方法替代传统的多准则判断(MCE) 方法, 分析 了人类活动对城市热环境的影响特征。结果发现, 对于上海主城区而言, 城市建筑与人口密 度、工业区布局、下垫面类型以及城市景观多样性四个因子是影响城市热环境空间格局的主 导因子; 四个因子的线性模型, 较好地模拟了热环境的空间变化, 定量揭示了上海城市人类活动对热环境的影响机制。</p>
|
| [20] |
关于区域同城化的研究综述 [J].https://doi.org/10.3969/j.issn.1674-7178.2013.06.009 URL 摘要
继2005年深圳最早提出与香港形成"同城化"的发展态势和理念后,国内众多相邻区域都先后提出了同城化的发展战略与思路,各区域板块正呈现出以"同城化"为导向或龙头的区域经济发展趋势。本文归纳和总结了国内同城化的研究概况与进展,以期对相邻区域的发展模式提供一定的启示。
A research synthesis on the synchronization among regional cities [J].https://doi.org/10.3969/j.issn.1674-7178.2013.06.009 URL 摘要
继2005年深圳最早提出与香港形成"同城化"的发展态势和理念后,国内众多相邻区域都先后提出了同城化的发展战略与思路,各区域板块正呈现出以"同城化"为导向或龙头的区域经济发展趋势。本文归纳和总结了国内同城化的研究概况与进展,以期对相邻区域的发展模式提供一定的启示。
|
| [21] |
夏季长三角城市群热岛效应及其对大气边界层结构影响的数值模拟 [J].Simulation of urban heat island effect and its impact on atmospheric boundary layer structure over Yangtze River Delta region in summer [J]. |
| [22] |
WRF耦合城市冠层模式对珠三角城市群天气模拟影响的评估 [J].URL 摘要
基于是否耦合城市冠层模式的3个对比试验(无城市冠层模式:W-NUR;单层冠层模式:W—UCM;多层冠层模式:W-BEP),应用WRF模式模拟了珠江三角洲(简称珠三角)地区发生于2011年6月21日午后的一次强降水过程,发现W-UCM、W-BEP试验的模拟结果均优于W-NUR试验,但降水落区与实际观测相比仍有差异。为此应用前期10d(2011年6月11-20日)的模拟结果,通过对珠三角城市群6个站点基本气象要素模拟效果的评估,重点考察了W-NUR及W-UCM试验结果的差异,并对模拟降水存在差异形成的原因进行分析。评估结果表明:无论是W-NUR还是W-UCM,模拟的10m高度风速普遍偏强,其中W-NUR模拟的平均风速比观测偏强1.61m/s,W.UCM偏强1.58m/s;W.NUR模拟的2m高度温度及温度露点差均较观测偏低,温度平均偏差-1.28℃,温度露点差平均偏差-1.39℃,而W.UCM模拟的温度及温度露点差较观测偏高,温度平均偏差略高0.14oC,温度露点差平均偏高1.12℃。平均偏差及均方根误差分析反映出,温度模拟的误差最小,其次为温度露点差,风速误差最大,而且模拟温度和温度露点差与观测相关性更好,相关系数分别大于0.60和0.50,通过0.001显著性水平检验,而风速的相关性则相对较弱。总体来看,尽管耦合冠层模式后WRF对地面气象要素的预报有所改善,但模拟的10m高度风速仍然偏强。就21日强降水过程的模拟来说,由于偏北风偏强造成切变线南压可能是模拟降水落区偏南的一个原因。
Investigating the use of WRF urban canopy models in weather simulation over Pearl River Delta Metropolitan area [J].URL 摘要
基于是否耦合城市冠层模式的3个对比试验(无城市冠层模式:W-NUR;单层冠层模式:W—UCM;多层冠层模式:W-BEP),应用WRF模式模拟了珠江三角洲(简称珠三角)地区发生于2011年6月21日午后的一次强降水过程,发现W-UCM、W-BEP试验的模拟结果均优于W-NUR试验,但降水落区与实际观测相比仍有差异。为此应用前期10d(2011年6月11-20日)的模拟结果,通过对珠三角城市群6个站点基本气象要素模拟效果的评估,重点考察了W-NUR及W-UCM试验结果的差异,并对模拟降水存在差异形成的原因进行分析。评估结果表明:无论是W-NUR还是W-UCM,模拟的10m高度风速普遍偏强,其中W-NUR模拟的平均风速比观测偏强1.61m/s,W.UCM偏强1.58m/s;W.NUR模拟的2m高度温度及温度露点差均较观测偏低,温度平均偏差-1.28℃,温度露点差平均偏差-1.39℃,而W.UCM模拟的温度及温度露点差较观测偏高,温度平均偏差略高0.14oC,温度露点差平均偏高1.12℃。平均偏差及均方根误差分析反映出,温度模拟的误差最小,其次为温度露点差,风速误差最大,而且模拟温度和温度露点差与观测相关性更好,相关系数分别大于0.60和0.50,通过0.001显著性水平检验,而风速的相关性则相对较弱。总体来看,尽管耦合冠层模式后WRF对地面气象要素的预报有所改善,但模拟的10m高度风速仍然偏强。就21日强降水过程的模拟来说,由于偏北风偏强造成切变线南压可能是模拟降水落区偏南的一个原因。
|
| [23] |
Urban heat islands and landscape heterogeneity: Linking spatiotemporal varia-tions in surface temperatures to land-cover and socioeconomic patterns [J].https://doi.org/10.1007/s10980-009-9402-4 URL Magsci [本文引用: 1] 摘要
The urban heat island (UHI) phenomenon is a common environmental problem in urban landscapes which affects both climatic and ecological processes. Here we examined the diurnal and seasonal characteristics of the Surface UHI in relation to land-cover properties in the Phoenix metropolitan region, located in the northern Sonoran desert, Arizona, USA. Surface temperature patterns derived from the Advanced Spaceborne Thermal Emission and Reflection Radiometer for two day-night pairs of imagery from the summer (June) and the autumn (October) seasons were analyzed. Although the urban core was generally warmer than the rest of the area (especially at night), no consistent trends were found along the urbanization gradient. October daytime data showed that most of the urbanized area acted as a heat sink. Temperature patterns also revealed intra-urban temperature differences that were as large as, or even larger than, urban鈥搑ural differences. Regression analyses confirmed the important role of vegetation (daytime) and pavements (nighttime) in explaining spatio-temporal variation of surface temperatures. While these variables appear to be the main drivers of surface temperatures, their effects on surface temperatures are mediated considerably by humans as suggested by the high correlation between daytime temperatures and median family income. At night, however, the neighborhood socio-economic status was a much less controlling factor of surface temperatures. Finally, this study utilized geographically weighted regression which accounts for spatially varying relationships, and as such it is a more appropriate analytical framework for conducting research involving multiple spatial data layers with autocorrelated structures.
|
| [24] |
The impact of land use—land cover changes due to urbanization on surface microclimate and hydrology: A satellite perspective [J].https://doi.org/10.1016/S0921-8181(00)00021-7 URL 摘要
Vegetation cover, surface moisture availability (wetness) and radiant surface temperature constitute microclimatic variables derivable from multi-spectral satellite imagery. In addition, fraction impervious surface cover and urban-induced surface runoff (RO) are obtainable from such imagery when it is combined with a conventional image classification. Using AVHRR and Landsat TM data, we illustrate how these parameters respond to urbanization with a case study of Chester County, PA 鈥 a region that has undergone rapid urban development over the past decade. Specific factors affecting the change in the surface microclimatic variables are discussed. Based on a statistical analysis of the Chester County data, future values of these microclimatic parameters can be predicted, given the characteristics of the initial land surface and an estimate of the change in vegetation and urban coverage.
|
| [25] |
Interaction between an inland urban heat island and a sea-breeze flow: A labora-tory study [J].https://doi.org/10.1175/1520-0450(2003)042<1569:IBAIUH>2.0.CO;2 URL [本文引用: 1] 摘要
Using laboratory experimental data taken from a temperature-controlled water tank, the basic features of the circulation associated with an inland urban heat island (UHI) of diameter and surface heating rate and its interaction with a sea-breeze current were investigated. When the environment was stably stratified with a buoyancy frequency (nocturnal UHIs) and the sea breeze was absent, the UHI circulation was mainly governed by the Froude number [Fr = /()], in agreement with theoretical predictions found in literature (was the horizontal velocity scale of the flow based on and ). Furthermore, the results were in agreement with other laboratory studies and with nighttime field observations conducted in large cities. It was found that when calculated with + (where was the surface heat flux associated with the land temperature growth occurring after sunrise), could also be employed as the velocity scale for UHI circulations that develop in statically unstable environments (daytime UHIs). Analysis of the interaction between an inland daytime UHI and a sea-breeze flow with maximum velocity showed that the resulting circulation was strongly dependent on the ratio /and that substantial differences from cases in which urban complexes are located along the shore were present. Comparison with numerical experiments also supports these results.
|
| [26] |
Water vapour variability induced by urban/rural surface heterogeneities during convective conditions [J].https://doi.org/10.1002/qj.446 URL 摘要
Abstract Scientific interest in urban meteorology has increased because highly populated areas experience high vulnerability to pollution or heavy rain. However, compared to urban air quality or urban heat island (UHI) processes, the urban water vapour cycle is poorly understood because it has been investigated less due to the lack of upper-air measurements and the high sensitivity of surface measurements to local heterogeneities. In this paper, surface measurements of wind, temperature, pressure and humidity, as well as integrated water vapour (IWV) from GPS and MODIS and numerical simulations, have been used to investigate the urban cycle of water vapour in May and June 2004 during the VAPIC field experiment in the Paris area. The surface data show the typical characteristics of an urban area with the absence of water vapour sources and a UHI of about 6 掳 C at night. The urban IWV distribution differs completely, with an urban IWV excess on average between 1600 and 0600 UTC (with a maximum of about 1.5 kg m 鈭2 at 0600 and 1700 UTC). No IWV difference between the urban and rural areas is found in the middle of the day. The numerical simulations reproduce accurately the urban IWV anomaly. Shallow surface wind convergence associated with the UHI during nighttime provides moisture from the rural areas. Urban areas are therefore under wind convergence for most of the time. The rural water vapour sources and the depth of the convergence control the amplitude of the urban IWV excess. At about 1200 UTC, entrainment at the top of the urban boundary layer is the key process that inhibits the urban IWV excess observed at night. Copyright 漏 2009 Royal Meteorological Society
|
| [27] |
Coupling an advanced land surface-hydrology model with the Penn State-NCAR MM5 modeling system. Part I: Model implementation and sensitivity [J]. |
| [28] |
Interactions of an urban heat island and sea-breeze circu-lations during winter over the metropolitan area of São Paulo, Brazil [J].https://doi.org/10.1007/s10546-006-9091-3 URL Magsci 摘要
The Town Energy Budget (TEB) model, a detailed urban parameterisation using a generalised canyon geometry, coupled with the Regional Atmospheric Modelling System (RAMS) is used to simulate the wintertime local circulation in the megacity environment of the metropolitan area of Sao Paulo (MASP) in Brazil. Model simulations are performed using actual topography and land-use fields. Comparison with a simple urban parameterisation based on the LEAF-2 scheme is also shown. Validation is based on comparison between model simulations and observations. Sensitivity tests with TEB reveal an important interaction between the sea breeze and the MASP heat island circulation. Even though topography is known to play an important role in the MASP region’s weather, in these tests the simulations were performed without topography in order to unambiguously identify the interaction between the two local circulations. The urban heat island (UHI) forms a strong convergence zone in the centre of the city and thereby accelerates the sea-breeze front toward the centre of the city. The presence of the urban region increases the sea-breeze front propagation mean speed by about 0.3202m02s 611 when compared with the situation of no city. After its arrival in the urban region, the sea-breeze front stalls over the centre of the city for about 202h. Subsequently, the sea breeze progresses beyond the city when the heat island dissipates. Thereafter, the sea breeze propagates beyond the urban area at a decelerated rate compared to a simulation without an UHI.
|
| [29] |
Impact of urbanization and climate change on aquifer thermal regimes [J].https://doi.org/10.1007/s11269-011-9854-6 URL Magsci [本文引用: 1] 摘要
We evaluated the past impacts of urbanization and climate change on groundwater—in particular, aquifer temperature—in the Sendai plain, Japan, and further compared with the probable changes due to changing climate in the future. A series of simulations were performed and matched with the observed temperature-depth profiles as a preliminary step for parameter calibration. The magnitude of ground surface warming estimated from subsurface temperature spans 0.9–1.3°C, which is consistent with the calibrated ground surface warming rates surrounding various observation wells (0.021–0.015°C/year) during the last 6002years. We estimate that approximately 75% of the ground surface temperature change can be attributed to the effect of past urbanization. For the climate predictions, climate variables produced by the UK Hadley Centre’s Climate Model (HadCM3) under the A2, A1B and B1 scenarios were spatially downscaled by the transfer function method. Downscaled monthly data were used in a water budget analysis to account for the variation in recharge and were further applied in a heat transport equation together with the estimated ground surface warming rates in 2080. Anticipated groundwater recharge under the projected climate in 2080 would decrease by 1–26% compared to the 2007 estimates, despite the projected 7–28% increase in precipitation, due to a higher degree of evapotranspiration resulting from a 2.5–3.9°C increase in surface air temperature. The overall results from the three scenarios predict a 1.8–3.7°C subsurface temperature change by 2080, which is notably greater than the previous effect of urbanization and climate change on aquifer temperature in the Sendai plain.
|
| [30] |
A one-dimensional entraining/detraining plume model and its application in convective parameterization [J].https://doi.org/10.1175/1520-0469(1990)0472.0.CO;2 URL 摘要
A new one-dimensional cloud model, specifically designed for application in mesoscale convective parameterization schemes (CPSs), is introduced. The model is unique in its representation of environmental entrainment and updraft detrainment rates. In particular, the two-way exchange of mass between clouds and their environment is modulated at each vertical level by a buoyancy sorting mechanism at the interface of clear and cloudy air. The new entrainment/detrainment scheme allows vertical profiles of both updraft moisture detrainment and updraft vertical mass flux to vary in a physically realistic way as a function of the cloud-scale environment. These performance characteristics allow the parameterized vertical distribution of convective heating and drying to be much more responsive to environmental conditions than is possible with a traditional one-dimensional entraining plume model.The sensitivities of the new model to variations in environmental convective available potential energy and vertical moisture distribution in idealized convective environments are demonstrated and its sensitivities to several key control parameters are examined. Finally, the performance of the new model in the Fritsch-Chappell CPS is evaluated. Parameterized heating and drying profiles are elucidated as they relate to the convective environment and to the type of cloud model used in the CPS.
|
| [31] |
A case study of urban heat islands in the Carolinas [J].https://doi.org/10.1016/j.envhaz.2007.09.005 URL [本文引用: 1] 摘要
Urbanization tends to aggravate the negative effects of climate. The objective of this research is to aid in the understanding of the spatial variation of urban heat islands within selected cities in North and South Carolina. This understanding will help guide efforts to cool cities in order to increase human comfort, conserve energy and resources, and reduce air pollution in both of these states.
|
| [32] |
Urban heat island intensity in London: An investigation of the impact of physical characteristics on changes in outdoor air temperature during summer [J].https://doi.org/10.1016/j.solener.2008.05.004 URL 摘要
The study looks at the potential of physical characteristics in mitigating the urban heat island intensity (UHI) in London during summer. This research uses six on-site variables namely aspect ratio, surface albedo, plan density ratio, green density ratio, fabric density ratio and thermal mass for the investigation in six data sets. The climatic variations in summer are controlled by classifying the data into clear sky, partially cloudy and cloudy periods. Geographical variation is controlled by classifying the data into core, urban and semi urban areas. Maximum daytime UHI of 8.902°C is found in semi-urban area during partially cloudy period while maximum nocturnal UHI of 8.602°C is found in urban area during clear sky period when the wind velocity is below 502m/s. The most critical climate and geographical location in determining the changes in outdoor air temperature in London are partially cloudy periods and urban areas respectively. Among the variables studied, most critical variable that determines the daytime and nocturnal changes in outdoor air temperature is surface albedo.
|
| [33] |
The effects of land-use alteration on the sea breeze and daytime heat island in the Tokyo metropolitan area [J].
The changes of a sea breeze and a daytime heat island due to land-use alteration during an 85 year period (1900-1985) have been numerically simulated. The domain of interest is the Kanto Plain (15000 km
|
| [34] |
Development of an effective double-moment cloud microphysics scheme with prognostic cloud condensation nuclei (CCN) for weather and climate models [J].https://doi.org/10.1175/2009MWR2968.1 URL 摘要
A new double-moment bulk cloud microphysics scheme, the Weather Research and Forecasting (WRF) Double-Moment 6-class (WDM6) Microphysics scheme, which is based on the WRF Single-Moment 6-class (WSM6) Microphysics scheme, has been developed. In addition to the prediction for the mixing ratios of six water species (water vapor, cloud droplets, cloud ice, snow, rain, and graupel) in the WSM6 scheme, the number concentrations for cloud and rainwater are also predicted in the WDM6 scheme, together with a prognostic variable of cloud condensation nuclei (CCN) number concentration. The new scheme was evaluated on an idealized 2D thunderstorm test bed. Compared to the simulations from the WSM6 scheme, there are greater differences in the droplet concentration between the convective core and stratiform region in WDM6. The reduction of light precipitation and the increase of moderate precipitation accompanying a marked radar bright band near the freezing level from the WDM6 simulation tend to alleviate existing systematic biases in the case of the WSM6 scheme. The strength of this new microphysics scheme is its ability to allow fle xibility in variable raindrop size distribution by predicting the number concentrations of clouds and rain, coupled with the explicit CCN distribution, at a reasonable computational cost.
|
| [35] |
Coupling urbanization analyses for studying urban thermal environment and its interplay with biophysical parameters based on TM/ETM+ imagery [J].https://doi.org/10.1016/j.jag.2009.12.002 URL Magsci [本文引用: 2] 摘要
Studies of urbanization and urban thermal environment are now attracting wide interests among scientists all over the world. This study investigated the influences of urbanization on urban thermal environment as well as the relationships of thermal characteristics to other biophysical variables in Guangzhou, China utilizing three dates of Landsat TM/ETM+ images acquired in 1990, 2000, and 2005, respectively. Vegetation abundances and percent impervious surfaces were derived by means of linear spectral mixture model, and a method for effectively enhancing impervious surface has been developed to accurately examine the urban enlargement. As a key parameter for studying urban thermal characteristics, the land surface temperature (LST) was also retrieved from thermal infrared band of each TM/ETM+ dataset. Based on these parameters, the urban expansion, urban heat island effect and the relationships of LSTs to other biophysical parameters were then analyzed. Results indicated that the area ratio of impervious surface in Guangzhou increased significantly, which grew from 20.56% in 1990, to 34.72% in 2000, and further to 41.12% in 2005, however, the intensity of urban heat island was not always enlarged in observed years. In addition, Geostatistical analyses showed that the mean-centre of the impervious surface was moving towards the northwest during 1990-2005. And correlation analyses revealed that, at the pixel-scale, the association of LSTs to other two variables (vegetation abundance and percent impervious surface) was not straightforward, while LSTs possessed a strong positive correlation with percent impervious surfaces and negative correlation with vegetation abundances at the regional-scale, respectively. This study provided an integrated research scheme and the findings can be very useful for urban ecosystem modeling.
|
| [36] |
The urban heat island effect at Fairbanks, Alaska [J].
|
| [37] |
On the frequency of snowfall in metropolitan England [J].https://doi.org/10.1002/qj.49708435910 URL [本文引用: 2] 摘要
No abstract is available for this article.
|
| [38] |
Urban surface modeling and the meso-scale impact of cities [J].https://doi.org/10.1007/s00704-005-0142-3 URL 摘要
However, there is need to validate further the different urban models available. In particular it is necessary to compare model output with urban surface energy balance measurements. An intercomparison exercise involving these urban schemes is suggested as an efficient way to assess and improve these models.
|
| [39] |
An observational and modeling study of characteristics of urban heat island and boundary layer structures in Beijing [J].https://doi.org/10.1175/2008JAMC1909.1 URL [本文引用: 1] 摘要
In this paper, the characteristics of urban heat island (UHI) and boundary layer structures in the Beijing area, China, are analyzed using conventional and Moderate Resolution Imaging Spectroradiometer (MODIS) observations. The Weather Research and Forecasting (WRF) model coupled with a single-layer urban canopy model (UCM) is used to simulate these urban weather features for comparison with observations. WRF is also used to test the sensitivity of model simulations to different urban land use scenarios and urban building structures to investigate the impacts of urbanization on surface weather and boundary layer structures. Results show that the coupled WRF/Noah/UCM modeling system seems to be able to reproduce the following observed features reasonably well: 1) the diurnal variation of UHI intensity; 2) the spatial distribution of UHI in Beijing; 3) the diurnal variation of wind speed and direction, and interactions between mountain-valley circulations and UHI; 4) small-scale boundary layer convective rolls and cells; and 5) the nocturnal boundary layer lower-level jet. The statistical analyses reveal that urban canopy variables (e.g., temperature, wind speed) from WRF/Noah/UCM compare better with surface observations than the conventional variables (e.g., 2-m temperature, 10-m wind speed). Both observations and the model show that the airflow over Beijing is dominated by mountain-valley flows that are modified by urban-rural circulations. Sensitivity tests imply that the presence or absence of urban surfaces significantly impacts the formation of horizontal convective rolls (HCRs), and the details in urban structures seem to have less pronounced but not negligible effects on HCRs.
|
| [40] |
Quantification of the influences of wind and cloud on the nocturnal urban heat island of a large city [J].https://doi.org/10.1175/1520-0450(2001)0402.0.CO;2 URL 摘要
Analyses taken over all observed weather conditions of daily 0600 EST climate data from a network of monitoring stations in and around the large city of Melbourne, Australia, revealed a 20-yr mean urban heat island (UHI) value of 1.13°C. The UHI varied seasonally between summer (1.29°C), spring (1.25°C), autumn (1.02°C), and winter (0.98°C). Investigations undertaken with daily wind speed and cloud amount data enabled a detailed investigation of the relative importance of factors such as the turbulent and radiative exchanges on Melbourne’s UHI. Analysis of variance and regression techniques were used to explore these processes and to predict the behavior of the UHI in numerical terms for mean seasonal and annual periods between 1972 and 1991. Over the 20-yr period, analyses of the association among Melbourne’s UHI, wind, and cloud revealed that the UHI was inversely proportional to approximately the fourth root of both the wind speed and the cloud amount. This relationship explained more of the UHI variance during summer and the least variance during winter. Increases in the amount of cloud cover and in the frequency of wind speeds in excess of 2.0 m sresulted in a statistically significant (95% confidence level) reduction in UHI magnitude. The influence of wind in limiting Melbourne’s UHI magnitude was greatest during clear to near-clear sky conditions. Similarly increases in cloud were most restrictive to UHI development during calm to low wind speeds. Unlike most previous studies, the linear regression analysis presented here revealed that cloud was more limiting than the wind speed to UHI development for all seasons except summer. Contour plots of the UHI are presented for the various associations between each category of cloud and wind. These plots enable a clear visual presentation of the most to least favorable conditions for UHI intensity and development. The analyses indicate that low wind speeds and little or no cloud were typically associated with the largest UHI development. Eight octas of cloud and wind speeds in excess of 5.0 m swere usually associated with modest (but still apparent) UHI development.
|
| [41] |
Improvement of the K-profile model for the planetary boundary layer based on large eddy simulation data [J].https://doi.org/10.1023/A:1022146015946 URL Magsci [本文引用: 1] 摘要
Modifications of the widely used K-profile model of the planetary boundary layer (PBL), reported by Troen and Mahrt (TM) in 1986, are proposed and their effects examined by comparison with large eddy simulation (LES) data. The modifications involve three parts. First, the heat flux from the entrainment at the inversion layer is incorporated into the heat and momentum profiles, and it is used to predict the growth of the PBL directly. Second, profiles of the velocity scale and the Prandtl number in the PBL are proposed, in contrast to the constant values used in the TM model. Finally, non-local mixing of momentum was included. The results from the new PBL model and the original TM model are compared with LES data. The TM model was found to give too high PBL heights in the PBL with strong shear, and too low heights for the convection-dominated PBL, which causes unrealistic heat flux profiles. The new PBL model improves the predictability of the PBL height and produces profiles that are more realistic. Moreover, the new PBL model produces more realistic profiles of potential temperature and velocity. We also investigated how each of these three modifications affects the results, and found that explicit representation of the entrainment rate is the most critical.
|
| [42] |
The energetic basis of the urban heat island [J].https://doi.org/10.1002/qj.49710845502 URL [本文引用: 1] 摘要
The energetic basis of the urban heat island OKE T. R. Quarterly Journal of the Royal Meteorological Society, 1982
|
| [43] |
Trend analysis of vegetation dynamics in Qinghai-Tibet Plateau using Hurst exponent [J].https://doi.org/10.1016/j.ecolind.2011.08.011 URL Magsci [本文引用: 1] 摘要
As one of the most sensitive areas responding to global environmental change, especially global climate change, Qinghai–Tibet Plateau has been recognized as a hotspot for coupled studies on global terrestrial ecosystem change and global climate change. As an important component of terrestrial ecosystems, vegetation dynamic has become one of the key issues in global environmental change, and numerous case studies have been conducted on vegetation dynamic trend in different study periods. However, few are focused on the quantitative analysis of the consistency of vegetation dynamic trends after the study periods. In the study, taking Qinghai–Tibet Plateau as a case, vegetation dynamic trend during 1982–2003 were analyzed, with the application of the method of linear regression analysis. The results showed that, vegetation dynamics in Qinghai–Tibet Plateau experienced a significant increasing as a whole, with nearly 50% forest degradation in the study period. And among the 7 kinds of vegetation types, the change of forest was the most fluctuant with desert the least one. Furthermore, the consistency of vegetation dynamic trends after the study period, was quantified using Hurst Exponent and the method of R/S analysis. The results showed high consistency of future vegetation dynamic trends for the whole plateau, and inconsistent areas were mainly meadow and steppe distributed in the middle or east of the plateau. It was also convinced that, vegetation dynamic trends in the study area were significantly influenced by topography, especially the elevation.
|
| [44] |
Urban thermal environment dynamics and associated landscape pattern factors: A case study in the Beijing metropolitan region [J].https://doi.org/10.1016/j.rse.2015.11.027 URL 摘要
Urbanization has eco-environmental consequences; among which are effects on the urban thermal environment, which have drawn extensive attention especially in metropolitan regions having intensive population and high building density. In this study, the variation of the thermal environment during the urbanization process from 2001 to 2009 in the Beijing metropolitan region was evaluated using the spatial Lorenz curve and distribution index. In addition, the effects of landscape composition and spatial configuration on the thermal environment were investigated using correlation analysis and piecewise linear regression. The urban heat island (UHI) was found to be much more significant in summer than in spring, autumn and winter. Furthermore, the magnitude of the urban thermal environment in Beijing has increased during the process of urbanization. The suburban areas of Beijing, including the new urban development zone and ecological conservation zone, have increased the magnitude of the thermal environment. However, the opposite effect has occurred in the center of Beijing, including the core functional zone and urban function extended zone. Landscape types such as built-up areas and barren land make the most significant contribution to the thermal environment, whereas ecological land plays a significant role in mitigating the UHI. When the coverage of ecological land exceeded 70% (25聽km 2 ) of the total land area, the cooling efficiency of this landscape type was relatively obvious, and the shape index and fragmentation index of landscape configuration both had a significantly positive correlation (0.594 and 0.510 Pearson's coefficients, respectively) with average land surface temperature. The Pearson's coefficient between the ecological land proportion and the average land surface temperature was 0.614 (P聽<聽0.01); this value was higher than that for the effects of the spatial configuration, indicating that landscape composition affects the thermal environment more than does spatial configuration.
|
| [45] |
Quantitative analysis of factors contributing to urban heat island intensity [J].https://doi.org/10.1175/JAMC-D-11-098.1 URL Magsci [本文引用: 1] 摘要
Abstract This study identifies causative factors of the urban heat island (UHI) and quantifies their relative contributions to the daytime and nighttime UHI intensities using a mesoscale atmospheric model that includes a single-layer urban canopy model. A midlatitude city and summertime conditions are considered. Three main causative factors are identified: anthropogenic heat, impervious surfaces, and three-dimensional (3D) urban geometry. Furthermore, the 3Durban geometry factor is subdivided into three subfactors: additional heat stored in vertical walls, radiation trapping, and wind speed reduction. To separate the contributions of the factors and interactions between the factors, a factor separation analysis is performed. In the daytime, the impervious surfaces contribute most to the UHI intensity. The anthropogenic heat contributes positively to the UHI intensity, whereas the 3D urban geometry contributes negatively. In the nighttime, the anthropogenic heat itself contributes most to the UHI intensity, although it interacts strongly with other factors. The factor that contributes the second most is the impervious-surfaces factor. The 3D urban geometry contributes positively to the nighttime UHI intensity. Among the 3Durban geometry subfactors, the additional heat stored in vertical walls contributes most to both the daytime and nighttime UHI intensities. Extensive sensitivity experiments to anthropogenic heat intensity and urban surface parameters show that the relative importance and ranking order of the contributions are similar to those in the control experiment.
|
| [46] |
Modeling and simulation of the Tokyo urban heat island [J].https://doi.org/10.1016/1352-2310(95)00489-0 URL [本文引用: 1] 摘要
Rapid progress in industrialization and urbanization has resulted in the concentration of economic growth and social functions in the urban areas. In most urban cities, it has become more and more certain that the increase of energy consumption is causing environmental problems including the temperature rise in the urban atmosphere (urban heat island) and air pollution. The present paper reports on the results of field observation and three-dimensional computer simulation of the urban heat island in the Tokyo metropolitan area. The three-dimensional governing equations for the urban atmospheric boundary layer were formulated by virtue of the vorticity-velocity vector potential method. Particular attention was focused on the representation of a buoyancy term in the equation of motion in the vertical direction, thereby describing the cross-over effect and stratified inversion layer near the ground surface. The vorticity-velocity potential method is superior from the viewpoint of numerical stability and suitable for the simulation of an urban heat island. A survey on the energy consumption was first made in the Tokyo metropolitan area. Next, these data were used for the three-dimensional simulations. In order to evaluate the validity of the present model to simulate the urban heat island, the simulation was carried out by initializing it with the same meteorological conditions as those used for the observation day. The simulation results were then compared with the field observation data for the surface temperature. Quite a good agreement was obtained between the present simulation and the observed data, thereby assuring the present model. Further future prediction of the urban heat island was performed for an energy release rate five times as much as the present rate, which corresponds to the year 2031 if the present consumption rate is maintained until then.
|
| [47] |
Study of landcover and population density influences on urban heat island in tropical cities by using remote sensing and GIS: A methodological consideration [ |
| [48] |
Satellite-measured growth of the urban heat island of Houston, Texas [J].https://doi.org/10.1016/S0034-4257(03)00007-5 URL [本文引用: 1] 摘要
Growth of the surface temperature urban heat island (UHI) of Houston, TX is determined by comparing two sets of heat island measurements taken 12 years apart. Individual heat island characteristics are calculated from radiative temperature maps obtained using the split-window infrared channels of the Advanced Very High Resolution Radiometer (AVHRR) on board National Oceanic and Atmospheric Administration polar-orbiting satellites. Eighty-two nighttime scenes taken between 1985 and 1987 are compared to 125 nighttime scenes taken between 1999 and 2001. Analysis of the UHI characteristics from these two intervals reveals a mean growth in magnitude of 0.8 K, or 35%. The growth of the mean area of the UHI is found to range between 170 and 650 km, or from 38% to 88%, depending on the method of analysis.
|
| [49] |
Cooling effects of wetlands in an urban region: The case of Bei-jing [J]. |
| [50] |
How can urban water bodies be designed for climate adaptation [J].https://doi.org/10.1016/j.landurbplan.2011.11.018 URL Magsci [本文引用: 1] 摘要
With rapid urbanization and population growth in Beijing, urban heat island (UHI) effects have become ever stronger. Methods for reducing the UHI effects by landscape design are becoming increasingly critical in urban planning studies. Water bodies form urban cooling islands (UCI) to mitigate the UHI effects. This study investigated the UCI intensity and efficiency of 197 water bodies in Beijing, and their relationships with four descriptors of microclimatic landscape design, including the water body area (WA), geometry (landscape shape index, LSI), location (DIST) in reference to a defined city center, and surrounding built-up proportion (PB). Data of land cover and land surface temperature (LST) were extracted from ASTER images of August 8 of 2007. The UCI intensity was defined as the maximum LST gradient outside a water body area, while the UCI efficiency was used to represent the UCI intensity per unit area of a water body. The results indicated that: (1) the mean UCI intensity and efficiency was 0.54 °C/hm and 1.76 °C/hm/ha, respectively; (2) the UCI intensity was positively correlated with WA and PB, and negatively correlated with LSI and DIST; and (3) the UCI efficiency was positively correlated with PB, and negatively correlated with WA, LSI and DIST. Results of this study may help urban planners and designers in decision making to achieve optimal urban landscape designs for a more ecologically sound and pleasant living environment.
|
| [51] |
Urban climates and heat islands: Albedo, evapotranspiration, and anthropogenic heat [J].https://doi.org/10.1016/S0378-7788(96)00999-1 URL [本文引用: 1] 摘要
As an introduction to this special issue on urban heat islands and cool communities, this paper reviews some of the characteristics of urban climates and the causes and effects of urban heat islands. In particular, the impacts of surface albedo, evapotranspiration, and anthropogenic heating on the near-surface climate are discussed. Numerical simulations and field measurements indicate that increasing albedo and vegetation cover can be effective in reducing the surface and air temperatures near the ground.
|
| [52] |
The synoptic climatology of Birmingham's urban heat island, 1965-74 [J].https://doi.org/10.1002/j.1477-8696.1980.tb03484.x URL [本文引用: 1] 摘要
ABSTRACT This presents the climatology of the urban heat island of Birmingham as revealed by a comparison of daily maximum and minimum temperatures at Edgbaston (city staton) and Elmdon (green field conditions), for the period 1965-74. On average, Edgbaston was 0.27K warmer than Elmdon, but this difference is entirely due to the +1.02K average difference in nocturnal minima. The difference in the minima were at their maximum in autumn and spring (+1.34K and 1.11K) and at a minimum in fore-winter. The nocturnal heat island effect is greatest under anticyclonic conditions, while the city-centre cold island effect is greatest under disturbed westerly and cyclonic weather types.- L.F.Musk
|
| [53] |
Thermal remote sensing of urban climates [J].https://doi.org/10.1016/S0034-4257(03)00079-8 URL [本文引用: 1] 摘要
Thermal remote sensing has been used over urban areas to assess the urban heat island, to perform land cover classifications and as input for models of urban surface atmosphere exchange. Here, we review the use of thermal remote sensing in the study of urban climates, focusing primarily on the urban heat island effect and progress made towards answering the methodological questions posed by Roth et al. [International Journal of Remote Sensing 10 (1989) 1699]. The review demonstrates that while some progress has been made, the thermal remote sensing of urban areas has been slow to advance beyond qualitative description of thermal patterns and simple correlations. Part of the difficulty lies in the tendency to use qualitatively based land use data to describe the urban surface rather than the use of more fundamental surface descriptors. Advances in the application of thermal remote sensing to natural and agricultural surfaces suggest insight into possible methods to advance techniques and capabilities over urban areas. Improvements in the spatial and spectral resolution of current and next-generation satellite-based sensors, in more detailed surface representations of urban surfaces and in the availability of low cost, high resolution portable thermal scanners are expected to allow progress in the application of urban thermal remote sensing to the study of the climate of urban areas.
|
| [54] |
Upstream urbanization exacerbates urban heat island effects [J]. |
| [55] |
Impact of upstream urbanization on the urban heat island effects along the Washington-Baltimore corridor [J].https://doi.org/10.1175/JAMC-D-10-05008.1 URL Magsci [本文引用: 1] 摘要
Although there has been considerable research on urban heat island (UHI) effects, most of the previous studies have attributed UHI effects to localized, surface processes. In this study, the impact of upstream urbanization on enhanced UHI effects is examined using surface observations and numerical simulations of an extreme UHI event that occurred on 9 July 2007 over Baltimore, Maryland. Under southwesterly wind, Baltimore experienced higher peak surface temperatures and higher pollution concentrations than did the larger urban area of Washington, D.C. Results from a coupled ultrahigh-resolution mesoscale-urban canopy model with 2001 National Land Cover Data show an advective contribution from upstream urbanization to the UHI event. This dynamical process is demonstrated by replacing Baltimore or its upstream urban areas by natural vegetation (in the model), indicating that the UHI effects could be reduced by as much as 25%. An analysis of the urban-bay interaction reveals the importance of horizontal wind direction in determining the intensity of bay breezes and the urban boundary layer structures. In addition, the vertical growth and structures of UHI effects are shown as layered "hot plumes" in the mixed layer with pronounced rising motions, and these plumes can be advected many kilometers downstream. These findings suggest that judicious land use and urban planning, especially in rapidly developing countries, could help to alleviate UHI consequences, including heat stress and smog. They also have important implications for improving the prediction of urban weather, including the initiation of moist convection, air quality, and other environment-related problems.
|

/
| 〈 |
|
〉 |
