石育中 , 王俊, 王子侨, 鲁大铭, 杨新军
西北大学城市与环境学院,西安 710127
SHI Yuzhong, WANG Jun, WANG Ziqiao, LU Daming, YANG Xinjun
通讯作者:
版权声明: 2017 地理科学进展 《地理科学进展》杂志 版权所有
基金资助:
作者简介:
作者简介:石育中,男,甘肃陇南人,博士生,从事人地耦合系统脆弱性与区域可持续发展研究,E-mail: syz19880919@126.com。
展开
摘要
干旱脆弱性及人类对干旱的适应机理分析是干旱及半干旱地区人地关系研究的重要内容,也是西北地区乡村人地系统可持续性研究的新视角。本文运用Turner脆弱性分析框架,将其改进应用到黄土高原乡村农户的干旱脆弱性及其适应领域,选取榆中县和长武县气象数据和农户调查数据,应用主成分分析、综合指数法、差异性分析和鲁棒性分析等方法分别对指标权重、农户干旱脆弱性指数及其差异性与脆弱性指数的不确定性进行分析与检验,并从适应能力、适应策略和适应模式三个层面揭示适应机理。主要结论为:①中连川乡农户干旱脆弱性指数大于洪家镇,且不同村落间农户干旱脆弱性指数差异显著;②农户干旱适应机理为暴露—敏感性影响农户收入,农户生计系统是适应干旱暴露扰动的决定因子,农户类型、生计方式、土地利用、灌溉设施和政策扶持的差异性产生不同的适应模式和适应效果;③农户干旱脆弱性指数排名出现频率较高且排名变化范围较小,具有较强的鲁棒性,表明农户干旱脆弱性计算结果具有稳健性。
关键词:
Abstract
Analyzing vulnerability and adaptation to drought is an important part of the study on human-environment relationship in arid and semiarid regions. It has also become the new viewpoint of human-environment system sustainability research in the rural areas of northwestern China. This research adopted the framework of vulnerability analysis proposed by Turner and adapted it for analyzing rural household vulnerability and adaptation to drought on the Loess Plateau. It integrated and analyzed meteorological data and questionnaire survey to examine household drought vulnerability and difference and inspected the uncertainty of the results applying Principal Component Analysis, Difference Analysis, and Robustness Analysis methods. This study also revealed the mechanism of adaptation to drought with regard to adaptive capacity, adaptation strategies, and adaptation mode. The main results include: (1) there exist significant differences between the villages in drought vulnerability index values—the vulnerability value of Zhonglianchuan is higher than that of Hongjia; (2) with regard to adaptation mechanism, exposure-sensitivity influences farmer income, farmer livelihood system determinates adaptive capacity, and differences in the type of household, livelihood strategy, land use, irrigation facilities, and policy support generate different adaptation modes and consequence; (3) the high frequency and narrow range of household drought vulnerability index indicates relatively high robustness of the result.
Keywords:
随着全球变暖,干旱区面积及干旱发生率逐步增加,严重威胁着人类赖以生存的粮食、水资源和生态环境,对人地耦合系统可持续性产生巨大影响(程静等, 2010; 何斌等, 2010; 高超等, 2012; Wu et al, 2013; 邱海军等, 2013)。人地耦合系统脆弱性研究作为未来地理科学研究领域的十大科学研究命题之一,已逐渐成为人地关系研究和区域可持续发展较为重要的科学知识体系,而干旱脆弱性研究作为研究人地耦合系统脆弱性的最新热点内容,在地理学领域已引起广泛关注(高超等, 2012; Tánago et al, 2016)。干旱脆弱性是人地系统中自然、社会与经济多重要素遭受干旱扰动而影响人地系统应对干旱能力的状态,是理解人地耦合系统对干旱在何时(When)脆弱,为何(Why)脆弱,如何(How)做和做什么(What)可降低脆弱的重要途径(Naumann et al, 2013; Tánago et al, 2016; Thomas et al, 2016)。干旱脆弱性评价逐渐成为制定干旱减缓和预防政策的首要环节(Derbile, 2013),旨在减缓、预备和提前预警干旱以将受影响程度降至最低。
随着干旱脆弱性研究的不断深入,诸多学者开始关注干旱对乡村人地系统的胁迫与影响,农户作为该系统中最主要的经济活动主体以及自然资源利用的最直接单元,已成为干旱扰动的最直接承受者,干旱对其生计造成的影响尤为严重(Wittrock et al, 2011; Ashraf et al, 2014),并将农户干旱脆弱性定义为:农户因各种自然与社会经济因素制约造成的易于遭受旱灾损失和影响的属性,是乡村人类—环境耦合系统交互影响的结果。脆弱程度的变化受到自然环境、气候环境与社会经济因素的综合影响(Ashraf et al, 2014; Lei et al, 2014)。西北黄土高原地区乡村经济主要依赖雨养农业,且农户集依赖型生计方式、高密度贫困集聚区与低适应能力于一身,干旱导致地表水和地下水锐减,从而影响农业种植业和生产效率,对农户生计安全形成巨大挑战,影响乡村人地系统的可持续发展(鲍超等, 2008; 李芬等, 2011; Ashraf et al, 2014)。就农户干旱脆弱性研究进展而言,国外学者已在不同发展中国家乡村人地系统开展相关研究(Lindoso et al, 2014; Fang et al, 2016; Hung et al, 2016),而国内农户干旱脆弱性研究还处于起步阶段,基于农户尺度的干旱脆弱性研究更是屈指可数。
纵观农户干旱脆弱性研究,主要存在以下问题:脆弱性分析框架与指标体系不够统一;标准化和指标权重赋值方法多样,导致干旱脆弱性结果具有不确定性;重视干旱脆弱性空间分异而忽视其内部作用机制与内部要素的变化(Wu et al, 2013)。此外,脆弱性分析框架无法深入解释社会经济系统如何适应和缓解外部扰动的影响,而“适应”力图分析系统适应变化及抵抗干扰的能力,逐渐成为推动社会经济系统可持续发展的一种新理念(郭永锐等, 2015)。针对以上问题,本文选择位于陕甘黄土高原西部和南部的榆中县中连川乡和长武县洪家镇作为研究区,试图将Turner的脆弱性分析框架运用到农户尺度,应用综合指数法对农户干旱脆弱性加以量化;运用鲁棒性分析对由数据标准化方法、权重赋值及脆弱性计算公式差异产生的不确定性结果进行检验;通过对农户适应能力和适应机制的剖析,深入理解农户对干旱的脆弱性及其存在的差异;通过对脆弱性结果的不确定性分析而完善脆弱性评价的框架,厘清和理解脆弱性与适应能力在农户尺度的相互关系,为人地理耦合系统脆弱性理论的深化提供新的思路,并为黄土高原干旱-半干旱区制定干旱适应及旱灾减灾防灾政策和精准扶贫提供理论依据与借鉴。
陕西省长武县洪家镇地处黄土高原南部丘陵沟壑区(图1),为暖温带半湿润大陆性气候,年均气温9.4℃,年均降水量597.5 mm(图2),多集中在7-9月且年变率大,多年平均无霜期为171天,复种指数一般达115%。该镇是一个生态脆弱、人类活动强度高的生态经济复合区域,其农业经济的产业基础是苹果种植业(蒋维等, 2011)。甘肃省榆中县中连川乡地处陇中黄土高原丘陵区,总面积228 km2,全乡地势西高东低,平均海拔2344 m,年降水量387.8 mm,年均气温6.9℃(图2),蒸发量高达1450 mm,全年无霜期148天,属典型的半干旱气候。该乡是甘肃省最贫困的山区乡镇之一,为旱地雨养农业,主要农作物有玉米、马铃薯、小麦等(杨新军等, 2015)。
图1 研究区与调研村地理位置①① 研究区与调研村位置图中数据DEM数据源自地理数据云平台,空间分辨率30 m。
Fig.1 Location of the study area and the survey villages
图2 榆中县与长武县气候指标对比
Fig.2 Meteorological condition of Yuzhong County and Changwu County
选择位于陕甘黄土高原西部和南部的榆中县中连川乡和长武县洪家镇作为研究区,其典型性在于干旱缺水一直是黄土高原地区人地系统最主要的外部干扰因素,先天脆弱的自然生态系统与人类长期不合理的活动叠加导致生态环境恶化和农民贫困问题突出(马琼等, 2014)。洪家镇和中连川乡分别位于黄土高原南部和中部,均为国家级贫困县和生态脆弱区,共同遭受干旱的胁迫,而且1960-2015年间,年平均降雨量和年最长连续为降水天数变化波动较大(图2),严重影响苹果产业和粮食作物的产量,使得农户生计安全面临重大威胁。由于乡村人地系统对干旱的脆弱性和适应能力存在地理差异性(Naumann et al, 2013; Lei et al, 2014),洪家镇和中连川乡在干旱程度、经济结构、基础设施和灌溉条件存在差异,导致农户干旱脆弱的程度、适应能力、适应策略及适应机理也不相同。本文试图识别黄土高原乡村人地系统对干旱的脆弱状态,揭示黄土高原乡村人地系统脆弱性的异质性,并探索农户对干旱的适应机理,为黄土高原乡村的可持续发展与政策制定提供理论依据。
本文数据包括气象数据和调查问卷数据两部分。其中,气象数据源自中国气象科学数据共享服务网,主要包括长武县与榆中县气象站点1960-2015年间的降水量和气温数据,由于洪家镇与中连川乡未设立气象监测站点,因此采用长武县与榆中县站点气象数据进行替代。
调查问卷数据源自实地调研,调查问卷的设计以已有研究成果为依据,借鉴课题组在研究区的前期实地调研经验②(②洪家镇和连川乡的问卷调查是在课题组前期调研的基础上,针对研究主题进行再研究再设计。洪家镇和连川乡的前期实地调查时间分别为2007年8月和2012年8月。),设计农户访谈问卷。实地调研于2014年8月分别对洪家镇和中连川乡的现场调研,分别采取系统采样和随机抽样乡对21个村③(③21个村由洪家镇12个行政村和中连川乡9个村(行政村+自然村)组成,其中,中连川乡选择行政村+自然村的原因在于海拔较高(2343 m),地形复杂,村落间相隔较远,人口稀少,调研难度较大,而且行政村多以小型规模为主,行政村和自然村人口差别较小。)进行入户访谈,通过与其进行半结构式访谈获得的第一手数据,回收问卷419份,获得有效问卷387份,有效问卷率为92.4%,其中,长武县洪家镇调研12个村,回收问卷294份,获得有效问卷273份,有效问卷率为92.9%;中连川乡由于受地形影响,农户居住分散,访谈难度较大,实地调研9个村,回收问卷125份,获得有效问卷114份,有效问卷率为91.2%。调查内容包括:①家庭基本信息。包括家庭人数、职业、教育程度、劳动力等;②自然资本。包含耕地面积、粮食产量、养殖规模等;③物质资本。包含住房质量,家电数量,电话数量,与道路的距离等;④社会资本。包含家庭成员或亲属中可借款人数及身份,邻里关系及信任程度、信贷途径、社会扶助次数等;⑤金融资本。包含家庭人均收入、家庭存款、生计多样性等。
2.3.1 研究框架的选择
Turner提出的人—环境耦合系统脆弱性分析框架(图3),包含人文条件与环境条件及其相互作用背景下暴露、敏感性和恢复力三方面的内容,并从全球、区域和地方三个尺度分析要素之间的相互作用关系,其中,人—环境耦合系统的人文—环境条件(生物物理资本和社会资本)决定暴露度和敏感性并影响系统的应对机制(Turner et al, 2003; 黄晓军等, 2014)。由于人地系统脆弱性研究主要集中在全球、国家和区域尺度,鲜有微观尺度的研究,亟需从全球和国家等宏观尺度转向地方尺度进行“自上而下”的深入研究,而乡村人地系统则是地方尺度最基础的研究单元 (Lei et al, 2014; Fang et al, 2016)。
图3 农户干旱脆弱性分析框架
Fig.3 Framework of rural household drought vulnerability assessment
因此,本文以Turner的人—环境耦合系统脆弱性分析框架为基础,选择乡村人地系统基本单元中的农户作为调查和分析对象,以干旱为扰动因素,从暴露、敏感性、恢复力来表征农户干旱脆弱性。由于框架中恢复力内涵在不同地理尺度存在差异,因此在农户尺度需要结合地方特点加以改进,具体改进如下:①Turner认为对外部扰动的应对/响应主要依赖于项目基础、政策和自主选择;然而就农户而言,对外部扰动恢复强弱取决于五大资本的禀赋(Turner et al, 2003; 黄晓军等, 2014);适应能力作为恢复力的重要内容,可结合暴露、敏感性进行脆弱性的量化评价。②就影响/响应而言,Turner认为主要的影响是生命丧失、经济产出、土壤和生态系统服务,除经济产出外,其他指标数据难以获取,因此不作讨论。③就调节与适应/响应而言,Turner认为可通过引进新的项目、政策和自主选择来调节和适应,而对于不同地区,调节和适应存在差异性(Naumann et al, 2013; Lei et al, 2014),从而造成农户的适应策略和模式存在差异。因此,农户尺度的恢复力包含适应能力、适应策略和适应模式三方面内容。
2.3.2 农户干旱脆弱性指标体系的构建
基于文献和实地调研情况,从暴露、敏感性和适应能力三个维度进行构建农户干旱脆弱性指标体系。具体构建过程如下:
暴露(Exposure)是气候条件变化对研究单元造成的压力,可用气候变化特征与气候变化程度如气温、降水等指标表征(Gbetibouo et al, 2009)。选择年平均降水量、最长连续未降水时间和平均年气温来描述干旱的暴露特征,年平均降水量和最长连续未降水时间决定暴露的威胁程度;而平均年气温的变化能表征干旱的压力(Ashraf et al, 2014)。
敏感性(Sensitivity)是气候事件(Climate Event)和社会经济系统相互作用的结果,用于表征系统对扰动的敏感性(Susceptibility)(Fang et al, 2016)。选择从事农业人数、畜果蔬收入比例、是否为雨养农业、水资源获取途径和粮食产量衡量敏感性,干旱直接影响农业产量,决定着农业类型和水资源的获取途径(Eakin et al, 2008; Fang et al, 2016; Hung et al, 2016)。
适应能力(Adaptive Capacity)是系统对气候环境扰动的适应(Accommodate)和恢复(Recover)能力,在农户尺度以物质资本、自然资本、金融资本、社会资本和人力资本来表征。其中,物质资本选择住房类型、家庭手机数量、与道路的距离、灌溉面积;自然资本选择粮食种植面积、经济林种植面积、果蔬种植面积;金融资本选择家庭人均收入、存款、生计多样性、牲畜禽的数量;社会资本选择社会网络、信贷途径、社会扶助;人力资本选择最高学历、依赖比例、培训次数(Eakin et al, 2008; Fang et al, 2016; Hung et al, 2016)。
2.3.3 指标标准化方法
选择四分位距(Interquartile Range)的方法进行指标的标准化(Perch-Nielsen, 2010),计算公式如下:
式中:
2.3.4 农户干旱脆弱性指数
农户干旱脆弱性指数由暴露指数、敏感性指数和适应能力指数组成,但是脆弱性计算存在不同计算公式,IPCC采用的脆弱性计算公式V=E+S-AC受到广泛引用(Piya et al, 2016),因而,选择IPCC提出的脆弱性计算方法;而暴露指数、敏感性指数和适应能力指数由指标标准化值与权重计算获得,指标权重的确定选择主成分分析法。与传统的取相同权重的方法相比,主成分分析可通过统计学流程实现指标降维,更适用于指标权重赋值,在脆弱性的研究中是确定指标权重较为客观的方法之一(Ashraf et al, 2014),具体选取主成分的方差贡献率为权数(刘卫东等, 2009)(表1)。其中,暴露指数提取年平均降水1个主成分,累计贡献率为78%④(④一般认为,主成分分析累计贡献率大于60%具备解释力,累计贡献率大于85%则说明解释力较强。);敏感性指数提取粮食产量、获取水资源的途径1个主成分,累计贡献率为69%;适应能力指数指标较多,指标共线性较强,通过指标组合的优化,选择提取存款、生计多样性、社会网络3个主成分,累计贡献率为73%,具体计算公式如下:
式中:FDV为农户干旱脆弱性指数;
表1 农户干旱脆弱性指标体系
Tab.1 Indicator system of rural household drought vulnerability assessment
| 维度 | 初始指标层 | 优化指标层 | 权重 | ||
|---|---|---|---|---|---|
| 脆弱性 | 暴露 | 年平均降水 年最长连续未降水天数 年平均气温 | 年平均降水 年最长连续未降水天数 年平均气温 | 0.63 0.61 0.48 | |
| 敏感性 | 粮食产量 畜果蔬收入比例 获取水资源的途径 是否为雨养农业 | 粮食产量 畜果蔬收入比例 获取水资源的途径 | 0.59 0.50 -0.64 | ||
| 适应能力 | 物质资本 | 住房条件、家庭手机数量、与道路的距离 | 住房类型 最高学历 存款 生计多样性 社会网络 | 0.28 -0.20 0.22 0.38 0.19 | |
| 自然资本 | 粮食种植面积、经济林种植面积、果蔬种植面积、灌溉面积 | ||||
| 人力资本 | 最高学历、依赖比例、培训次数 | ||||
| 金融资本 | 家庭人均收入、存款、生计多样性、牲畜禽的数量 | ||||
| 社会资本 | 社会网络、信贷途径、社会扶助 | ||||
2.3.5 农户干旱脆弱性指数鲁棒性分析
鲁棒性分析是标准化方法、权重方法和综合指数计算公式发生变化的情况下能维持综合指数值和排名稳定的方法,是针对综合指标构建过程中的主观选择避免结果不确定性的分析工具,有利于提高综合指数的透明度与可信度(Kondyli, 2010; Singh et al, 2012)。因此,基于本文采用的标准化方法、指标权重赋值方法和农户干旱脆弱性指数计算方法,另外选择Z-score标准化方法,比例法(Scaling)、等权重法(Equal Weight)权重赋值方法,对2种农户干旱脆弱性指数的计算方法进行鲁棒性分析,共计2种标准化方法,3种权重赋值方法,3种农户脆弱性指数计算方法,最终产生18种不同村落农户干旱脆弱性指数结果,以此来检验结果的稳定性。标准化方法和农户干旱脆弱性指数计算公式如下,其中公式变量如式(1)和式(5)所示:
式中:
通过模型计算,研究区农户干旱脆弱性值变化范围为[-1.327,4.031](表2),变化幅度较大,洪家镇农户干旱脆弱性指数小于中连川乡,其中,洪家镇风口村农户干旱脆弱性指数为-1.327,干旱脆弱性最低,中连川乡撒拉沟农户干旱脆弱性指数为4.031,干旱脆弱性最高。在上述两乡镇内部各村差异也较大。如洪家镇在风口村农户干旱脆弱性指数最低的同时,山兴村农户干旱脆弱性指数达-0.549,干旱脆弱性最高;中连川乡在撒拉沟村农户干旱脆弱性指数最高的同时,康家窑村农户干旱脆弱性指数仅为-0.597,干旱脆弱性最低。
表2 不同村落农户干旱脆弱性指数及其排名
Tab.2 Results and ranking of rural household drought vulnerability in different villages
| 村名 | E | S | AC | V | Rv | 村名 | E | S | AC | V | Rv |
|---|---|---|---|---|---|---|---|---|---|---|---|
| 风口村洪 | 0.556 | -1.453 | 0.430 | -1.327 | 1 | 山兴村洪 | 0.556 | -0.990 | 0.115 | -0.549 | 12 |
| 关路村洪 | 0.556 | -1.400 | 0.374 | -1.218 | 2 | 康家窑中 | -0.513 | -0.229 | -0.145 | -0.597 | 13 |
| 回朝村洪 | 0.556 | -1.348 | 0.417 | -1.209 | 3 | 西翻岔中 | -0.513 | 0.169 | 0.001 | -0.345 | 14 |
| 王东村洪 | 0.556 | -1.404 | 0.350 | -1.198 | 4 | 鞑靼窑中 | -0.513 | 1.286 | -0.556 | 1.329 | 15 |
| 公主村洪 | 0.556 | -1.351 | 0.322 | -1.117 | 5 | 高窑沟中 | -0.513 | 1.975 | -0.913 | 2.375 | 16 |
| 上柳村洪 | 0.556 | -1.402 | 0.231 | -1.077 | 6 | 满都沟中 | -0.513 | 2.931 | -0.307 | 2.725 | 17 |
| 庄里村洪 | 0.556 | -1.407 | 0.132 | -0.983 | 7 | 张家圈中 | -0.513 | 2.346 | -0.952 | 2.785 | 18 |
| 姜曹村洪 | 0.556 | -1.425 | 0.102 | -0.971 | 8 | 坟固湾中 | -0.513 | 3.136 | -0.541 | 3.164 | 19 |
| 孔头村洪 | 0.556 | -1.357 | 0.156 | -0.957 | 9 | 细岭子中 | -0.513 | 3.519 | -0.488 | 3.494 | 20 |
| 下柳村洪 | 0.556 | -1.359 | 0.057 | -0.860 | 10 | 撒拉沟中 | -0.513 | 3.949 | -0.595 | 4.031 | 21 |
| 曹公村洪 | 0.556 | -1.261 | -0.072 | -0.633 | 11 |
就暴露而言,洪家镇村庄干旱暴露指数为0.556,中连川乡干旱暴露指数为-0.513,洪家镇高于中连川乡;就敏感性而言,洪家镇干旱敏感性指数为-1.346,中连川乡2.120,中连川乡高于洪家镇。其原因在于人地耦合系统的地理环境决定着敏感性,相比洪家镇而言,中连川乡地形复杂,且海拔较高,耕地资源丰富,农业用水仅靠自然降水,为典型的雨养农业,干旱的产生直接影响农业产量,造成农业收入的损失;就适应能力指数而言,洪家镇适应能力指数0.218,中连川乡适应能力指数-0.500,洪家镇高于中连川乡,家庭资本尤其是金融资本成为洪家镇高于中连川乡的核心因素。
在农户干旱脆弱性差异性方面(表3),就暴露而言,方差检验和t检验Sig.值分别为0.044和0.000,小于0.05,方差差异与均值差异显著;就敏感性而言,方差检验和t检验Sig.值均为0.000小于0.05,方差差异与均值差异显著;就适应能力而言,方差检验Sig.值为0.121,大于0.05,不存在方差差异,t检验Sig.值为0.000,小于0.05,均值差异显著;就脆弱性而言,方差检验和t检验Sig.值均为0.000,方差差异与均值差异显著。
表3 农户干旱脆弱性差异性分析结果
Tab.3 Results of difference analysis of rural household drought vulnerability
| 方差方程的Levene检验 | 均值方程的t检验 | ||||||
|---|---|---|---|---|---|---|---|
| F | Sig. | t | df | Sig. | 均值差值 | 标准误差值 | |
| E 假设方差相等 假设方差不相等 | 4.63 | 0.04 | 72.04 61.83 | 19.00 8.00 | 0.00 0.00 | 1.07 1.07 | 0.00 0.00 |
| S 假设方差相等 假设方差不相等 | 24.65 | 0.00 | -8.25 -7.10 | 19.00 8.08 | 0.00 0.00 | -3.47 -3.47 | 0.42 0.49 |
| AC 假设方差相等 假设方差不相等 | 2.64 | 0.12 | 6.81 6.22 | 19.00 11.07 | 0.00 0.00 | 0.72 0.72 | 0.11 0.12 |
| V 假设方差相等 假设方差不相等 | 20.48 | 0.00 | -6.54 -5.65 | 19.00 8.25 | 0.00 0.00 | -3.12 -3.12 | 0.48 0.55 |
为揭示农户遭受干旱暴露产生的敏感性与适应能力的变化,以Perch-Nielse(2010)提出的暴露—敏感性&适应能力坐标系为依据,以暴露算数平均值作为横坐标,以敏感性&适应能力算数平均值为纵坐标,建立暴露—敏感性&适应能力坐标系,如图4所示。21个调研村分布于三个象限,分别为低暴露—低敏感性&适应能力、低暴露—高敏感性&适应能力、高暴露—高敏感性&适应能力。属于低暴露—低敏感性&适应能力类型的村庄分别为细岭子村和撒拉沟村,该类型村庄典型特征为:当干旱暴露程度较低时,与其他村庄相比,其自身适应能力较低;属于低暴露—高敏感性&适应能力类型的村庄分别为西翻岔村、鞑靼窑村、高窑沟村、张家圈村、满都沟村、坟固湾村,该类型村庄典型特征为:当干旱暴露程度较低时,与其他村庄相比,其适应能力适中,因而干旱脆弱性适中;属于高暴露—高敏感性&适应能力类型的村庄分别为康家窑村、风口村、山兴村、关路村、回朝村、王东村、公主村、上柳村、庄里村、姜曹村、孔头村、下柳村、曹公村,该类型村庄典型特征为:当干旱暴露程度较高时,与其他村庄相比,其具有更高的适应能力,以致干旱脆弱性低。就乡镇而言,中连川乡乡村属于低暴露—低敏感性&适应能力和低暴露—高敏感性&适应能力两种类型,呈现“低暴露—低(高)敏感性&适应能力—高(中)脆弱性”的特征,洪家镇乡村属于高暴露—高敏感性&适应能力类型,整体呈现“低暴露—高敏感性&适应能力—低脆弱性”的特征。
图4 不同村落农户干旱脆弱性类型
Fig.4 Types of rural household drought vulnerabilityin different villages
农户干旱恢复力是乡村人地系统在受到干旱扰动时能承受和维持系统仍处于稳定或预期状态的能力,蕴含在干旱条件变化情况下适应能力和对干旱的适应(Turner et al, 2003),作为恢复力的关键因素,适应能力决定着农户适应模式和适应效果的差异(喻忠磊等, 2013)。
3.3.1 农户干旱适应能力及差异性分析
洪家镇农户干旱适应能力指数平均值为0.218,中连川乡农户干旱适应能力指数平均值为-0.500,洪家镇农户干旱适应能力指数大于中连川乡。其中,洪家镇风口村适应能力指数为0.430,适应能力最高;中连川乡张家圈适应能力指数为-0.952,适应能力最低(表2)。就适应能力指标而言,如图5和表4所示,在住房类型方面,方差检验和t检验Sig.值分别为0.071和0.300,大于0.05,不存在方差差异与均值差异,说明住房类型不存在差异;在最高学历方面,方差检验Sig.值为0.106,大于0.05,不存在方差差异,t检验Sig.值为0.009,小于0.05,均值差异显著,说明最高学历存在均值差异。
表4 适应能力差异分析结果
Tab.4 Result of difference analysis of adaptive capacity
| 方差方程的Levene检验 | 均值方程的t检验 | ||||||
|---|---|---|---|---|---|---|---|
| F | Sig. | t | df | Sig. | 均值差值 | 标准误差值 | |
| B 假设方差相等 假设方差不相等 | 3.651 | 0.071 | 1.065 0.939 | 19 9.155 | 0.300 0.372 | 0.313 0.313 | 0.029 0.033 |
| E 假设方差相等 假设方差不相等 | 2.878 | 0.106 | 2.928 2.666 | 19 10.828 | 0.009 0.022 | 0.257 0.257 | 0.088 0.096 |
| S 假设方差相等 假设方差不相等 | 0.095 | 0.762 | 6.372 6.030 | 19 13.358 | 0.000 0.000 | 0.383 0.383 | 0.060 0.064 |
| L 假设方差相等 假设方差不相等 | 17.223 | 0.001 | 7.885 6.788 | 19 8.111 | 0.000 0.000 | 0.368 0.368 | 0.047 0.054 |
| SN 假设方差相等 假设方差不相等 | 0.115 | 0.738 | 0.533 0.542 | 19 18.379 | 0.600 0.594 | 0.020 0.020 | 0.037 0.036 |
在存款方面,方差检验Sig.值为0.762,大于0.05,不存在方差差异,t检验Sig.值为0.000,小于0.05,均值差异显著,说明存款存在均值差异;在生计多样性方面,方差检验和t检验Sig.值分别为0.001和0.000,小于0.05,方差差异与均值差异显著,说明生计多样性存在方差和均值差异;在社会网络方面,方差检验和t检验Sig.值分别为0.738和0.600,大于0.05,方差差异和均值差异不显著,说明社会网络差异不显著。
3.3.2 农户干旱适应机理
干旱特征的差异(频率、强度和持续时间)直接影响暴露的程度。对于农户而言(图6),农业生态系统首当其冲受到直接影响,导致系统当前状态或预期状态受到扰动而发生改变。根据实地调研显示,干旱频率、强度和持续时间的增加,干旱加剧,并导致农作物种植结构和种植时间发生改变,农业投入、农业管理和农业活动相对减少,引致农业产量和价格的波动,进而引起农户收入和生计系统(农户家庭生计和农业生计)的改变。面对这种改变,农户从中恢复的程度取决于适应能力即农户生计,五种资本的禀赋决定着农户应对扰动的内在能力,结合农业生计外部因素(如家庭主要农业劳动力从事农业时间及经验、农业设施、农业技术、农业投入和市场渠道的扩展等方面),减缓和消除干旱扰动的影响。
然而,从事不同农业活动的农户在制定适应决策方面存在差异,具体差异体现在农户生计方式、土地利用、农作物种植结构与时间和地方政策扶持。根据实地调查发现,中连川乡以传统农业种植(玉米、土豆、胡麻、大豆、中药材)为主,生计来源主要依靠青年劳动力外出打工和中年劳动力半工半农两种途径,在干旱年主要通过改变农作物种植时间和抗旱品种应对,对于家庭劳动力不足、耕地资源较多的农户,选择将耕地外包出租,偏远或山坡地选择撂荒;在政策扶持方面,地方政府对玉米和土豆执行受灾保险政策,同时设立集水工程和地膜补贴,并开设农业技术培训(学习能力)来提高农户缓解农业干旱的能力,然而由于年平均降水量较少,农户普遍通过自建水窖(自组织)的方式增加需水量,但也只能满足生活用水,形成了收缩型的适应模式。与中连川乡不同,洪家镇以大面积苹果种植为主,生计来源主要依靠青年劳动力外出打工和中年劳动力种植苹果两种途径,土地利用的转变主要发生在耕地少劳动力多和耕地较多劳动力多的家庭,以租入的方式将耕地多劳动力少的家庭荒地转换成自身自然资本,出租地的家庭以青年劳动力外出打工和中年在剩余耕地中种植苹果,在政策扶持方面,地方政府同样执行受灾保险政策,同时设立机井和农业补贴,并开展农业技术培(学习能力)来提高缓解农业干扰的能力,由于洪家镇相比中连川乡年平均降水较多,正常年份年平均降水基本能满足生活和农业用水,而在干旱年份,农户通过在自建机井或集资建机井(自组织)来满足农业用水,形成了调节型的适应模式。
因此,结合实地调研的实际情况,暴露—敏感性是影响农户收入的直接因素;农户生计系统(农户家庭生计系统和农业生计系统)是适应干旱暴露扰动的决定因子;农户类型、生计方式、土地利用、灌溉设施和政策扶持的差异性产生不同的适应模式和适应效果。
如图7所示,通过排名出现的频率和变化范围构建排名频率—变化范围矩阵,排名出现的频率越高,网格颜色越深,排名变化范围越小,该排名的鲁棒性越强。就出现频率而言,排名对角线的网格颜色较深,说明整体该排名出现频率较高,排名出现频率达10次及10次以上的有风口村、满都沟、张家圈、坟固湾、细岭子、撒拉沟;就排名范围而言,排名范围平均值为6.810,排名范围变化较小,排名变化范围小于平均值的有关路村、王东村、公主村、姜曹村、孔头村、下柳村、鞑靼窑、高窑沟、满都沟、张家圈、坟固湾,其中公主村、鞑靼窑、张家圈、坟固湾排名变化范围最小,均为3。为更好地显示调研村农户干旱脆弱性排名的集散情况,运用Origin9.0软件,描绘它们的排名箱形图。如图8所示,除西翻岔之外,其他调研村农户干旱脆弱性排名四分位距较小,同时趋于集中分布,进一步说明各调研村排名具有较强的稳健性。
图7 不同村落农户干旱脆弱性指数鲁棒性分析结果
Fig.7 Result of robustness analysis of rural household drought vulnerability in different villages
图8 不同村落农户干旱脆弱性排名频率—变化范围矩阵
Fig.8 Frequency-range matrix of rural household drought vulnerability ranking in different villages
(1) 研究样本区农户干旱脆弱性指数变化幅度较大。其中,中连川乡农户干旱脆弱性指数大于洪家镇,且差异显著,原因为暴露指数、敏感性指数和适应能力指数均存在显著差异。(2) 通过暴露—敏感性&适应能力构建坐标系,将21个调研村分为低暴露—低敏感性&适应能力、低暴露—高敏感性&适应能力、高暴露—高敏感性&适应能力三种类型;处于三种类型村庄数量由高到低依次为:高暴露—高敏感性&适应能力>低暴露—高敏感性&适应能力>低暴露—低敏感性&适应能力。(3) 就适应能力指标而言,生计多样性、最高学历和存款存在显著差异,住房类型和社会网络不存在差异。(4) 农户干旱适应机理为暴露—敏感性是影响农户收入的直接因素;农户生计系统是适应干旱暴露扰动的决定因子;农户类型、生计方式、土地利用、灌溉设施和政策扶持的差异性产生不同的适应模式和适应效果。(5) 农户干旱脆弱性指数排名频率—变化范围矩阵对角线网格颜色较深,排名出现频率较高且排名变化范围较小,农户干旱脆弱性指数结果具有较强的鲁棒性。
未来的农业与乡村地理学研究将越来越注重研究尺度的外扩与内敛。外扩主要表现在对一些宏观问题或巨型系统的探究,如乡村对全球变化导致的粮食安全、能源安全以及生物多样性变化等问题的响应,内敛则主要是指研究尺度的不断细化,如:乡村社区对环境不确定性的顺应能力(龙花楼等, 2014),这与脆弱性的相关研究相契合。从全球、国家尺度向地方尺度进行自上而下开展脆弱性研究被视为一个重要的挑战(Fang et al, 2016),农户干旱脆弱性的研究是一次探索式的尝试。
(1) 农户干旱脆弱性取决于生物物理环境系统(Bio-physical System)与人类系统的交互影响,更取决于暴露的程度、敏感性及农户的适应能力。乡村尺度干旱脆弱性对比分析可以揭示不同区位暴露在经历长时间的气候变化和自然灾害条件下对其脆弱程度的差异,对于不同地理区位的农户而言,农户脆弱的程度取决于适应能力(Ashraf et al, 2014),暴露越高,敏感性越高,适应能力越低意味着脆弱性越高,反之脆弱性越低。
作为脆弱性的重要组成要素之一,适应能力是与政策实施紧密相关的,提高适应能力可降低农户对干旱的敏感性。影响乡村适应能力的因素可以归结为以下两点:一是与机构管理有关,二是与自身相关。在机构管理方面,机构对于地方、区域和国家在干旱环境下的农业重构至关重要,因为机构通过产权、税收、教育和信息影响资源的利用。此外,乡村的适应能力还与人口、人口依赖类型、经济地位相关(Lei et al, 2014)。除自身条件外,有效的适应策略对降低脆弱性至关重要。如通过改善灌溉设施,加强水资源管理降低农作物对干旱的敏感性;增加非农收入,丰富生计多样性,缩减经济支出以降低对自然资源生计的依赖性,进而减少对气候变化和极端天气的敏感性(王亚茹等, 2016)。
(2) 干旱脆弱性在全球变化领域和自然灾害领域取得突出进展。在全球变化领域,在农户尺度干旱程度(Severity)、强度(Intensity)和持续时间(Duration)对农户生计的影响(Li et al, 2013; Udmale et al, 2015; Khayyati et al, 2016; Merritt et al, 2016)。在自然灾害领域,运用恢复力思维构建灾害恢复力(Disaster Resilience),加强灾害风险管理(Hiete et al, 2012; Alshehri et al, 2015; Imperiale et al, 2016)。其中,Lei等(2014)采用“冲击-损害-恢复-学习”循环提出自然灾害风险管理框架,以解释自然灾害在人类—自然复杂系统的交互过程;在时间尺度上,将自然灾害划分为灾前(Pre-)、灾中(In-)、灾后(Post-)3个时间段,认为恢复力是系统能维持和在短时间内接受小规模救助或不接受救助的情况下从灾害损失中恢复的能力,接受小规模救助或不接受借助有利于受灾农户主动应对干旱,降低农业干旱脆弱性,缩短干旱损失的恢复时间,维持乡村社会—生态系统的可持续性,从脆弱性和恢复力的视角为乡村人地系统脆弱性研究提供了新的视角。
(3) 脆弱性研究框架现仍存在不足之处,如权重的确定方法和结果的不确定性。脆弱性框架的权重赋值方法以等权重为主(de Grosbois et al, 2015; Ryu et al, 2016),另外还有比例法、AHP等方法(Liu et al, 2013; Aryal et al, 2014),但诸多学者认为以上权重赋值方法具有武断和主观性太强的弊端,因此具有统计学意义的赋值方法越来越受到关注和运用,如主成分分析和模糊层次分析法FAHP(Fuzzy Analytical Hierarchy Process,简称FAHP)等(Bizimana et al, 2015; Şener et al, 2015)。此外,指标依赖性综合指数的结果受标准化方法、权重赋值方法和综合指数计算方法的影响,使得计算结果具有不确定性。脆弱性指数的不确定性已经受到关注,运用不确定评价(Uncertainty Assessment)、鲁棒性分析(Robustness Analysis)、不确定与敏感性分析(Uncertainty and Sensitivity Analysis)进行结果检验,增强综合指数的科学性和可信性(Brooks et al, 2005; Saisana et al, 2005; Tate, 2012; Harrison et al, 2015)。
The authors have declared that no competing interests exist.
| [1] |
干旱区水资源开发利用对生态环境影响的研究进展与展望 [J].https://doi.org/10.11820/dlkxjz.2008.03.006 Magsci [本文引用: 1] 摘要
<p>水资源是干旱区生态环境最主要的限制性因子和重要组成部分。干旱区人口和经济规模的膨胀,导致生 产、生活用水不断挤占生态环境用水,部分地区水资源开发利用甚至严重超过了最大极限,导致生态系统不断恶化 甚至难以恢复。干旱区水资源开发利用对生态环境影响的研究越来越受到重视。当前,国内外按照“发生的问题— 产生的机理—调控的标准—过程模拟—情景预测—响应对策”这一逻辑思路,围绕干旱区水资源开发利用对生态 环境的影响进行了大量研究,并取得了明显进展。但干旱区水资源开发利用对生态环境的影响机理研究相对薄弱, 仍难以精确刻画水资源开发利用与生态环境之间的定量关系,难以动态模拟和有效预测水资源开发利用对生态环 境的影响,面向干旱区生态环境的水资源开发利用对策研究在实践中仍面临着较多障碍。因此,未来应以机理研究 为基础,以过程模拟和情景预测为突破口,以综合集成的对策体系建设为落脚点,不断加强干旱区水资源开发利用 对生态环境影响的研究。</p>
Impact of water resources exploitation and utilization on eco-environment in arid area: Progress and prospect [J].https://doi.org/10.11820/dlkxjz.2008.03.006 Magsci [本文引用: 1] 摘要
<p>水资源是干旱区生态环境最主要的限制性因子和重要组成部分。干旱区人口和经济规模的膨胀,导致生 产、生活用水不断挤占生态环境用水,部分地区水资源开发利用甚至严重超过了最大极限,导致生态系统不断恶化 甚至难以恢复。干旱区水资源开发利用对生态环境影响的研究越来越受到重视。当前,国内外按照“发生的问题— 产生的机理—调控的标准—过程模拟—情景预测—响应对策”这一逻辑思路,围绕干旱区水资源开发利用对生态 环境的影响进行了大量研究,并取得了明显进展。但干旱区水资源开发利用对生态环境的影响机理研究相对薄弱, 仍难以精确刻画水资源开发利用与生态环境之间的定量关系,难以动态模拟和有效预测水资源开发利用对生态环 境的影响,面向干旱区生态环境的水资源开发利用对策研究在实践中仍面临着较多障碍。因此,未来应以机理研究 为基础,以过程模拟和情景预测为突破口,以综合集成的对策体系建设为落脚点,不断加强干旱区水资源开发利用 对生态环境影响的研究。</p>
|
| [2] |
全球气候变暖背景下农业干旱灾害与粮食安全: 基于西南五省面板数据的实证研究 [J].
干旱灾害是我国农业生产的最大风险,严重影响农产品生产供给与粮食安全.通过构建农业干旱灾害与粮食安全之间的计量模型,利用西南五省样本数据,实证检验了1997-2008年间农业干旱灾害对粮食安全的影响.结果表明,农业干旱灾害对粮食安全具有明显的影响.由此提出应对全球气候变暖下农业干旱灾害风险的策略:加强农田水利基础设施建设,通过增强水资源的时空调配能力达到农业抵御干旱灾害风险;选育耐早作物品种,提高作物干旱忍耐力;调整粮食生产布局,在高旱灾频率地区,减少高耗水作物生产等.
Agricultural drought disaster and food security under the background of global warming: Based on panel data of five provinces of Southwest China [J].
干旱灾害是我国农业生产的最大风险,严重影响农产品生产供给与粮食安全.通过构建农业干旱灾害与粮食安全之间的计量模型,利用西南五省样本数据,实证检验了1997-2008年间农业干旱灾害对粮食安全的影响.结果表明,农业干旱灾害对粮食安全具有明显的影响.由此提出应对全球气候变暖下农业干旱灾害风险的策略:加强农田水利基础设施建设,通过增强水资源的时空调配能力达到农业抵御干旱灾害风险;选育耐早作物品种,提高作物干旱忍耐力;调整粮食生产布局,在高旱灾频率地区,减少高耗水作物生产等.
|
| [3] |
干旱区绿洲城市经济系统脆弱性评价研究 [J].
我国东部沿海地区向中西部地区产业转移明显加快,西部地区矿产资源大规模开发,西北干旱区工业化和城镇化快速发展,绿洲城市作为区域经济发展中心面临着产业结构调整、消费结构升级等问题。从脆弱性的角度,运用综合评价方法,以新疆为例分析评价了干旱区绿洲城市经济系统的脆弱程度,并从城市规模、空间分布等方面分析了其表现特征。结果表明:绿洲城市经济系统脆弱性强度随着城市规模和等级的提高而降低;在空间分布上呈现出东疆绿洲城市经济系统脆弱程度最高,南疆和北疆较低;从敏感性和恢复力与脆弱性的关系来看,经济系统的恢复力对脆弱性的贡献度较高,努力提高绿洲城市经济发展综合水平,加快产业结构升级是提高绿洲城市经济可持续发展有效途径。
Vulnerability assessment of economic system of oasis cities in arid area [J].
我国东部沿海地区向中西部地区产业转移明显加快,西部地区矿产资源大规模开发,西北干旱区工业化和城镇化快速发展,绿洲城市作为区域经济发展中心面临着产业结构调整、消费结构升级等问题。从脆弱性的角度,运用综合评价方法,以新疆为例分析评价了干旱区绿洲城市经济系统的脆弱程度,并从城市规模、空间分布等方面分析了其表现特征。结果表明:绿洲城市经济系统脆弱性强度随着城市规模和等级的提高而降低;在空间分布上呈现出东疆绿洲城市经济系统脆弱程度最高,南疆和北疆较低;从敏感性和恢复力与脆弱性的关系来看,经济系统的恢复力对脆弱性的贡献度较高,努力提高绿洲城市经济发展综合水平,加快产业结构升级是提高绿洲城市经济可持续发展有效途径。
|
| [4] |
社区恢复力研究进展及其地理学研究议题 [J].https://doi.org/10.11820/dlkxjz.2015.01.012 URL Magsci [本文引用: 1] 摘要
随着人口、资源与环境的矛盾日益加深,灾害已成为可持续发展的重要障碍。在这一背景下,恢复力成为推动社会经济系统可持续发展的新理念和新范式。恢复力研究的范式也由早期的生态恢复力逐渐转向社区恢复力的研究。现有的社区恢复力研究成果主要集中在概念内涵探索、影响因素识别、基于客观指标和基于行动者感知的社区恢复力测度等方面。迄今尚未形成公认的可接受的社区恢复力理论框架;对普通乡村社区研究较多,对特定资源依赖型社区恢复力研究较少;对突发性自然灾害对社区恢复力的影响研究较多,对其他灾害和危机对社区恢复力的影响研究较少;社区恢复力测度方法的适用性和科学性仍待加强;社区恢复力关键影响因素的作用机制仍需进一步探索。在此基础上,提出从地理学视角研究社区恢复力的主要议题,包括社区恢复力的形成机制及其区域差异、动态演变过程、影响因素的作用机理、基于人地关系的社区恢复力感知量表以及具有尺度效应的社区恢复力测度指数等。
Research progress and themes of geography on community resilience [J].https://doi.org/10.11820/dlkxjz.2015.01.012 URL Magsci [本文引用: 1] 摘要
随着人口、资源与环境的矛盾日益加深,灾害已成为可持续发展的重要障碍。在这一背景下,恢复力成为推动社会经济系统可持续发展的新理念和新范式。恢复力研究的范式也由早期的生态恢复力逐渐转向社区恢复力的研究。现有的社区恢复力研究成果主要集中在概念内涵探索、影响因素识别、基于客观指标和基于行动者感知的社区恢复力测度等方面。迄今尚未形成公认的可接受的社区恢复力理论框架;对普通乡村社区研究较多,对特定资源依赖型社区恢复力研究较少;对突发性自然灾害对社区恢复力的影响研究较多,对其他灾害和危机对社区恢复力的影响研究较少;社区恢复力测度方法的适用性和科学性仍待加强;社区恢复力关键影响因素的作用机制仍需进一步探索。在此基础上,提出从地理学视角研究社区恢复力的主要议题,包括社区恢复力的形成机制及其区域差异、动态演变过程、影响因素的作用机理、基于人地关系的社区恢复力感知量表以及具有尺度效应的社区恢复力测度指数等。
|
| [5] |
农业干旱风险研究进展 [J].https://doi.org/10.11820/dlkxjz.2010.05.007 URL Magsci [本文引用: 1] 摘要
<p>农业干旱风险分析是近年来兴起的一个新的研究领域,这一研究不仅是农业旱灾风险管理的基础和前提,也是农业干旱风险区划和灾前损失预评估的理论基础.本文系统阐述了农业旱灾风险的内涵及构成要素、风险分析体系及研究现状,在此基础上指出,依据自然灾害风险分析基本原理,从农业旱灾危害性以及承灾体脆弱性角度系统地建立农业旱灾综合风险分析程序框架和指标体系,尤其是开发针对每一风险要素的、动态的数学模型和指标体系是当前干旱灾害风险时空格局研究的当务之急.</p>
New advances in agricultural drought risk study [J].https://doi.org/10.11820/dlkxjz.2010.05.007 URL Magsci [本文引用: 1] 摘要
<p>农业干旱风险分析是近年来兴起的一个新的研究领域,这一研究不仅是农业旱灾风险管理的基础和前提,也是农业干旱风险区划和灾前损失预评估的理论基础.本文系统阐述了农业旱灾风险的内涵及构成要素、风险分析体系及研究现状,在此基础上指出,依据自然灾害风险分析基本原理,从农业旱灾危害性以及承灾体脆弱性角度系统地建立农业旱灾综合风险分析程序框架和指标体系,尤其是开发针对每一风险要素的、动态的数学模型和指标体系是当前干旱灾害风险时空格局研究的当务之急.</p>
|
| [6] |
社会脆弱性概念、分析框架与评价方法 [J].https://doi.org/10.11820/dlkxjz.2014.10.008 URL Magsci [本文引用: 2] 摘要
社会脆弱性作为脆弱性的维度之一,是脆弱性与可持续性科学研究领域的新兴热点问题.在分析对国内外社会脆弱性研究文献的基础上,从概念内涵、分析框架与评价方法3 方面对社会脆弱性研究进行了评述.目前学者们对社会脆弱性概念有不同的理解,尚未形成统一的概念体系与内涵特征;系统性的社会脆弱性分析框架尚未形成,现有成果多是在脆弱性框架基础上的延伸和拓展,主要从政治经济学视角、社会—生态视角和综合视角开展研究;多元化的评价方法在社会脆弱性的应用研究中仍较少见,已有研究的评价指标体系尚不完善.未来,应进一步拓展社会脆弱性研究内容,促进多学科交叉融合;逐步统一社会脆弱性概念和分析框架,深化社会脆弱性的理论研究;加强社会脆弱性评价方法与指标体系的完善,促进多元化评价方法的应用;加强社会脆弱性减缓与调控对策研究,整合社会脆弱性与适应性框架,为提高社会适应能力与可持续发展提供科学依据.
The concept, analytical framework and assessment method of social vulnerability [J].https://doi.org/10.11820/dlkxjz.2014.10.008 URL Magsci [本文引用: 2] 摘要
社会脆弱性作为脆弱性的维度之一,是脆弱性与可持续性科学研究领域的新兴热点问题.在分析对国内外社会脆弱性研究文献的基础上,从概念内涵、分析框架与评价方法3 方面对社会脆弱性研究进行了评述.目前学者们对社会脆弱性概念有不同的理解,尚未形成统一的概念体系与内涵特征;系统性的社会脆弱性分析框架尚未形成,现有成果多是在脆弱性框架基础上的延伸和拓展,主要从政治经济学视角、社会—生态视角和综合视角开展研究;多元化的评价方法在社会脆弱性的应用研究中仍较少见,已有研究的评价指标体系尚不完善.未来,应进一步拓展社会脆弱性研究内容,促进多学科交叉融合;逐步统一社会脆弱性概念和分析框架,深化社会脆弱性的理论研究;加强社会脆弱性评价方法与指标体系的完善,促进多元化评价方法的应用;加强社会脆弱性减缓与调控对策研究,整合社会脆弱性与适应性框架,为提高社会适应能力与可持续发展提供科学依据.
|
| [7] |
黄土高原农村社会—生态系统体制转换初探: 以陕西省长武县洪家镇为例 [J].A study of regime shift of rural social-ecological system in Loess Plateau: A case study of Hongjia Town of Changwu County, Shaanxi Province [J]. |
| [8] |
干旱灾害评估研究进展 [J].https://doi.org/10.11820/dlkxjz.2011.07.015 [本文引用: 1] 摘要
在各种自然灾害中,干旱是发生范围最广、频率最高、灾情和影响最严重的灾害。近年来,随着自然灾害损失的加剧,减灾工作得到各国政府前所未有的重视,各国科技工作者开始了包括干旱在内的自然灾害的评估工作。本文旨在把握干旱灾害评估的研究现状,力求对干旱灾害评估各个方面的研究做出较全面的总结和评价,以期达到促进中国干旱灾害评估研究进一步深化的目的。文章从干旱指标、干旱评估理论、干旱评估方法以及干旱评估类型等方面对国内外的研究进展进行了较全面的分析,分析表明,现有干旱评估研究多侧重于农业干旱和区域单品种干旱灾情的特征研究,缺乏从系统的角度综合研究干旱对生态环境、社会经济效应等区域灾害系统的模拟研究,干旱评估模型结果不能反映干旱带来的系统影响。未来的干旱评估研究要更多地应用新技术和新方法,不断向多学科、综合研究方向发展。
Review of drought disaster evaluation [J].https://doi.org/10.11820/dlkxjz.2011.07.015 [本文引用: 1] 摘要
在各种自然灾害中,干旱是发生范围最广、频率最高、灾情和影响最严重的灾害。近年来,随着自然灾害损失的加剧,减灾工作得到各国政府前所未有的重视,各国科技工作者开始了包括干旱在内的自然灾害的评估工作。本文旨在把握干旱灾害评估的研究现状,力求对干旱灾害评估各个方面的研究做出较全面的总结和评价,以期达到促进中国干旱灾害评估研究进一步深化的目的。文章从干旱指标、干旱评估理论、干旱评估方法以及干旱评估类型等方面对国内外的研究进展进行了较全面的分析,分析表明,现有干旱评估研究多侧重于农业干旱和区域单品种干旱灾情的特征研究,缺乏从系统的角度综合研究干旱对生态环境、社会经济效应等区域灾害系统的模拟研究,干旱评估模型结果不能反映干旱带来的系统影响。未来的干旱评估研究要更多地应用新技术和新方法,不断向多学科、综合研究方向发展。
|
| [9] |
杭州城市蔓延评估体系及其治理对策 [J].https://doi.org/10.3321/j.issn:0375-5444.2009.04.004 URL [本文引用: 1] 摘要
在快速城市化中,中国的城市蔓延现象日益突出。在分析城市蔓延的概念和基本特征的基础上,探究了中国城市蔓延与西方城市蔓延的区别,并发现城市蔓延与经济社会的发展息息相关。因此,先从传统的空间形态角度,在借鉴和综合多种西方城市蔓延评估方法的基础上,利用层次分析法来初步构建城市蔓延的评估体系,再从经济社会的角度,运用主成分分析和模糊数学法求出经济发展和社会生活之间的协调度,利用有关协调度的函数来对评估体系的进行修正。然后,具体以杭州市为例进行了实际测算,结果表明杭州的城市蔓延处于较严重的等级,这与从空间形态图上的判断基本一致。最后,在分析杭州城市蔓延产生原因和结合我国实际的基础上,对城市蔓延问题的治理机制进行了初步探讨,从经济增长模式、投资模式、征地补偿、城市交通和规划制定与实施等多个方面提出了相应的政策建议。
Evaluation system and control mechanism of urban sprawl: A case study of Hangzhou [J].https://doi.org/10.3321/j.issn:0375-5444.2009.04.004 URL [本文引用: 1] 摘要
在快速城市化中,中国的城市蔓延现象日益突出。在分析城市蔓延的概念和基本特征的基础上,探究了中国城市蔓延与西方城市蔓延的区别,并发现城市蔓延与经济社会的发展息息相关。因此,先从传统的空间形态角度,在借鉴和综合多种西方城市蔓延评估方法的基础上,利用层次分析法来初步构建城市蔓延的评估体系,再从经济社会的角度,运用主成分分析和模糊数学法求出经济发展和社会生活之间的协调度,利用有关协调度的函数来对评估体系的进行修正。然后,具体以杭州市为例进行了实际测算,结果表明杭州的城市蔓延处于较严重的等级,这与从空间形态图上的判断基本一致。最后,在分析杭州城市蔓延产生原因和结合我国实际的基础上,对城市蔓延问题的治理机制进行了初步探讨,从经济增长模式、投资模式、征地补偿、城市交通和规划制定与实施等多个方面提出了相应的政策建议。
|
| [10] |
农业地理与乡村发展研究新近进展 [J].https://doi.org/10.11821/dlxb201408010 URL [本文引用: 1] 摘要
本文首先总结了近年来国际上农业地理与乡村发展研究进展,涉及研究的领域、理论和方法及其发展趋势,随后回顾了中华人民共和国成立以来中国农业地理与乡村发展学科的研究进展、取得的重要成果及其在农业与农村发展决策实践中的应用.中国农业地理与乡村发展学科的研究进展归纳为研究成果、新方法与新技术应用、主要成果和项目影响及决策服务应用等方面.其中研究成果主要包括:①农业与乡村地理学综合研究;②乡村转型发展与重构;③新农村建设综合研究;④城镇化、农村空心化与空心村整治;⑤中心村与专业村建设;⑥城乡发展一体化与等值化;⑦区域农业与乡村发展研究;⑧研究成果的系统化与国际化.最后,通过比较国内外相关领域的研究进展,联系中国实际,展望了未来中国农业与乡村地理学研究.
Recent progress in agricultural geography and rural development research [J].https://doi.org/10.11821/dlxb201408010 URL [本文引用: 1] 摘要
本文首先总结了近年来国际上农业地理与乡村发展研究进展,涉及研究的领域、理论和方法及其发展趋势,随后回顾了中华人民共和国成立以来中国农业地理与乡村发展学科的研究进展、取得的重要成果及其在农业与农村发展决策实践中的应用.中国农业地理与乡村发展学科的研究进展归纳为研究成果、新方法与新技术应用、主要成果和项目影响及决策服务应用等方面.其中研究成果主要包括:①农业与乡村地理学综合研究;②乡村转型发展与重构;③新农村建设综合研究;④城镇化、农村空心化与空心村整治;⑤中心村与专业村建设;⑥城乡发展一体化与等值化;⑦区域农业与乡村发展研究;⑧研究成果的系统化与国际化.最后,通过比较国内外相关领域的研究进展,联系中国实际,展望了未来中国农业与乡村地理学研究.
|
| [11] |
1960-2012年甘肃黄土高原干旱时空变化特征分析: 基于标准化降水蒸散指数 [J].
基于甘肃黄土高原区12个测站1960-2012年的气象资料,利用标准化降水蒸散指数对该区近53a四季干旱的时空变化特征进行了分析。结果表明:甘肃黄土高原区近53a的四季均呈干旱化趋势,以秋季最为突出,春季次之。经过Mann-Kendall趋势分析法检验,秋旱最显著的地方是兰州、靖远及环县;春旱最明显的地方是崆峒、庆阳和西峰;冬季有变湿的趋向,但未通过显著性水平。空间分布上,甘肃黄土高原区腹部比边缘区发生干旱的频率高,山地比谷地发生干旱的频率高。陇中地区夏旱频发,陇东地区冬旱频繁。干旱变幅最大的地方是研究区西北的乌鞘岭和东北的子午岭。近53a研究区干旱事件发生频次呈增长趋势,近10a来尤为显著。中度干旱发生频次的增长速度比极端干旱事件增长的快,但没有极端干旱事件显著。
The temporal and spatial distribution of drought on the Loess Plateau based on the standardized precipitation evapotranspiration index from 1960 to 2012 [J].
基于甘肃黄土高原区12个测站1960-2012年的气象资料,利用标准化降水蒸散指数对该区近53a四季干旱的时空变化特征进行了分析。结果表明:甘肃黄土高原区近53a的四季均呈干旱化趋势,以秋季最为突出,春季次之。经过Mann-Kendall趋势分析法检验,秋旱最显著的地方是兰州、靖远及环县;春旱最明显的地方是崆峒、庆阳和西峰;冬季有变湿的趋向,但未通过显著性水平。空间分布上,甘肃黄土高原区腹部比边缘区发生干旱的频率高,山地比谷地发生干旱的频率高。陇中地区夏旱频发,陇东地区冬旱频繁。干旱变幅最大的地方是研究区西北的乌鞘岭和东北的子午岭。近53a研究区干旱事件发生频次呈增长趋势,近10a来尤为显著。中度干旱发生频次的增长速度比极端干旱事件增长的快,但没有极端干旱事件显著。
|
| [12] |
1950-2010年中国干旱灾情频率—规模关系分析 [J].
<p>借鉴相关领域研究概念,对1950~2010年中国干旱灾情的变化动态,特别是频率与规模的关系做定量分析,划分风险的可接受与不可接受区。研究结果发现:① 总体上,60 a来干旱灾害中受灾、成灾面积和粮食损失在逐年不断的增加。② 干旱灾害中粮食损失与累积频率的关系与著名的古登堡-里查德关系类似,呈现良好的幂律性。而受灾、成灾面积与累积频率的关系则符合线性关系。③ 通过借鉴地质灾害领域相关可接受风险概念,划定干旱灾害中年粮食损失、受灾和成灾面积的可接受与不可接受灾情的界线。④ 借鉴相关领域研究概念,尝试对干旱灾害进行探索,因此,在将来的研究中还有待继续和深化。</p>
Relationship between frequency and magnitude of drought damage in China in 1950-2010 [J].
<p>借鉴相关领域研究概念,对1950~2010年中国干旱灾情的变化动态,特别是频率与规模的关系做定量分析,划分风险的可接受与不可接受区。研究结果发现:① 总体上,60 a来干旱灾害中受灾、成灾面积和粮食损失在逐年不断的增加。② 干旱灾害中粮食损失与累积频率的关系与著名的古登堡-里查德关系类似,呈现良好的幂律性。而受灾、成灾面积与累积频率的关系则符合线性关系。③ 通过借鉴地质灾害领域相关可接受风险概念,划定干旱灾害中年粮食损失、受灾和成灾面积的可接受与不可接受灾情的界线。④ 借鉴相关领域研究概念,尝试对干旱灾害进行探索,因此,在将来的研究中还有待继续和深化。</p>
|
| [13] |
高寒生态脆弱区农户的气候变化适应策略: 以甘南高原为例 [J].Farmers' climate change adaptation strategies in an ecologically vulnerable alpine region: A case of Gannan Plateau [J]. |
| [14] |
基于情景分析的西北农村社会-生态系统脆弱性研究: 以榆中县中连川乡为例 [J].
人地系统及其脆弱性是地理学研究的核心内容。近年来,脆弱性研究对象逐渐由生态系统转变到人地耦合系统即社会-生态系统,由于该耦合系统具有多尺度扰动和多利益主体并存的特点,且易受不确定性的干扰,目前关于系统脆弱性评价方法难以解释系统的不确定性。选择榆中县中连川乡作为研究区域,尝试将社会与生态环境信息结合起来进行脆弱性研究。首先运用情景分析方法,确定当地社会-生态系统未来的情景变化的关键驱动力为干旱气候和政府决策,筛选出在两者组合下系统未来情景概率较高的3 种情景S<sub>1</sub>(干旱减缓,有政策支持),S<sub>2</sub>(干旱缓解,无政策支持)和S<sub>3</sub>(干旱加剧,有政策支持)。通过实地调查,对多利益主体(农户、管理者和科研工作者)进行情景访谈,对不同利益主体对不同情景的可接受程度进行测度,结合社会-生态矩阵分析,得到不同利益主体对系统未来的可接受程度,以此判断利益主体在未来变化情景下的脆弱度。结果显示,在S<sub>1</sub>情景下,当地农民和管理者的脆弱性较低;在S<sub>2</sub>和S<sub>3</sub>情景下,当地农民和管理者的可接受度是负向的,表明其脆弱性增加,干旱加剧是影响当地未来发展的决定因素,政策支持在一定程度上弥补干旱带来的消极影响。根据不同利益主体的态度,提出未来当地发展的相关政策建议。
Vulnerability assessment of rural social-ecological system based on scenario analysis: A case study of Zhonglianchuan Town in Yuzhong County [J].
人地系统及其脆弱性是地理学研究的核心内容。近年来,脆弱性研究对象逐渐由生态系统转变到人地耦合系统即社会-生态系统,由于该耦合系统具有多尺度扰动和多利益主体并存的特点,且易受不确定性的干扰,目前关于系统脆弱性评价方法难以解释系统的不确定性。选择榆中县中连川乡作为研究区域,尝试将社会与生态环境信息结合起来进行脆弱性研究。首先运用情景分析方法,确定当地社会-生态系统未来的情景变化的关键驱动力为干旱气候和政府决策,筛选出在两者组合下系统未来情景概率较高的3 种情景S<sub>1</sub>(干旱减缓,有政策支持),S<sub>2</sub>(干旱缓解,无政策支持)和S<sub>3</sub>(干旱加剧,有政策支持)。通过实地调查,对多利益主体(农户、管理者和科研工作者)进行情景访谈,对不同利益主体对不同情景的可接受程度进行测度,结合社会-生态矩阵分析,得到不同利益主体对系统未来的可接受程度,以此判断利益主体在未来变化情景下的脆弱度。结果显示,在S<sub>1</sub>情景下,当地农民和管理者的脆弱性较低;在S<sub>2</sub>和S<sub>3</sub>情景下,当地农民和管理者的可接受度是负向的,表明其脆弱性增加,干旱加剧是影响当地未来发展的决定因素,政策支持在一定程度上弥补干旱带来的消极影响。根据不同利益主体的态度,提出未来当地发展的相关政策建议。
|
| [15] |
乡村农户适应旅游发展的模式及影响机制: 以秦岭金丝峡景区为例 [J].Exploring conditions, determinants and mechanisms of rural households' adaptability to tourism development: A case study of Jinsixia in Qinling Mountains [J]. |
| [16] |
Disaster community resilience assessment method: A consensus-based Delphi and AHP approach [J].https://doi.org/10.1007/s11069-015-1719-5 URL [本文引用: 1] 摘要
Several studies have highlighted the importance of community resilience in disaster management. The paper focuses on Saudi Arabia and proposes a ‘community resilience to disaster’ framework. The dimensions of the framework have been developed using the consensus-based Delphi technique. A weighting system for each dimension and criteria is proposed using the analytic hierarchy process (AHP). Experts’ opinions were collected using pair-wise comparisons and then coded in AHP Expert Choice software to evaluate and give priorities to the possible outcomes of the process. The weighting system provides a quantitative and qualitative assessment tool to measure community resilience to disasters in Saudi Arabia and beyond. The findings emphasise the importance of a number of dimensions, including health and well-being (24.502% of the total weight), governance (1802%), physical and environmental (17.402%), economic (15.902%), information and communication (14.302%) and social (9.902%).
|
| [17] |
Vulnerability of Himalayan transhumant communities to climate change [J].https://doi.org/10.1007/s10584-014-1157-5 URL [本文引用: 1] 摘要
Climate change vulnerability depends on who you are, where you are and what you do. The indigenous communities who primarily depend on natural resources for subsistence livelihoods are among the first and most affected by climate change. Climate models have predicted pronounced warming in high altitude regions of the Himalayas. The transhumant communities of the Himalayas follow traditional lifestyles based on seasonal livestock rearing and subsistence agriculture. There is however, no information on how vulnerable transhumant communities are to climate change, and how vulnerability of transhumant herders differs across the mountainous areas of Nepal. Based on semi-structured interviews with transhumant herders and using the IPCC climate change vulnerability framework, this study assessed and compared the vulnerability of transhumant communities from three districts representing Eastern, Central and Western mountainous region of Nepal. The results showed that the livelihood vulnerability and the climate change vulnerability differ across sites; both of them having lowest index values in the Central region. The vulnerability dimensions viz. exposure, sensitivity and adaptive capacity are largely influenced by diversity in livelihood strategies, income sources and crops, and access to food, water and health facilities. The findings will inform the design of policies and programmes to reduce vulnerability and enhance adaptive capacity of indigenous communities in general and the transhumant communities of the Himalayas in particular.
|
| [18] |
Determinants of farmers' choice of coping and adaptation measures to the drought hazard in Northwest Balochistan, Pakistan [J].https://doi.org/10.1007/s11069-014-1149-9 URL [本文引用: 6] 摘要
This study identifies the coping and adaptation behavior of the farm households and also examines the factors that influence farmers’ choice for drought-induced adaptation strategies. The study employs a multivariate probit model on 215 farm households’ survey data from northwest Balochistan, Pakistan. The findings reveal that the farmers have shown considerable fortitude in coping with the impacts of drought on their agro-based practices and employed several adaptation initiatives both at on-farm and off-farm levels. These include crop management, water management, adjustment in agricultural inputs, income diversification, economization of expenditure and consumption smoothing, migrating to other places to seek alternative sources of income, assets depletion, and borrowing. Empirically, it is depicted that landholding, annual income, livestock ownership, credit access, farmer-to-farmer extension, GOs/NGOs support increase the probability of farmers’ decision to cope and adapt better with drought hazard. This study implies for specific policy and practice-oriented solutions in order to cope with and adapt in drought situation.
|
| [19] |
Assessing the social vulnerability to malaria in Rwanda [J].https://doi.org/10.1186/1475-2875-14-2 URL PMID: 25566988 [本文引用: 1] 摘要
Background Since 2004, malaria interventions in Rwanda have resulted in substantial decline of malaria incidence. However, this achievement is fragile as potentials for local malaria transmissions remain. The risk of getting malaria infection is partially explained by social conditions of vulnerable populations. Since vulnerability to malaria is both influenced by social and environmental factors, its complexity cannot be measured by a single value. The aim of this paper is, therefore, to apply a composite indicator approach for assessing social vulnerability to malaria in Rwanda . This assessment informs the decision-makers in targeting malaria interventions and allocating limited resources to reduce malaria burden in Rwanda . Methods A literature review was used to conceptualize the social vulnerability to malaria and to select the appropriate vulnerability indicators. Indicators used in the index creation were classified into susceptibility and lack of resilience vulnerability domains. The main steps followed include selection of indicators and datasets, imputation of missing values, descriptive statistics, normalization and weighting of indicators, local sensitivity analysis and indicators aggregation. Correlation analysis helped to empirically evidence the association between the indicators and malaria incidence. Results The high values of social vulnerability to malaria are found in Gicumbi, Rusizi, Nyaruguru and Gisagara, and low values in Muhanga, Nyarugenge, Kicukiro and Nyanza. The most influential susceptibility indicators to increase malaria are population change (r65=650.729), average number of persons per bedroom (r65=650.531), number of households affected by droughts and famines (r65=650.591), and area used for irrigation (r65=650.611). The bed net ownership (r65=65610.398) and poor housing wall materials (0.378) are the lack of resilience indicators that significantly correlate with malaria incidence. Conclusions The developed composite index social vulnerability to malaria indicates which indicators need to be addressed and in which districts. The results from this study are salient for public health policy- and decision makers in malaria control in Rwanda and timely support the national integrated malaria initiative. Future research development should focus on spatial explicit vulnerability assessment by combining environmental and social drivers to achieve an integrated and complete assessment of vulnerability to malaria.
|
| [20] |
The determinants of vulnerability and adaptive capacity at the national level and the implications for adaptation [J].https://doi.org/10.1016/j.gloenvcha.2004.12.006 URL [本文引用: 1] 摘要
We present a set of indicators of vulnerability and capacity to adapt to climate variability, and by extension climate change, derived using a novel empirical analysis of data aggregated at the national level on a decadal timescale. The analysis is based on a conceptual framework in which risk is viewed in terms of outcome, and is a function of physically defined climate hazards and socially constructed vulnerability. Climate outcomes are represented by mortality from climate-related disasters, using the emergency events database data set, statistical relationships between mortality and a shortlist of potential proxies for vulnerability are used to identify key vulnerability indicators. We find that 11 key indicators exhibit a strong relationship with decadally aggregated mortality associated with climate-related disasters. Validation of indicators, relationships between vulnerability and adaptive capacity, and the sensitivity of subsequent vulnerability assessments to different sets of weightings are explored using expert judgement data, collected through a focus group exercise. The data are used to provide a robust assessment of vulnerability to climate-related mortality at the national level, and represent an entry point to more detailed explorations of vulnerability and adaptive capacity. They indicate that the most vulnerable nations are those situated in sub-Saharan Africa and those that have recently experienced conflict. Adaptive capacity ne element of vulnerability s associated predominantly with governance, civil and political rights, and literacy.
|
| [21] |
Problematizing water vulnerability indices at a local level: A critical review and proposed solution [J].https://doi.org/10.1007/s11269-015-1101-0 URL [本文引用: 1] 摘要
Effectively assessing water vulnerability is essential as threats to water resources mount. Appraisals that take an integrative perspective incorporating physical and social considerations at a community scale are particularly important as they address the breadth of vulnerability sources and concentrate on a level where action frequently occurs. This paper critically reviews seven water vulnerability indices according to good practices for composite indices. The analysis reveals several shortcomings and discusses how they limit the validity of water vulnerability indices. A seven step framework is proposed to overcome these limitations. It builds upon previous approaches to assessing water vulnerability and incorporates good practice of developing composite indices. The framework offers guidance to enhance effectiveness and promotes tailoring of water vulnerability assessments to particular situations. Improving the accuracy of information from such assessments ultimately enhances the capability to respond to water related challenges. Copyright Springer Science+Business Media Dordrecht 2015
|
| [22] |
Reducing vulnerability of rain-fed agriculture to drought through indigenous knowledge systems in North-eastern Ghana [J].https://doi.org/10.1108/17568691311299372 URL [本文引用: 1] 摘要
Purpose - The purpose of this paper is to analyze how fanners are reducing vulnerability of rain-fed agriculture to drought through indigenous knowledge systems (IKS) in the Atankwidi basin, north-eastern Ghana.Design/methodology/approach - This paper draws on combined qualitative and quantitative research methods and data. First, the paper draws on qualitative data generated from in-depth interviews and focus group discussions from purposively sampled farmers in the Atankwidi basin. It also draws on a survey conducted on 131 systematically and randomly sampled households in three communities of the basin, namely Yua, Pungu and Mirigu.Findings - The results show that farmers are planting multiple indigenous drought resilient crop varieties and employing different rounds of seeding and or staggering planting between multiple farms. They are also applying indigenous forms of organic manure, checking soil erosion through grass strips and stone terracing and adopting paddy farming for improving soil and water conservation towards enhancing plant adaptation to drought. The paper therefore, asserts that through conscientious effort, farmers are reducing vulnerability of rain-fed agriculture to drought through indigenous knowledge systems of drought risk management.Practical implications - The paper recommends that capacity for managing vulnerability to drought at the local level, including the Atankwidi basin, can be enhanced by incorporating as into District Development Planning (DDP) and giving priority to the strategic role of IKS in climate change adaptation planning.Originality/value - This paper fulfills a need for researching the relevance of IKS for reducing vulnerability of rain-fed agriculture to drought in particular, and enhancing adaptation to climate. change in general in the quest for promoting Endogenous Development (ED) in Africa.
|
| [23] |
Insights into the composition of household vulnerability from multicriteria decision analysis [J].https://doi.org/10.1016/j.gloenvcha.2007.09.001 URL [本文引用: 2] 摘要
Vulnerability is a multidimensional concept associated with high uncertainty in measurement and classification. Developing a vulnerability index from the diverse and often incommensurate data that form the basis of vulnerability assessments is often a core challenge of vulnerability research. Problematically, many vulnerability indices are based on the implicit or explicit assumption that each indicator of vulnerability is of equal importance. In this paper we propose a procedure to engage constructively with the inherent subjectivity and uncertainty of assigning weights to disparate indicators used in vulnerability assessments, using common tools of multicriteria decision analysis (MCDA) and fuzzy logic. To illustrate our proposed methodology, we present a case study of rural livelihood vulnerability in the state of Tamaulipas, M xico. In our case study, we combine a livelihoods framework with MCDA to weigh household attributes according to their relative importance in driving household vulnerability. This approach requires the explicit articulation of the relationship of each indicator to the umbrella concept (vulnerability) as well as of each indicator to every other indicator. In recognition of the inherent uncertainties involved in assigning any particular unit of analysis to a specific vulnerability class, we use fuzzy logic to create the final categories of household livelihood vulnerability to climatic risk. Our analysis reveals how different structures of livelihood assets and activities contributes to household sensitivity and capacities in a region characterized by variable climatic conditions, stagnant incomes, increasing market stress and declining farm productivity.
|
| [24] |
Rural household vulnerability and strategies for improvement: An empirical analysis based on time series [J].https://doi.org/10.1016/j.habitatint.2015.11.035 URL [本文引用: 6] 摘要
Households are the basic units of production and consumption in rural communities. Analyzing vulnerability at the household level can help in identifying the threats that households face and potential coping and adaptation approaches, especially in view of the increasing vulnerability to the impacts of climate change. We developed a household-based model for assessing rural household vulnerability in Shigatze Prefecture in Tibet Autonomous Region of China using time series survey data. The assessment took four main aspects of vulnerability into account: the subsistence condition (food supply), development condition (education and income), accessibility of water resources (variability in rainfall), and threat of water disaster (area affected by drought and floods). Rural household vulnerability decreased overall between 1986 and 2012 but with considerable fluctuation over time. Up to 2000, the main drivers of vulnerability were knowledge (basic education), access to sufficient food, and reliable access to water, in that order. After the early 2000s, knowledge (basic education) is also the most important driver, followed by cash income, and again reliable access to water. The increase in importance of education and income is linked to the transformation of focus of rural households from subsistence to sustainable development. The impact of variability in water resources appears to be becoming more important as a result of climate change. The most effective strategies for reducing rural household vulnerability and improving adaptive capacity to climate change are likely to be accelerating the development of education in rural areas, promoting an incremental increase in the income of farmers and herdsmen, constructing rural irrigation infrastructure, and establishing agricultural disaster prevention and mitigation systems.
|
| [25] |
Mapping South African farming sector vulnerability to climate change and variability: A subnational assessment[R]. |
| [26] |
Assessing cross-sectoral climate change impacts, vulnerability and adaptation: An introduction to the CLIMSAVE project [J].https://doi.org/10.1007/s10584-015-1324-3 URL [本文引用: 1] 摘要
Quantitative participatory exploration of the many complex issues surrounding cross-sectoral climate change impacts, vulnerability and adaptation under uncertain futures is dependent on the provision,
|
| [27] |
Trapezoidal fuzzy DEMATEL method to analyze and correct for relations between variables in a composite indicator for disaster resilience [J].https://doi.org/10.1007/s00291-011-0269-9 URL [本文引用: 1] 摘要
Indicator systems of disaster vulnerability are important for monitoring and increasing the capacity in risk management. Various composite indicators have been developed to operationalize social vulnerability at national and sub-national level. Problems with relations between the sub-indicators of the composite indicator are a common phenomenon. The fuzzy Decision-Making Trial and Evaluation Laboratory (DEMATEL) method analyzes the structure of complex cause-effect relationships between the sub-indicators based on perceived direct influences. The results provide insight into the composite indicators and can be used to correct the sub-indicator weighting for relations between the sub-indicators and allow the identification of cause- and effect-group sub-indicators which is an important information for selecting mitigation measures in risk management. The fuzzy DEMATEL method is generalized to take into account trapezoidal membership functions. A composite indicator originally developed to determine the disaster resilience in US counties is adapted, operationalized and used to assess the resilience of Germany at county level using corrected weights. Resilience is highest in urban areas and in southern Germany and lowest in rural areas, in particular in eastern Germany.
|
| [28] |
Vulnerability of families and households to natural hazards: A case study of storm surge flooding in Sarasota County, Florida [J].https://doi.org/10.1016/j.apgeog.2016.09.021 URL [本文引用: 3] 摘要
The role that family and household structure, size, and ethnic/racial composition play in increasing or decreasing vulnerability to natural hazards, which has been missing from the literature, is investigated. The study first reviews the conceptual foundations of the relationships between families/households and natural hazards vulnerability and then employs a principal components analysis to uncover spatial variations in the vulnerability of families and households to hurricane storm surge hazards in Sarasota County, Florida. The analysis identifies and maps five principal components that explain approximately 83% of the variance in family/household population: nuclear families/households; Black families/households; nonfamily, young adult group households; Hispanic families/households; and Asian families/households. Comparison of storm surge risk maps with the locations of these families/households shows the relative vulnerability of each of these family/household categories, with elderly householders living alone on exposed barrier islands being the most vulnerable. The research suggests that family and household structures integrate several socio-demographic vulnerability indicators central to most social vulnerability assessments. Results indicate that future research and hazard mitigation policies should focus on families and households as core analytical units. Findings also suggest that recognizing the diversity of families and households is important to reducing vulnerability to natural hazards.
|
| [29] |
Experiencing local community resilience in action: Learning from post-disaster communities [J].https://doi.org/10.1016/j.jrurstud.2016.08.002 URL [本文引用: 1] 摘要
Although increasing attention has been given to the need to engage local communities and facilitate community resilience, discrepancies between theory and practice remain evident. Myths, misconceptions and mistakes persist in post-disaster emergency operations, and in the reconstruction and re-development efforts following disaster. The ommand and control approach typically deployed by disaster management agencies results in an increasing dependency on external support and annihilates the potentialities of local communities. Learning lessons from post-disaster interventions is important in order to better understand how to orient development interventions, especially those addressed to the sustainable development of vulnerable areas, such as mountain and rural territories. We emphasise the importance of recognizing community resilience and the capacity of local communities to self-organise. We describe examples of community resilience in action as it occurred following the earthquake in the Province of L'Aquila in the Abruzzo region of central Italy on 6 April 2009. We discuss the aftershock economies and aftershock societies that developed in the extraordinary communities that emerged around rural villages in the mountain areas around L'Aquila. A multi-methods approach was used, primarily drawing on personal experiences of life in the autonomous locally-organised camps that were established in rural areas following the earthquake. We conclude that the persistence of various disaster myths and the failure to acknowledge community resilience undermine more effective, socially-sustainable, disaster management and rural development planning. Learning from the post-disaster communities that arose in the L'Aquila post-earthquake mountain territory, we argue that in post-disaster management and in rural development planning, there should be a greater awareness of the underlying community resilience, and we suggest that greater attention should be given to understanding, recognizing and strengthening the capacities of local communities and the resilient social processes they put into action in order to address the negative social and economic impacts they experience during crises.
|
| [30] |
Drought impact assessment on rural livelihood systems in Iran [J].https://doi.org/10.1016/j.ecolind.2016.05.039 URL [本文引用: 1] 摘要
The present study aimed to analyze the effects of drought on rural livelihood systems in Iran with an emphasis on the mediator role of livelihood assets in relationship between drought and livelihood outcomes. The relationships between these concepts were explored through the lens of sustainable livelihoods approach. A conceptual model was developed based on the literature review and was evaluated using cross-sectional data based on 11 years average of each variable from 2002 to the end of 2012. Regarding research objectives, a documentary review was applied to collect necessary data and information. So, secondary data were obtained from national surveys and statistical sources of governmental organizations. Data were analyzed using multiple regression. We followed the Baron and Kenny (1986) three-step procedure to test mediating relationships between variables. Results generally showed that drought duration had destructive effects on rural livelihood capitals and outcomes, while the negative influences of drought severity were far more restricted than drought duration. Complete mediation of livelihood assets in the relationship between drought intensity and inequality was confirmed. We also found support for partial mediation of livelihood assets in the relationship between drought severity and duration with the added value of the agricultural sector as well as in the relationship between drought duration and inequality.
|
| [31] |
Measurement and evaluation of sustainable development: A composite indicator for the islands of the North Aegean region, Greece [J].https://doi.org/10.1016/j.eiar.2009.08.006 URL [本文引用: 1] |
| [32] |
Rethinking the relationships of vulnerability, resilience, and adaptation from a disaster risk perspective [J].https://doi.org/10.1007/s11069-013-0831-7 URL [本文引用: 5] 摘要
Vulnerability, resilience, and adaptation are three fundamentally inter-related concepts among such research communities as global environmental/climatic change, social–ecological and disaster risk science. However, their mutual relationships are still unclear so far particularly in the field of disaster risk reduction, which to some extent blocks the reasonable risk analysis and scientific decision making. This paper performed a brief overview on the basic definitions and evolution processes of vulnerability, resilience, and adaptation, and tentatively categorized past diverse thoughts of their relationships into three modalities, such as, vulnerability preference, resilience preference, and overlapped relationships. From a “hit-damage-recovery-learning cycle” insight and based on an empirical case study, we put forward two conceptual frameworks to address the relationships of vulnerability, resilience, and adaptation within the disaster risk domain, and we further discussed their broader implications in terms of disaster risk management and social–ecological sustainability. In an attempt to bring together the analytical frameworks of vulnerability, resilience, and adaptation, this study indicates that a sustainable adaptation strategy to the unavoidable disasters or changes should not only seek to reduce the vulnerability of a social–ecological system, but also to foster its resilience and adaptive capacity to future uncertainties and potential risks.
|
| [33] |
Rural livelihoods and climate variability in Ningxia, Northwest China [J].https://doi.org/10.1007/s10584-013-0765-9 URL [本文引用: 1] 摘要
This study addresses the role of climate variability in the livelihoods of agricultural communities in Ningxia, Northwest China. Data sources comprise meteorological observations and official reports, complemented by questionnaires and focus group discussions designed around a livelihoods framework. Sample villages were located in three different agricultural systems: irrigated, mixed irrigated/grazing, and rainfed. Much of Ningxia is perennially dry and this is a significant limiting factor to agricultural production in the region, exacerbated by drought and buffered by irrigation mainly supplied from the Yellow River. Climate observations show stable temperatures from the 1950s to the 1980s followed by a positive trend (0.38°C/decade 1961–2010). Precipitation shows very modest trends and low decadal variability. Recent climate variability, particularly a drought from 2004–2006, was perceived to have had a significant effect on agricultural production and access to water, but it was not the only challenge respondents had faced. Susceptibility to drought was higher in the mixed irrigated and grazing and rainfed areas, due to farmers’ greater exposure to climatic hazards and because a higher proportion of their income originated from farming activities. Respondents were using a wide range of measures to retain and enhance soil moisture and maintain agricultural production. The discussion examines challenges in disentangling the role of climate within rapidly changing livelihood systems.
|
| [34] |
Integrated assessment of smallholder farming's vulnerability to drought in the Brazilian Semi-arid: A case study in Ceará [J].https://doi.org/10.1007/s10584-014-1116-1 URL [本文引用: 1] 摘要
Smallholder farming is among the most vulnerable sectors due to its great social and economic sensitivity. Despite future climate change, current climate variability is already an issue of concern that justifies adaptation efforts. In Brazil, the Semi-Arid Region is a climate hotspot, well known for both historic socioeconomic setbacks, and agriculture failures caused by dry spells and severe droughts. In 2010, the Brazilian government enacted the National Policy on Climate Change, which states as one of its key goals the identification of vulnerabilities and the adoption of adequate measures of adaptation to climate change. The improvement of vulnerability assessment tools is a response to the growing demand of decision makers for regular information and indicators with high spatial and temporal resolution. This article aims at undertaking a comparative assessment of smallholder farming vulnerability to droughts. An integrated assessment system has been developed and applied to seven municipalities located in the Brazilian Semi-Arid Region (within the State of Cear). Results show regional vulnerability contrasts driven by institutional and socioeconomic factors, beyond climatic stressors.
|
| [35] |
Assessing vulnerability to drought based on exposure, sensitivity and adaptive capacity: A case study in middle Inner Mongolia of China [J].https://doi.org/10.1007/s11769-012-0583-4 URL [本文引用: 1] |
| [36] |
Modelling livelihoods and household resilience to droughts using Bayesian networks [J].https://doi.org/10.1007/s10668-015-9650-1 URL [本文引用: 1] 摘要
Over the last four decades, the Indian government has been investing heavily in watershed development (WSD) programmes that are intended to improve the livelihoods of rural agrarian communities and maintain or improve natural resource condition. Given the massive investment in WSD in India, and the recent shift from micro-scale programmes (<500 ha) to meso-scale (~5000 ha) clusters, robust methodological frameworks are needed to measure and analyse impacts of interventions across landscapes as well as between and within communities. In this paper, the sustainable livelihoods framework is implemented using Bayesian networks (BNs) to develop models of drought resilience and household livelihoods. Analysis of the natural capital component model provides little evidence that watershed development has influenced household resilience to drought and indicators of natural capital, beyond an increased area of irrigation due to greater access to groundwater. BNs have proved a valuable tool for implementing the sustainable livelihoods framework in a retrospective evaluation of implemented WSD programmes. Many of the challenges of evaluating watershed interventions using BNs are the same as for other analytical approaches. These are reliance on retrospective studies, identification and measurement of relevant indicators and isolating intervention impacts from contemporaneous events. The establishment of core biophysical and socio-economic indicators measured through longitudinal household surveys and monitoring programmes will be critical to the success of BNs as an evaluation tool for meso-scale WSD.
|
| [37] |
Exploring drought vulnerability in Africa: An indicator based analysis to inform early warning systems [J].https://doi.org/10.5194/hess-18-1591-2014 URL [本文引用: 3] 摘要
We propose a composite drought vulnerability indicator (DVI) that reflects different aspects of drought vulnerability evaluated at Pan-African level for four components: the renewable natural capital, the economic capacity, the human and civic resources, and the infrastructure and technology. The selection of variables and weights reflects the assumption that a society with institutional capacity and coordination, as well as with mechanisms for public participation, is less vulnerable to drought; furthermore, we consider that agriculture is only one of the many sectors affected by drought. The quality and accuracy of a composite indicator depends on the theoretical framework, on the data collection and quality, and on how the different components are aggregated. This kind of approach can lead to some degree of scepticism; to overcome this problem a sensitivity analysis was done in order to measure the degree of uncertainty associated with the construction of the composite indicator. Although the proposed drought vulnerability indicator relies on a number of theoretical assumptions and some degree of subjectivity, the sensitivity analysis showed that it is a robust indicator and hence able of representing the complex processes that lead to drought vulnerability. According to the DVI computed at country level, the African countries classified with higher relative vulnerability are Somalia, Burundi, Niger, Ethiopia, Mali and Chad. The analysis of the renewable natural capital component at sub-basin level shows that the basins with high to moderate drought vulnerability can be subdivided into the following geographical regions: the Mediterranean coast of Africa; the Sahel region and the Horn of Africa; the Serengeti and the Eastern Miombo woodlands in eastern Africa; the western part of the Zambezi Basin, the southeastern border of the Congo Basin, and the belt of Fynbos in the Western Cape province of South Africa. The results of the DVI at the country level were compared with drought disaster information from the EM-DAT disaster database. Even if a cause ffect relationship cannot be established between the DVI and the drought disaster database, a good agreement is observed between the drought vulnerability maps and the number of persons affected by droughts. These results are expected to contribute to the discussion on how to assess drought vulnerability and hopefully contribute to the development of drought early warning systems in Africa.
|
| [38] |
The vulnerability of beach tourism to climate change: An index approach [J].https://doi.org/10.1007/s10584-009-9692-1 URL [本文引用: 1] 摘要
The attractiveness of a region for touristic activities depends strongly on the local weather and climate. This paper analyses the vulnerability of the beach tourism sector towards climate change by means of an index approach on a country level. A vulnerability framework for the tourism sector is developed and on its basis, indicators are defined for exposure, sensitivity and adaptive capacity. A transparent index approach, including a robustness analysis with multiple transformation methods and weighting sets, yields an assessment of the overall relative vulnerability of the beach tourism sector in 51 countries. Aggregate results on an annual level are presented as a starting point for a more detailed comparison of countries based on the individual indicators. The important limitations regarding the availability of accurate indicators as well as the concept of vulnerability itself are discussed. Despite these limitations, the present study contributes to integrating the numerous direct as well as indirect effects climate change may have on beach tourism.
|
| [39] |
Vulnerability of Chepang households to climate change and extremes in the Mid-Hills of Nepal [J].https://doi.org/10.1007/s10584-015-1572-2 URL [本文引用: 1] 摘要
Abstract Rural communities, which depend predominantly on natural resources, are increasingly vulnerable as global climate change makes the weather and extreme weather events more unpredictable. To formulate appropriate policy measures to address their livelihood challenges, assessment of local vulnerability is important. In this study, the vulnerability of Chepang communities in Nepal was analyzed using data collected from 221 households from four villages across four districts. The analysis was based on indices constructed from selected indicators measuring exposure, sensitivity, and adaptive capacity. The indicators were weighted using Principal Component Analysis. Inter-village analysis of the vulnerability index indicated that exposure in a locality is modified by the inherent adaptive capacity of the households, and this determines overall vulnerability. Inter-household analysis of vulnerability indicated that poor households with low adaptive capacity were vulnerable irrespective of their location. The availability of non-farm livelihood opportunities and community access to formal/vocational education and skill development training will reduce household vulnerability to climate change. Policy interventions should focus on improving the adaptive capacity of households, prioritizing financial and human assets.
|
| [40] |
Assessment of the vulnerability of industrial parks to flood in South Korea [J].https://doi.org/10.1007/s11069-016-2222-3 URL [本文引用: 1] 摘要
Since recently, the potential of torrential downpour is increased and the flood damage shows increasing trend, in this study, the method to assess the flood vulnerability was established for the industrial parks, which is the driving power of the economic growth in Korea, and the results were analyzed. The vulnerability of each industrial parks was analyzed using three indicators: climate exposure, sensitivity and the adaptation ability, and the indicator value was calculated by selecting the proxy variable by each indicator. Among the primarily indicators, the final indicators were selected through the site investigation and in-depth interview. The vulnerability assessment was performed not only for the present but for the future (2020s, 2050s and 2100s). In the analysis results, Ulsan Mipo National Industrial Park was the most vulnerable for the present but in 2020s, Gwangyang National Industrial Park and Myeongji-Noksan National Industrial Park in 2050s and 2100s were assessed as most vulnerable. In the results of flooding vulnerability assessment, south coast industrial parks are the most vulnerable region during baseline and future. In addition, such industrial parks mostly built in the early phase of industrialization and they have advantage in import and export but were represented to be highly vulnerable due to aged infrastructures. In the industrial parks, as the enterprises are concentrated, it is easy to exchange the information and logistics, but the damage of natural disasters due to flooding can be aggravated due to the characteristics of the concentration. Actually, there are some cases that the industrial parks and the enterprises received the flooing damage in the highly vulnerable area by the torrential downpour. In this study, the vulnerability assessment was performed for the flooding damage by the torrential downpour for the industrial parks and the potential that the this study can be used as a useful decision-making tool in deciding the priority of adaptation ability was confirmed.
|
| [41] |
Uncertainty and sensitivity analysis techniques as tools for the quality assessment of composite indicators [J].https://doi.org/10.1111/j.1467-985X.2005.00350.x URL [本文引用: 1] 摘要
Summary. Composite indicators are increasingly used for bench-marking countries' performances. Yet doubts are often raised about the robustness of the resulting countries' rankings and about the significance of the associated policy message. We propose the use of uncertainty analysis and sensitivity analysis to gain useful insights during the process of building composite indicators, including a contribution to the indicators' definition of quality and an assessment of the reliability of countries' rankings. We discuss to what extent the use of uncertainty and sensitivity analysis may increase transparency or make policy inference more defensible by applying the methodology to a known composite indicator: the United Nations's technology achievement index.
|
| [42] |
Evaluation of groundwater vulnerability to pollution using fuzzy analytic hierarchy process method [J].https://doi.org/10.1007/s12665-014-4001-3 URL [本文引用: 1] 摘要
Groundwater is the most important source of water supply. But, nowadays the use of groundwater for water supply in the area has been limited by increasing aquifer contamination. In general, this contamination is due to different factors such as rapid urbanization, intensive fertilizer application, industrialization and population. 05uhut Plain (Afyonkarahisar, Turkey) selected to the study area is one of the most important agricultural plains of Turkey where intensive fertilizer and pesticide applications cause the groundwater contamination. Hence, the present study was carried out to develop aquifer vulnerability map for study area using DRASTIC method based on GIS. The rating coefficients of each DRASTIC parameter were determined with the aid of fuzzy analytic hierarchy process (AHP) method and mapped by GIS. In addition, the sensitivity analysis was performed to evaluate the effects of the DRASTIC parameters on the vulnerability map. According to obtained results, the computed DRASTIC vulnerability index is between 0.07902 and 0.29409. Also, groundwater vulnerability map shows that, alluvium unit has very high and high contamination potential which covers 5 and 1702% of the basin, respectively. According to single-parameter sensitivity analysis results, impact of vadose zone and net recharge parameters have the highest effective weights compared with the other parameters. In addition, the soil media parameter has02the lowest mean effective weight value02with 0.0202%.
|
| [43] |
An overview of sustainability assessment methodologies [J].https://doi.org/10.1016/j.ecolind.2008.05.011 URL [本文引用: 1] 摘要
There are number of initiatives working on indicators and frameworks for sustainable development (SD). This article provides an overview various sustainability indices applied in policy practice. The paper also compiles the information related to sustainability indices formulation strategy, scaling, normalisation, weighting and aggregation methodology.
|
| [44] |
Learning from experience: A systematic review of assessments of vulnerability to drought [J].https://doi.org/10.1007/s11069-015-2006-1 URL [本文引用: 2] 摘要
In the last decades, there have been an increasing number of vulnerability studies undertaken in the frameworks of several schools of thought and disciplines. This spur of activity is linked to the gr
|
| [45] |
Social vulnerability indices: A comparative assessment using uncertainty and sensitivity analysis [J].https://doi.org/10.1007/s11069-012-0152-2 URL [本文引用: 1] 摘要
Social vulnerability indices have emerged over the past decade as quantitative measures of the social dimensions of natural hazards vulnerability. But how reliable are the index rankings? Validation of indices with external reference data has posed a persistent challenge in large part because social vulnerability is multidimensional and not directly observable. This article applies global sensitivity analyses to internally validate the methods used in the most common social vulnerability index designs: deductive, hierarchical, and inductive. Uncertainty analysis is performed to assess the robustness of index ranks when reasonable alternative index configurations are modeled. The hierarchical design was found to be the most accurate, while the inductive model was the most precise. Sensitivity analysis is employed to understand which decisions in the vulnerability index construction process have the greatest influence on the stability of output rankings. The deductive index ranks are found to be the most sensitive to the choice of transformation method, hierarchical models to the selection of weighting scheme, and inductive indices to the indicator set and scale of analysis. Specific recommendations for each stage of index construction are provided so that the next generation of social vulnerability indices can be developed with a greater degree of transparency, robustness, and reliability.
|
| [46] |
Drought indicators-based integrated assessment of drought vulnerability: A case study of Bundelkhand droughts in central India [J].https://doi.org/10.1007/s11069-016-2149-8 URL [本文引用: 1] 摘要
Abstract Decision makers face multifaceted challenge in characterizing drought climatology for appropriate water resources-related drought management strategies. This paper focuses on understanding and quantifying the drought vulnerability of Bearma basin in the Bundelkhand region of central India, which is one of the prominent climate extremes that the region is affected by frequently. Regular drought conditions have been prevailing in the region in the last decade with continuous drought from 2004 to 2007. An integrated approach using multiple indicators has been developed to spatially identify the vulnerable regions. The Bearma basin has been selected as a pilot basin to develop a methodology for integrated drought vulnerability assessment adopting spatially and temporally varying drought characteristics represented by drought indicators. The temporally varying indicators include standardized precipitation index (SPI), surface water drought index and groundwater drought index. The spatial information of the indicators was categorized in layers prepared in the spatial domain using a geographic information system, and integrated values of weights of various indicators have been computed on a 50 50 m grid scale. The SPI has been applied to quantify monthly precipitation deficit anomalies on multiple time scales (1, 3, 6 and 12 months). The drought characteristics including frequency, duration and intensity and magnitude have been calculated with the estimated SPI. The multiple indicator approach has been used for arriving at the drought vulnerable zones. The highly vulnerable areas are located in the southern and northern regions of the Bearma basin. It has been observed that more than 26 % of the basin lies in the highly and critically vulnerable classes and consequently has greater drought-related negative impacts. Results show that the proposed method is highly effective in representing assessments of drought vulnerability.
|
| [47] |
A framework for vulnerability analysis in sustainability science [J].https://doi.org/10.1073/pnas.1231335100 URL PMID: 12792023 [本文引用: 3] 摘要
Abstract Global environmental change and sustainability science increasingly recognize the need to address the consequences of changes taking place in the structure and function of the biosphere. These changes raise questions such as: Who and what are vulnerable to the multiple environmental changes underway, and where? Research demonstrates that vulnerability is registered not by exposure to hazards (perturbations and stresses) alone but also resides in the sensitivity and resilience of the system experiencing such hazards. This recognition requires revisions and enlargements in the basic design of vulnerability assessments, including the capacity to treat coupled human-environment systems and those linkages within and without the systems that affect their vulnerability. A vulnerability framework for the assessment of coupled human-environment systems is presented.
|
| [48] |
How did the 2012 drought affect rural livelihoods in vulnerable areas? Empirical evidence from India [J].https://doi.org/10.1016/j.ijdrr.2015.08.002 URL [本文引用: 1] 摘要
This study identifies the severity of impacts of drought in 2012 on domestic water supply, crop production, unskilled rural employment, and financial status of rural households in a drought-prone area of India. It is based on secondary and primary data collected by interviewing 223 households. The data were analyzed using descriptive and inferential applications in SPSS. As a consequence of drought, access to domestic water supply was cumbersome and time spent on water collection activities almost doubled compared with the time required in years with normal rainfall. On average, a respondent household suffered a loss of about 86% in production of major crops. High reductions in on-farm unskilled employment opportunities and an increase in unskilled labor in off-farm rural employment activities were reported. It was found that about 69% of respondents were availing loans and 79% of them delayed repayment of loans due to the consequences of drought. Our results indicated that the extent of drought damage varied according to household size, annual income, landholding size, farming system in use, and drought intensity. The effects of these factors on farming communities are reported with empirical evidence. Respondents with large family size, low to marginal land holding size, low income, and rainfed farming systems are found to be more vulnerable to drought impacts; special attention should be given towards increasing their resilience when designing drought management strategies.
|
| [49] |
Canadian prairie rural communities: Their vulnerabilities and adaptive capacities to drought [J].https://doi.org/10.1007/s11027-010-9262-x URL [本文引用: 1] 摘要
Droughts can have severe negative effects on the environment, society and economy. The drought of 2001–2002 caused severe strain on economic and social activities in western Canada, particularly on rural communities through changes in water resources. This paper examines physical and social vulnerabilities and associated adaptation measures undertaken and the adaptive capacity in communities in the South Saskatchewan River Basin, Canada. Although all of these communities were exposed to the 2001–2002 drought, they had different levels of impacts, resulting in different types of drought adaptation measures, some due to experience with previous droughts and some in response to the 2001–2002 drought. Communities with unreliable water supply were the most vulnerable to these droughts. This vulnerability resulted in historic adaptations being implemented (e.g., Hanna, Alberta) and re-active adaptations (e.g., Cabri, Saskatchewan). It is important to examine the effectiveness of the current adaptive strategies to cope with more extensive and extended drought situations. First Nation communities, such as the Kainai Blood Indian Reserve, have many social and environmental issues but the impacts from the drought were minor. The Reserve had implemented economic changes in the late 1980s to make it less vulnerable to drought but resulted in negative impacts to the Reserve’s social health. It is imperative to determine how vulnerable First Nation communities are and will to improve future adaptive capacity. This paper provides a snap shot view of how Canadian Prairie Communities have adapted to drought and how vulnerable they are to future drought situations.
|
| [50] |
Assessment on agricultural drought vulnerability in the Yellow River basin based on a fuzzy clustering iterative model [J].https://doi.org/10.1007/s11069-013-0617-y URL [本文引用: 2] 摘要
Drought is one of the major natural disasters occurring in China and causes severe impacts on agricultural production and food security. Therefore, agricultural drought vulnerability assessment has an important significance for reducing regional agricultural drought losses and drought disaster risks. In view of agricultural drought vulnerability assessment with the characteristics of multiple factors and uncertainty, we applied the fuzzy comprehensive evaluation framework to agricultural drought vulnerability model. The agricultural drought vulnerability assessment model was constructed based on the multi-layer and multi-index fuzzy clustering iterative method, which can better reveal the drought vulnerability (including sensitivity and adaptation capacity). Furthermore, the cycle iterative algorithm was used to obtain the optimal index weight vector of a given accuracy by setting the objective function. It provides a new approach to weight determination of agricultural drought vulnerability assessment. In this study, agricultural drought vulnerability of 65 cities (as well as leagues and states) in the Yellow River basin was investigated using a fuzzy clustering iterative model and visualized by using GIS technique. The results showed clear differences and regularities among the spatial distribution of agricultural drought vulnerability of different regions. A large number of the regions in the basin consisted of those exhibiting high to very high vulnerability and were mainly distributed throughout Qinghai, Gansu, northern Shaanxi, and southern Shanxi, accounting for 46 % of the total assessment units. However, the regions exhibiting very high vulnerability were not significantly affected by droughts. Most of the regions exhibiting moderate vulnerability (21.5 % of the assessment units) were mainly concentrated among agricultural irrigation areas, where agriculture is highly sensitive to droughts, and drought occurrence in these regions will likely cause heavy losses in the future. The regions exhibiting slight to low vulnerability were relatively concentrated, accounting for 32.3 % of the assessment units, and were mainly distributed in the plains of the lower reaches of the Yellow River, where the economy was rather well developed and the agricultural production conditions were relatively stronger.
|

/
| 〈 |
|
〉 |
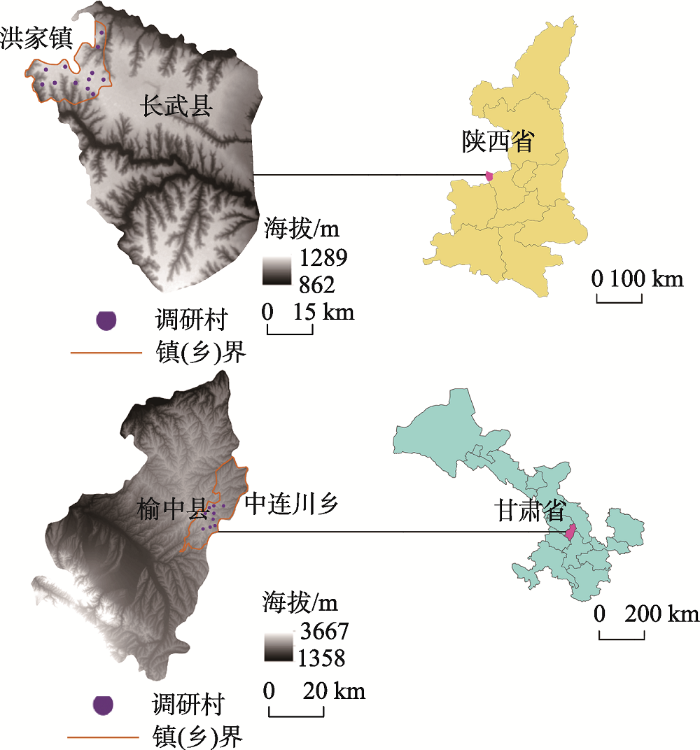
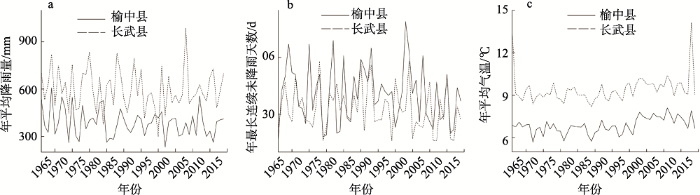

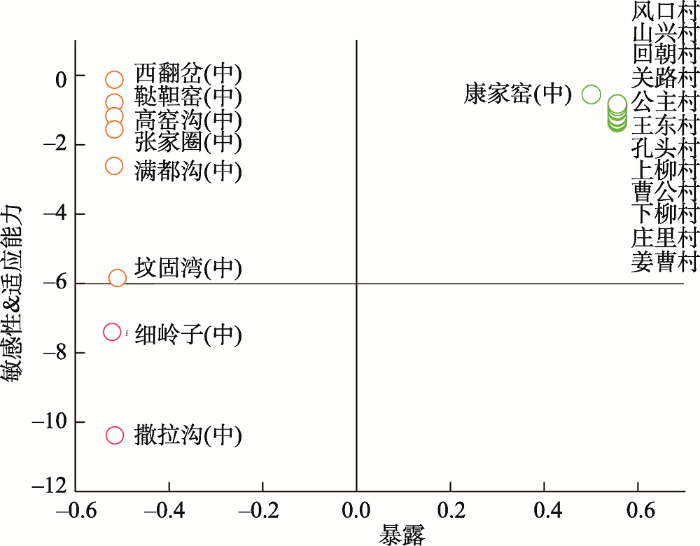

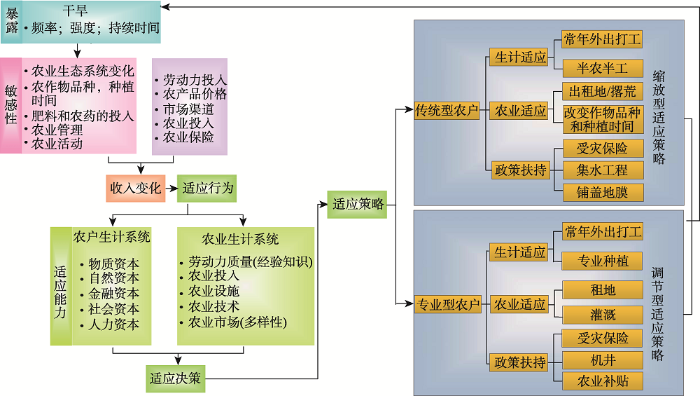

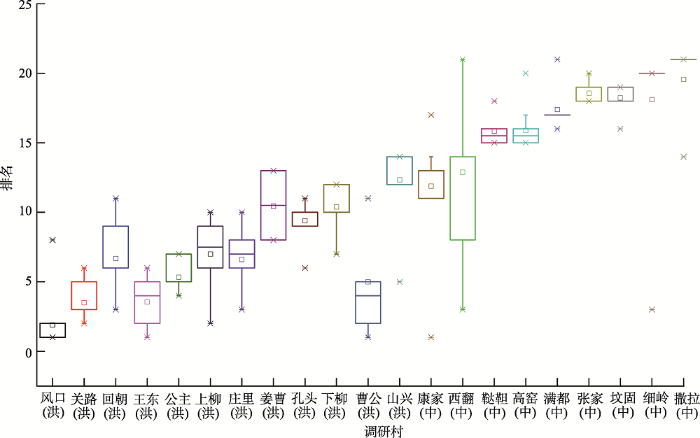