Research progress of the two-step floating catchment area method and extensions
TAO Zhuolin1, 2, , CHENG Yang3, *
1. College of Urban and Environmental Sciences, Peking University, Beijing 100871, China2. School of Urban Planning and Design, Peking University, Shenzhen 518055, Guangdong, China3. School of Geography, Beijing Normal University, Beijing 100875, China
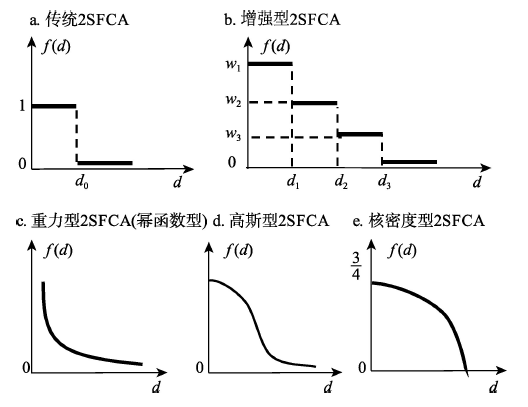
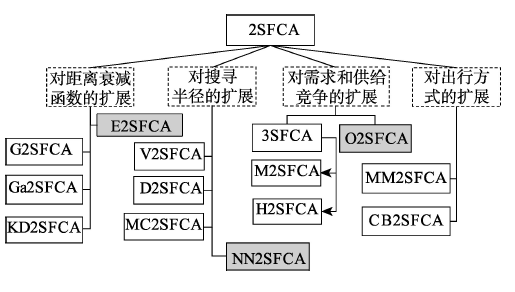
Two-step floating catchment area (2SFCA) method is an important method of research on spatial accessibility to public services, which has been widely applied in studies on the spatial layout of public service facilities. Various extensions of 2SFCA have been developed. However, the application of the 2SFCA method and especially its extensions is still very limited in China. Thus, this study systematically summarizes the major extensions of the 2SFCA method. Such extensions found in existing literature can be classified into four categories. The first category focuses on the distance-decay function, replacing the dichotomous distance-decay form of the original 2SFCA by a multilevel discrete form as in the Enhanced 2SFCA, or continuous forms such as in the gravity-style, Gaussian-style, and Kernel-density-style distance-decay functions. The second category deals with the delimitation of catchment areas. The original 2SFCA form adopts a buffer-ring (BR) method delineating the catchment areas as concentric circles with certain radii of physical distance or travel time. A number of extensions have improved the BR method, including the Variable 2SFCA, the Dynamic 2SFCA, and the Multi Catchment Sizes 2SFCA. Moreover, a novel nearest-neighbor (NN) method for delineating the catchment areas by identifying a finite number of nearest facilities for each demand node has been proposed. The third category strives to improve the accuracy of 2SFCA by accounting for the competition among demand nodes or among supply nodes. The initial extension of this category is the Three-step Floating Catchment Area (3SFCA) method, following which other extensions such as the Modified 2SFCA and the Huff 2SFCA are proposed to make further improvements. The fourth category extends the travel means of the demand side, including the Multi-mode 2SFCA taking into account various potential transportation modes, and the Commuter-based 2SFCA integrating service visits and commuting behavior. The advantages and disadvantages, scenarios appropriate for their application, and potential improvements in the future of these extensions are also discussed. This study can contribute to the choice of method in relevant studies and promote the implementation and development of the 2SFCA method and extensions in relevant research fields in China.
Keywords:two-step floating catchment area method
;
extension
;
distance-decay function
;
catchment area
;
three-step floating catchment area method
;
research progress
TAOZhuolin, CHENGYang. Research progress of the two-step floating catchment area method and extensions[J]. 地理科学进展, 2016, 35(5): 589-599 https://doi.org/10.18306/dlkxjz.2016.05.006
另一个较常用的可达性评价方法为重力模型法,也称为潜能模型(宋正娜等, 2009)。实际上,2SFCA和重力模型法基于同一个理论框架(Luo et al, 2003),都综合考虑了设施的供给规模、需求规模和供需之间的距离关系对可达性的影响,两者的不同在于对距离因素的处理:重力模型法采用了连续型距离衰减函数,从而考虑了设施服务能力随距离衰减的特征,但并未对设施的有效搜寻半径进行限制;而2SFCA法采用二分法处理距离衰减,即在搜寻半径阈值范围内的可达性相同,而在搜寻半径范围之外则完全不可达。
Spatial accessibility of medical services in mountainous regions based on modified two-step floating catchment area method: A case study of Shizhu County, Chongqing
A two-step floating catchment area (2SFCA) method for measuring spatial accessibility to primary healthcare searvice in China: A case study of Donghai County in Jiangsu Province
Research on spatial accessibility of primary school education resources in poverty area based on modified two-step floating catchment area method: A case study of Qianjiang
Accessibility research about urban in-home service facilities for the elderly based on two-step mobile research: Taking low-aging elder people in Shahekou District of Dalian as an example
[J]. Areal Research and Development, 33(6): 27-32.]
Neighborhood social and physical contexts have the ability to impact health and health behaviors of residents. One neighborhood characteristic that remains underexamined in the research is access to health care resources. This research examines potential (geographical) access to primary health care in the city of Mississauga, Ontario, Canada. A modification of the two-step floating catchment area method that better suits the study of locally relevant natural neighborhood units is presented. Potential access to health care is measured in each of Mississauga's neighborhoods considering several spatial and aspatial (i.e., social) characteristics of the population and of physicians, including the raw abundance of physicians, languages spoken by physicians and patients, and whether physicians are accepting new patients. Neighborhood-level results are compared to census tracts. The results of this analysis reveal that potential access significantly differs between neighborhoods for all spatial and aspatial dimensions of access. Accessibility is considerably reduced for linguistic minorities and for those who might not have a dedicated family physician as compared to the general population. This research contributes to the existing body of literature on neighborhoods and health by demonstrating the utility of an alternative methodology for developing a more comprehensive understanding of access to health care within natural geographical neighborhoods.
[20]
DadashpoorH, RostamiF, AlizadehB.2016.
Is inequality in the distribution of urban facilities inequitable: Exploring a method for identifying spatial inequity in an Iranian city
This study evaluates the role of black residential segregation and spatial access to health care in explaining the variation in late-stage diagnosis of breast cancer in metropolitan Detroit. Data pertaining to female breast cancer from 1998 to 2002 are obtained from the Michigan Cancer Surveillance Program. An isolation index is used to assess black segregation. The 2-step floating catchment area approach integrated with a Gaussian function is used to estimate the health care access. While socioeconomic factors at ZIP code level are controlled, ordinary least squares and spatial lag models are used to explore the association between the rates of late-stage diagnosis and segregation and health care access. Results suggest that living in areas with greater black segregation and poorer mammography access significantly increases the risk of late diagnosis of breast cancer. Disadvantaged populations including those with low socioeconomic status or sociocultural barriers tend to experience high rates of late diagnosis. Findings emphasize the need for heightened screening, surveillance, and intervention programs in these areas. Copyright 2010 Elsevier Ltd. All rights reserved.
[22]
Dai DJ.2011.
Racial/ethnic and socioeconomic disparities in urban green space accessibility: Where to intervene
[J]. Landscape and Urban Planning, 102(4): 234-244.
Access to green spaces is important to physical activities and public health, yet one concern remains as to whether the disparities in green space access exist. This study aimed to (1) introduce an approach to quantify potential spatial accessibility to green spaces in a Geographic Information Systems (GIS) environment: and (2) evaluate the racial/ethnic and socioeconomic disparities in green space access. Urban green spaces (n = 890) in metropolitan Atlanta, Georgia were collected from the Atlanta Regional Commission. A Gaussian-based two-step floating catchment area method was adapted to assess the spatial accessibility to green spaces at the census tract level. The Ordinary Least Squares (OLS) model and the spatial lag model were used to evaluate the racial/ethnic and socioeconomic disparities. Results suggest that the spatial accessibility to green spaces in Atlanta was not evenly distributed. Both models show that neighborhoods with a higher concentration of African Americans had significantly poorer access to green spaces (P < 0.05). Asian population had significantly poor access in the OLS model but not in the spatial lag model. Poor access was present in socioeconomically disadvantaged areas as well. Findings can be used for the city and regional planners to target the specific areas for green space development in order to elucidate the disparities. (C) 2011 Elsevier B.V. All rights reserved.
[23]
Dai DJ, Wang FH.2011.
Geographic disparities in accessibility to food stores in southwest Mississippi
[J]. Environment and Planning B: Planning and Design, 38(4): 659-677.
Disparities in accessibility to healthy food are a critical public-health concern. Poor access to reasonably priced, nutritious, and good-quality food may lead to poor diet and increase the risks of health problems such as obesity, diabetes, and cardiovascular diseases. This research advances the popular two-step floating catchment area (2SFCA) method by incorporating a kernel density (KD) function to form the ‘KD2SFCA method’. The study applies the method to measure the spatial access to food stores in southwest Mississippi, and examines the interaction between the spatial access and nonspatial factors. The research shows that neighborhoods with higher scores of urban socioeconomic disadvantage actually have better spatial accessibility to food stores; but higher percentages of carless households and lower income in some neighborhoods may compromise overall accessibility. Neighborhoods with stronger cultural barriers tend to be associated with poorer spatial accessibility. The study clearly differentiates spatial and nonspatial factors in access inequalities, and thus helps policy makers to design corresponding remedial strategies.
[24]
Delamater PL.2013.
Spatial accessibility in suboptimally configured health care systems: A modified two-step floating catchment area (M2SFCA) metric
The floating catchment area (FCA) family of metrics employ principles from gravity-based models to incorporate supply, demand, and distance in their characterization of the spatial accessibility of health care resources. Unlike traditional gravity models, the FCA metrics provide an output in highly interpretable container-like units (e.g., physicians per person). This work explores two significant issues related to FCA metrics. First, the Three Step Floating Catchment Area is critically examined. Next, the research shows that all FCA metrics contain an underlying assumption that supply locations are optimally configured to meet the needs of the population within the system. Because truly optimal configurations are highly unlikely in real-world health care systems, a modified two-step floating catchment area (M2SFCA) metric is offered to address this issue. The M2SFCA is built upon previous FCA metrics, but allows for spatial accessibility to be discounted as a result of the suboptimal configuration of health care facilities within the system. The utility of the new metric is demonstrated through simulated data examples and a case study exploring acute care hospitals in Michigan.
[25]
FransenK, NeutensT, De MaeyerP, et al.2015.
A commuter-based two-step floating catchment area method for measuring spatial accessibility of daycare centers
This paper puts forward a commuter-based version of the two-step floating catchment area (2SFCA) method, which has gained acceptance in studies on spatial health care accessibility. Current implementations of the 2SFCA method are static in that they consider centroid-based night-time representations of the population. The proposed enhancement to the 2SFCA approach addresses this limitation by accounting for trip-chaining . The presented method is illustrated in a case study of accessibility of daycare centers in the province East Flanders in Belgium. The results show significant spatial differences in accessibility between the original and commuter-based version of the 2SFCA (CB2SFCA). They highlight the importance of giving heed to more complex travel in cases where the need for detailed accessibility calculations is apparent.
[26]
JamtshoS, CornerR, DewanA.2015.
Spatio-temporal analysis of spatial accessibility to primary health care in Bhutan
[J]. ISPRS International Journal of Geo-Information, 4(3): 1584-1604.
Geographic information systems (GIS) can be effectively utilized to carry out spatio-temporal analysis of spatial accessibility to primary healthcare services. Spatial accessibility to primary healthcare services is commonly measured using floating catchment area models which are generally defined with three variables; namely, an attractiveness component of the service centre, travel time or distance between the locations of the service centre and the population, and population demand for healthcare services. The nearest-neighbour modified two-step floating catchment area (NN-M2SFCA) model is proposed for computing spatial accessibility indices for the entire country. Accessibility values from 2010 to 2013 for Bhutan were analysed both spatially and temporally by producing accessibility ranking maps, plotting Lorenz curves, and conducting spatial clustering analysis. The spatial accessibility indices of the 205 sub-districts show great disparities in healthcare accessibility in the country. The mean- and median-based classification results indicate that, in 2013, 24 percent of Bhutan鈥檚 population have poor access to primary healthcare services, 66 percent of the population have medium-level access, and 10 percent have good access.
[27]
Kwan MP.1998.
Space-time and integral measures of individual accessibility: A comparative analysis using a point-based framework
ABSTRACT Conventional integral measures of accessibility, although valuable as indicators of place accessibility, have several limitations when used to evaluate individual accessibility. Two alternatives for overcoming some of the difficulties involved are explored in this study. One is to adapt these measures for evaluating individual accessibility using a disaggregate, nonzonal approach. The other is to develop different types of measures based on an alternative conceptual framework. To pursue the former alternative, this study specifies and examines eighteen gravity-type and cumulative-opportunity accessibility measures using a point-based spatial framework. For the latter option, twelve space-time accessibility measures are developed based on the construct of a prism-constrained feasible opportunity set. This paper compares the relationships and spatial patterns of these thirty measures using network-based GIS procedures. Travel diary data collected in Columbus, Ohio, and a digital data set of 10,727 selected land parcels are used for all computation. Results of this study indicate that space-time and integral indices are distinctive types of accessibility measures which reflect different dimensions of the accessibility experience of individuals. Since space-time measures are more capable of capturing interpersonal differences, especially the effect of space-time constraints, they are more “gender sensitive” and helpful for unraveling gender/ethnic differences in accessibility. An important methodological implication is that whether accessibility is observed to be important or different between individuals depends heavily on whether the measure used is capable of revealing the kind of differences the analyst intends to observe.
[28]
LuoJ.2014.
Integrating the Huff model and floating catchment area methods to analyze spatial access to healthcare services
Abstract Analysis of spatial access to healthcare services is critical for effective health resource planning. Gravity-based spatial access models have been widely used to estimate spatial access to healthcare services. Among them, the floating catchment area (FCA) methods have been proved to be informative and helpful to the designation of Health Professional Shortage Areas (HPSAs). This article integrates the Huff Model with the FCA method to articulate population selection on services. Through the proposed approach, population demand on healthcare services is adjusted by a Huff Model-based selection probability that reflects the impacts of both distance impedance and service site capacity. The new approach moderates the over- or under-estimating of population demand that occurred with previous methods. Furthermore, the method uses a continuous distance impedance weight function instead of the arbitrarily defined subzones of previous studies. A case study of spatial access to primary care in Springfield, MO, showed that the proposed method can effectively moderate the population demand on service sites and therefore can generate more reliable spatial access measures.
[29]
LuoW, QiY.2009.
An enhanced two-step floating catchment area (E2SFCA) method for measuring spatial accessibility to primary care physicians
This paper presents an enhancement of the two-step floating catchment area (2SFCA) method for measuring spatial accessibility, addressing the problem of uniform access within the catchment by applying weights to different travel time zones to account for distance decay. The enhancement is proved to be another special case of the gravity model. When applying this enhanced 2SFCA (E2SFCA) to measure the spatial access to primary care physicians in a study area in northern Illinois, we find that it reveals spatial accessibility pattern that is more consistent with intuition and delineates more spatially explicit health professional shortage areas. It is easy to implement in GIS and straightforward to interpret.
[30]
LuoW, Wang FH.2003.
Measures of spatial accessibility to health care in a GIS environment: Synthesis and a case study in the Chicago region
[J]. Environment and Planning B: Planning and Design, 30(6): 865-884.
Abstract Government efforts designed to help improve healthcare access rely on accurate measures of accessibility so that resources can be allocated to truly needy areas. In order to capture the interaction between physicians and populations, various access measures have been utilized, including the popular two-step floating catchment area (2SFCA) method. However, despite the many advantages of 2SFCA, the problems associated with using fixed catchment sizes have not been satisfactorily addressed. We propose a new method to dynamically determine physician and population catchment sizes by incrementally increasing the catchment until a base population and a physician-to-population ratio are met. Preliminary application to the ten-county region in northern Illinois has demonstrated that the new method is effective in determining the appropriate catchment sizes across the urban to suburban/rural continuum and has revealed greater detail in spatial variation of accessibility compared to results using fixed catchment sizes. Copyright 漏 2012 Elsevier Ltd. All rights reserved.
[32]
MaoL, NekorchukD.2013.
Measuring spatial accessibility to healthcare for populations with multiple transportation modes
Few measures of healthcare accessibility have considered multiple transportation modes when people seek healthcare. Based on the framework of the 2 Step Floating Catchment Area Method (2SFCAM), we proposed an innovative method to incorporate transportation modes into the accessibility estimation. Taking Florida, USA, as a study area, we illustrated the implementation of the multi-mode 2SFCAM, and compared the accessibility estimates with those from the traditional single-mode 2SFCAM. The results suggest that the multi-modal method, by accounting for heterogeneity in populations, provides more realistic accessibility estimations, and thus offers a better guidance for policy makers to mitigate health inequity issues.
[33]
MazumdarS, Feng XQ, KoningsP, et al.2014.
A brief report on Primary Care Service Area catchment geographies in New South Wales Australia
[J]. International Journal of Health Geographics, 13(1): 38.
Background To develop a method to use survey data to establish catchment areas of primary care or Primary Care Service Areas. Primary Care Service Areas are small areas, the majority of patients resident in which obtain their primary care services from within the geography. Methods The data are from a large health survey (n =267,153, year 2006–2009) linked to General Practitioner service use data (year 2002–2010) from New South Wales , Australia. Our methods broadly follow those used previously by researchers in the United States of America and Switzerland, with significant modifications to improve robustness. This algorithm allocates post code areas to Primary Care Service Areas that receive the plurality of patient visits from the post code area. Results Consistent with international findings the median Localization Index or the median percentage of patients that obtain their primary care from within a Primary Care Service Area is 55% with localization increasing with rurality. Conclusions With the additional methodological refinements in this study, Australian Primary Care Service Areas have great potential to be of value to policymakers and researchers.
[34]
McGrail MR.2012.
Spatial accessibility of primary health care utilising the two step floating catchment area method: An assessment of recent improvements
[J]. International Journal of Health Geographics, 11(1): 50.
<h2 class="secHeading" id="section_abstract">Abstract</h2><p id="">Quantifying spatial accessibility in relation to the provision of rural health services has proven difficult. This article critically appraises the two-step floating catchment area (2SFCA) method, a recent solution for measuring primary care service accessibility across rural areas of Victoria, Australia. The 2SFCA method is demonstrated to have two fundamental shortcomings – specifically the use of only one catchment size for all populations, and secondly the assumption that proximity is undifferentiated within a catchment (especially problematic when the catchment is large). Despite its advantages over simple population-to-provider ratios, the 2SFCA method needs to be used with caution.</p>
[36]
McGrail MR, Humphreys JS.2014.
Measuring spatial accessibility to primary health care services: Utilising dynamic catchment sizes
The two-step floating catchment area (2SFCA) method continues to be a popular measure of spatial accessibility, especially in relation to primary-level health care. Despite its popularity, most applications of the 2SFCA method are limited by the utilisation of only a single catchment size within a small geographic area. This limitation is significant to health policies which are mostly applied at the state or national scale. In this paper, a five-level dynamic catchment size was trialled within the 2SFCA method to all of Australia, with a population's remoteness used to delineate increasing catchment sizes. Initial trial results highlighted two perverse outcomes which were caused by sudden changes in catchment sizes between each level. Further refinement led to trialling an additional three-level catchment sub-type to the 2SFCA method, which created a smoother transition between remoteness levels. This study has demonstrated an effective approach to dynamically apply variable and more appropriate catchment sizes into different types of rural areas, which for the first time enables the 2SFCA method to be suitable for national-level access modelling and its potential application to health policy.
[37]
Ngui AN, ApparicioP.2011.
Optimizing the two-step floating catchment area method for measuring spatial accessibility to medical clinics in Montreal
We first computed catchments around existing medical clinics of Montreal Island based on the shortest network distance. Population nested in dissemination areas were used to determine potential users of a given medical clinic. To optimize the method, medical clinics (supply) were weighted by the number of physicians working in each clinic, while the previous year's medical clinic users were computed by ten years age group was used as weighting coefficient for potential users of each medical clinic (demand).The spatial accessibility score (SA) increased considerably with the optimisation method. Within a distance of 1 Km, for instance, the maximum clinic accessible for 1,000 persons is 2.4 when the conventional method is used, compared with 27.7 for the optimized method. The t-test indicates a significant difference between the conventional and the optimized 2SFCA methods. Also, results of the differences between the two methods reveal a clustering of residuals when distance increases. In other words, a low threshold would be associated with a lack of precision.Results of this study suggest that a greater effort must be made ameliorate spatial accessibility to medical clinics in Montreal. To ensure that health resources are allocated in the interest of the population, health planners and the government should consider a strategy in the sitting of future clinics which would provide spatial access to the greatest number of people.Accessibility to medical clinics is a contentious issue both in the third world [1-3] and in developed countries [4-6]. Poor access to medical clinics may result in people with simple health problems not consulting a health professional and subsequently developing more complex conditions with irreversible consequences [7]. The Canada Health Act (CHA) recognizes the importance of access to healthcare and states that all Canadians are entitled to receive medical services without barriers or restrictions. At the same time, Canadian provincial hea
[38]
RadkeJ, MuL.2000.
Spatial decompositions, modeling and mapping service regions to predict access to social programs
[J]. Geographic Information Sciences: A Journal of the Association of Chinese Professionals in Geographic Information Systems, 6(2): 105-112.
ABSTRACT Although social programs intend to provide equal access for all, in the final evaluation, fairness of the distribution of services is usually dictated by location. Measuring and predicting access to social services can help these programs adjust and better accommodate under-served regions. A method is proposed which delineates the service area of providers delivering social services and produces a probability metric that maps the equity of the program of services for each household. We begin with a computationally trivial method for delineating service areas, map the probability of households being served, and propose an adjustment process, an allocation, to level access to services. We argue such methods can serve to better locate service providers and insure equity when implementing social programs.
[39]
Tao ZL, ChengY, Dai TQ, et al.2014.
Spatial optimization of residential care facility locations in Beijing, China: Maximum equity in accessibility
[J]. International Journal of Health Geographics, 13(1): 33.
Background The residential care system is rapidly developing and plays an increasingly important role in care for the elderly in Beijing. A noticeable disparity in the accessibility to
[40]
WanN, ZouB, SternbergT.2012.
A three-step floating catchment area method for analyzing spatial access to health services
[J]. International Journal of Geographical Information Science, 26(6): 1073-1089.
Gravity-based spatial access models have been widely used to estimate spatial access to healthcare services in an attempt to capture the interaction of various factors. However, these models are inadequate in informing health resource allocation work due to their inappropriate assumption of healthcare demand. For the purpose of effective healthcare resource planning, this article proposes a three-step floating catchment area (3SFCA) method to minimize the healthcare-demand overestimation problem. Specifically, a spatial impedance-based competition scheme is incorporated into the enhanced two-step floating catchment area (E2SFCA) method to account for a reasonable model of healthcare supply and demand. A case study of spatial access to primary care physicians along the Austin鈥揝an Antonio corridor area in central Texas showed that the proposed method effectively minimizes the overestimation of healthcare demand and reflects a more balanced geographic pattern of spatial access than E2SFCA. In addition, by us...
[41]
Wang FH.2012.
Measurement, optimization, and impact of health care accessibility: A methodological review
[J]. Annals of the Association of American Geographers, 102(5): 1104-1112.
Despite spending more than any other nation on medical care per person, the United States ranks behind other industrialized nations in key health performance measures. A main cause is the deep disparities in access to care and health outcomes. Federal programs such as the designations of Medically Underserved Areas/Populations and Health Professional Shortage Areas are designed to boost the number of health professionals serving these areas and to help alleviate the access problem. Their effectiveness relies first and foremost on an accurate measure of accessibility so that resources can be allocated to truly needy areas. Various measures of accessibility need to be integrated into one framework for comparison and evaluation. Optimization methods can be used to improve the distribution and supply of health care providers to maximize service coverage, minimize travel needs of patients, limit the number of facilities, and maximize health or access equality. Inequality in health care access comes at a personal and societal price, evidenced in disparities in health outcomes, including late-stage cancer diagnosis. This review surveys recent literature on the three named issues with emphasis on methodological advancements and implications for public policy.
[42]
Wang FH, TangQ.2013.
Planning toward equal accessibility to services: A quadratic programming approach
[J]. Environment and Planning B: Planning and Design, 40(2): 195-212.
In the literature various accessibility indices have been developed to assess the relative ease by which the locations of services (supply) can be reached from a residential (demand) location. In this paper we address the planning problem: how the resources can be redistributed to achieve the highest equality of accessibility to the service providers. In particular, a quadratic programming approach is used to minimize the variance of accessibility scores across demand locations by readjusting the amounts of service supplies. Two case studies—job access in Columbus, OH and primary healthcare access in Chicago, IL—are used to illustrate the method. The result suggests that in order to achieve better equality of accessibility, peripheral areas, in general, need additional supplies to compensate for their less-central locations, and some central city areas also need to add supplies to accommodate high demands by the high population density there. Keywords: accessibility index, equal accessibility, quadratic programming, job access, health-care access
 , 程杨
, 程杨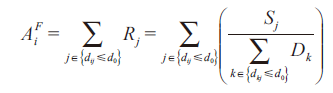 (1)
(1) 