郝志新 , 孙迪
, 孙迪
HAO Zhixin, SUN Di
通讯作者:
收稿日期: 2015-08-25
接受日期: 2015-09-25
网络出版日期: 2016-03-25
版权声明: 2016 地理科学进展 《地理科学进展》杂志 版权所有
基金资助:
作者简介:
作者简介:郝志新(1975-),女,内蒙赤峰人,研究员,主要从事气候变化研究,E-mail: haozx@igsnrr.ac.cn。
展开
摘要
本文根据1901年以来的62次强火山(VEI≥4)喷发年表和英国东安格利亚大学气候研究中心发布的格点气温资料(CRU TS v.3.22),采用时序叠加分析方法,辨识了不同纬度、不同季节强火山喷发对中国温度变化区域差异的影响。结果表明:不同纬度强火山喷发后的1~2年,中国温度基本以下降为主,但降温强度存在显著的区域与季节差异。高纬火山喷发后的显著降温区域发生在东北和东南地区,冬半年温度下降达1.2°C,夏半年温度下降2.0°C;中低纬火山喷发后,冬半年温度的显著下降区域发生在青藏、东南和东中部地区,幅度为1.3~2.2°C,夏半年温度下降幅度比冬半年小;赤道火山喷发后,冬半年温度显著下降区域发生在东北、东南和青藏地区,且降温幅度均大于1.2°C,夏半年西北和东中部地区降温幅度偏小。此外,强火山喷发后第3年,部分地区还出现二次降温现象,降幅甚至超过第一次;然而,同一纬度强火山喷发后,其所造成的降温幅度和降温区域差异与强火山喷发的季节关系不大。
关键词:
Abstract
Based on the chronology of 62 large volcanic eruption events (Volcanic Explosivity Index≥4) since 1901 and gridded CRU TS v.3.22 monthly dataset from the Climatic Research Unit at the University of East Anglia, we examined the effects of large volcanic eruptions by different eruptive latitude bands and seasons on regional difference of temperature in China, using superposed epoch analysis (SEA). The results show that temperature decreased in most regions in 1~2 years after large volcanic eruptions at all latitude bands, but there were clear differences in cooling intensity of different regions and seasons. After volcanic eruptions in high latitude areas, temperature decreased in Northeast and Southeast China by 1.2°C in the winter half-year and 2.0°C in the summer half-year. After middle- and lower-latitudes volcanic eruptions, the cooling regions of the winter half-year were Tibet, Southeast, and Central East China, where the temperature decreased by 1.3~2.2°C; the cooling effects in the summer half-year were less intense than in the winter half-year. After equatorial volcanic eruptions, the winter half-year temperature significantly decreased in Northeast, Southeast, and Tibet, and the cooling magnitudes were greater than 1.2°C; the post-volcanic summer half-year temperature decreased slightly in Northwest and Central East. In some regions secondary cooling occurred in the third year after large volcanic eruptions, and the cooling intensity was even stronger than the initial temperature drop. However, we did not find significant relationship between the cooling magnitude and region and the eruptive seasons of large volcanos of the same latitude bands.
Keywords:
火山活动是影响年至年代际尺度气候变化的重要自然驱动因子;强火山喷发(通常指火山爆发指数VEI≥4的喷发事件)的气候效应一直是气候变化研究领域的重要问题(Robock, 2000)。已有研究表明:强火山喷发把大量含硫气体注入大气层,这些气体经过一系列化学反应在平流层下部形成硫化物气溶胶,同时还通过改变整个大气中的SO2、CO2、H2S、CH4以及微小固体颗粒物平衡,造成大气层的光化学过程异常。气溶胶与水汽混合形成火山云,使到达地表的直接太阳辐射显著减少(最大的月份可达20%~30%),散射太阳辐射增加,从而导致地表总辐射减少,造成降温(Pinto et al, 1989; Zhao et al, 1995);并通过平流层硫化物气溶胶颗粒吸收近红外波段短波辐射、地表及低层大气发射的长波辐射,使平流层增温(Stenchikov et al, 1998; Andronova et al, 1999; Ramachandran et al, 2000)。火山云随大气环流在2~3周内迅速蔓延至全球,影响区域甚至全球气候。通常情况下,一次强火山喷发会导致半球或全球地表平均气温在1~2年内下降0.3℃左右,然后逐渐回升,约4~5年后恢复正常;但其所造成的降温幅度存在区域差异,且因其地理位置、喷发季节等不同而不同;而强火山连续喷发的累积效应则会造成持续性降温。
中国气候受强火山喷发的影响极为显著,许多年际气候异常与强火山喷发事件有关。如1980年5月St.Helens火山喷发,导致自6月上旬开始,30°N以北地区的晴空直接辐射显著减少,造成夏季中纬度晴空直接辐射经向梯度显著增大,使当年7-8月的西太平洋副高及北侧的季风雨带异常偏南,从而造成了严重的江淮冷夏和北旱南涝(徐群, 1986)。1991年菲律宾的Pinatubo火山爆发后,1992年中国出现了大范围的夏秋季气温偏低,特别是夏季东北至内蒙地区和初夏长江下游地区还出现了不同程度的冷害(徐群, 1995)。1815年印尼的Tambora火山爆发使中国大多数地区在1815-1817年出现了夏秋低温冷害,导致云南省的主要农作物连续3年大幅欠收,造成大饥荒(杨煜达等, 2005)。1600年秘鲁的Huaynaputina火山喷发,导致1601年长江中下游地区夏季异常寒冷,黄河中下游夏、秋两季严重霜灾(费杰等, 2008)。公元934年冰岛Eldgjá火山喷发,导致洛阳、开封一带冬季气温甚至下降5~8℃(Fei et al, 2006)。此外,还有一些研究显示:强火山喷发对中国东部地区的夏季旱涝也有一定影响,强火山喷发后华北地区夏季多偏旱(张富国等, 1994)。
目前,中国对强火山喷发导致温度变化的区域差异研究较少。虽有研究显示,1950-1997年间的强火山喷发后中国主要降温区以青藏高原地区为中心,东北及东南沿海地区为升温区(贾朋群等, 2001),但该结果与1980年St.Helens和1991年Pinatubo两次强火山喷发所造成的降温格局(徐群, 1986, 1995)并不一致;这可能与强火山喷发的地理位置、喷发季节不同有关,因为火山灰在上层大气中扩散的传输过程受所处纬度和季节的大气环流特征影响(Robock et al, 2013)。为此,本文拟利用过去百年强火山喷发年表和格点温度数据,采用时序叠加分析方法,辨识不同纬度、不同季节强火山喷发后,中国温度变化的区域差异特征,以期为进一步理解自然外强迫异常造成中国气候变化区域差异的原因及其机制提供依据。
本文所用的温度资料为英国东安格利亚大学气候研究中心(Climatic Research Unit, University of East Anglia, CRU)发布的0.5°×0.5°逐月气温距平格点数据(CRU TS v. 3.22, http://www.cru.uea.ac.uk/cru/data/hrg/)。该数据集是根据世界气象组织(WMO)涵盖的2200个气象观测国际交换站的逐月气温距平(基准时段为1961-1990年)资料插值而得,覆盖时间段为1901-2013年(Harris et al, 2014)。
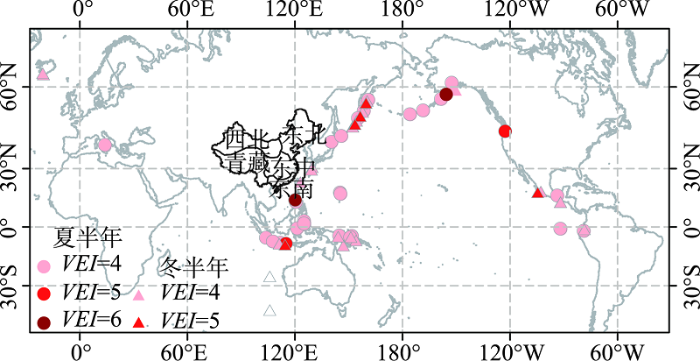
强火山喷发资料取自美国Smithsonian研究院收集、整编的全新世强火山喷发年表(http://volcano.si.edu/search_eruption.cfm; Simkin et al, 1994)。该年表在1901-2013年时段共记录了77次火山喷发指数大于4的事件,本文仅从中选取62次地理纬度位于10°S以北的强火山喷发事件开展相关分析(图1)。
图1 1901-2013年强火山喷发事件空间分布图及中国的5个区域划分范围(引自Ge et al, 2010, 有改动)
Fig.1 Spatial distribution of large volcanic eruptions from 1901 to 2013, and five climate regions of China (adapted from Ge et al, 2010)
为分类统计不同季节和不同纬度喷发的火山对中国气候变化影响的区域差异,将62次火山分成夏半年(4-9月)和冬半年(10月-次年3月)2个时段,10°S~15°N,15°N~50°N和>50°N等3个不同纬度带,具体喷发次数见表1。
表1 1901-2013年各纬度带夏、冬半年的强火山(VEI≥4)喷发事件次数
Tab.1 Numbers of large volcanic eruptions (VEI≥4) by latitude and season, 1901-2013
| 季节 | 位置 | |||
|---|---|---|---|---|
| 赤道两侧 10°S~15°N | 中低纬 15°N~50°N | 高纬 >50°N | 合计 | |
| 夏半年 | 16 | 8 | 10 | 34 |
| 冬半年 | 9 | 8 | 11 | 28 |
| 合计 | 25 | 16 | 21 | 62 |
时序叠加分析 (Superposed Epoch Analysis, SEA)是分析强火山喷发后温度变化趋势的有效手段(Blarquez et al, 2010),目前已用于欧洲强火山爆发后的温度变化区域差异检测。例如,强火山喷发后2年,北欧的6-8月出现大幅降温(约0.52°C);而中欧则在喷发后1年有小幅度降温现象(约0.18°C)(Esper et al, 2013)。利用该方法计算中国温度变化区域差异的具体步骤如下:①利用1960年以来中国年温度变化一致性的分区结果,按东北、西北、东中、青藏、东南5个区域(图1)(Ge et al, 2010)分别计算各区内所有格点逐月气温距平的均值,从而形成1901年以来的各区气温距平序列。②因强火山喷发影响的温度变化信号一般持续1~3年,而ENSO信号为2~7年,为了减弱ENSO信号对温度上升或下降的干扰,采用带通滤波方法,移除温度序列中2~7年的波动信号。③为分析强火山喷发后是否迅速导致冬(10月-次年3月)、夏(4-9月)半年的温度变化,本文计算强火山喷发前、后5年各区的冬、夏气温距平(以1901-2013年的冬半年和夏半年温度平均值为标准)。即以强火山喷发日期所在的冬、夏半年为0点,计算其前、后(不含其所在的冬半年或夏半年)各5个冬、夏半年的气温距平值;但如果强火山发生在某个冬、夏半年的前3个月,则以该冬、夏半年作为第1年,以火山喷发后逐月气温距平的平均值作为第1个冬、夏半年的气温距平,再依次计算其后4年的冬、夏半年气温距平值;同时为了消除气候序列本身的10年尺度变化对判断火山喷发后温度变化趋势的影响,以火山喷发的前5个冬(夏)半年的温度平均值作为基准值,前、后5年分别减去该基准值,从而获得最终的火山喷发前后5年的温度变化序列。
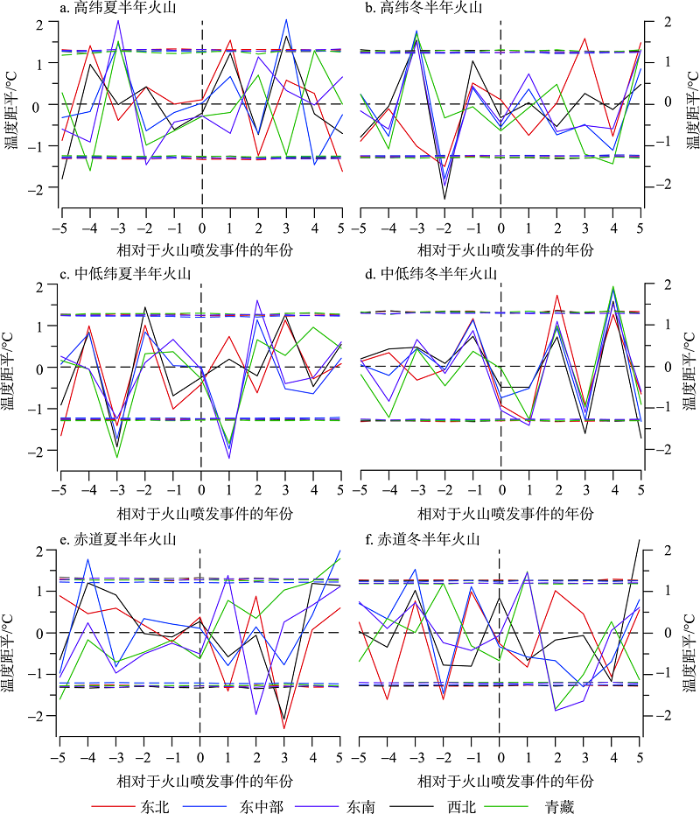
图2的SEA分析结果显示:高纬夏半年和冬半年火山喷发对中国各个区域影响差异较大(图2a-2b),如夏半年的火山喷发后第一年,除东南和青藏地区温度下降外,其他地区温度升高;在随后的第二年,东北、西北和东中部地区温度下降,东南和青藏地区温度上升;至第三年,青藏地区温度再次下降,且降温幅度强于第一年,而其他区域温度上升。冬半年的火山喷发后第一年,东北、青藏地区温度降低,西北地区无上升和下降趋势,其他地区温度上升;至第二年青藏地区温度上升,西北、东中部和东南地区均降温;至第三年,东中部、东南和青藏高原地区均降温,西北和东北地区温度升高。总体上看,高纬喷发的火山对青藏地区的影响主要表现为第三年降温(-1.2°C),东中部和西北地区则表现为第二年降温,幅度大于0.5°C,降温趋势不如青藏高原地区显著。
图2 不同纬度、不同季节的强火山喷发对中国冬半年温度区域差异影响的SEA分析(不同颜色虚直线代表不同区域90%的信度检验水平;所有温度数值为相对于火山喷发前5年的距平值,下同)
Fig.2 Superposed epoch analysis (SEA) for regional differences of winter half-year temperature from the impact of large volcanic eruptions at different latitude bands and seasons(Dashed lines indicate the 90% confidence level for corresponding regions; All SEA time series expressed as temperature anomalies with respect to the 5 years preceding the volcanic events, the same below)
中低纬夏半年和冬半年喷发的火山对冬半年温度的影响较高纬显著(图2c-2d)。当中低纬夏半年火山喷发后,东中部、东南和青藏高原地区降温幅度达1.7~2.2°C,且通过90%可信度检验水平,东北和西北地区温度上升;第二年变化趋势与第一年相反,东北和西北地区开始出现微弱的降温,其余地区温度上升;第三年东中部和东南地区表现出2次降温,但幅度明显小于第一年,为0.4~0.5°C。中低纬冬半年火山喷发后,各区域温度变化一致,均在第一年温度下降,变幅为0.5~1.4°C;第二年温度上升,幅度为0.6~1.7°C;第三年发生2次降温,幅度为0.9~1.6°C,总体降幅强于第一年。
赤道地区冬半年和夏半年火山喷发对中国各区域影响也存在较大差异(图2e-2f)。夏半年火山喷发后的第一年,西北、东北和东中部地区降温0.6~1.4°C,且以东北地区最明显,东南和青藏地区温度上升;第二年间东南和西北地区降温;第三年西北、东北和东中部地区发生2次降温,且降温幅度超过火山喷发后的第一年,达0.8~2.4°C。冬半年火山喷发后的第一年,降温区域也发生在西北、东北和东中部地区,幅度达0.6~0.8°C;第二年和第三年,除东北地区外,其余区域温度下降,其中青藏和东南地区在第二年降温显著,东南和东中部地区则在第三年降温显著。
以上结果显示,不同纬度、不同季节喷发的火山对中国冬半年的温度变化影响具有明显的区域差异。东北地区的降温均发生在火山喷发后1~2年,其中中低纬和高纬夏半年火山喷发,东北地区在第二年降温;其余火山喷发后,东北地区均在第一年降温。东中部地区主要表现为中低纬和赤道火山喷发后,第一年均降温,而高纬火山喷发后则表现为第二年降温。东南地区表现为火山喷发后1~3年降温,特别是冬半年火山喷发导致第二年和第三年温度持续下降。西北地区当赤道附近火山喷发后,产生3年连续降温;高纬和中低纬的火山喷发后以第一年小幅升温,但第二年降温为主。青藏地区主要表现是高纬和中低纬火山喷发后在第一和第三年降温;赤道附近夏半年火山喷发后,温度上升,而冬半年火山喷发后的第二年和第三年温度下降。
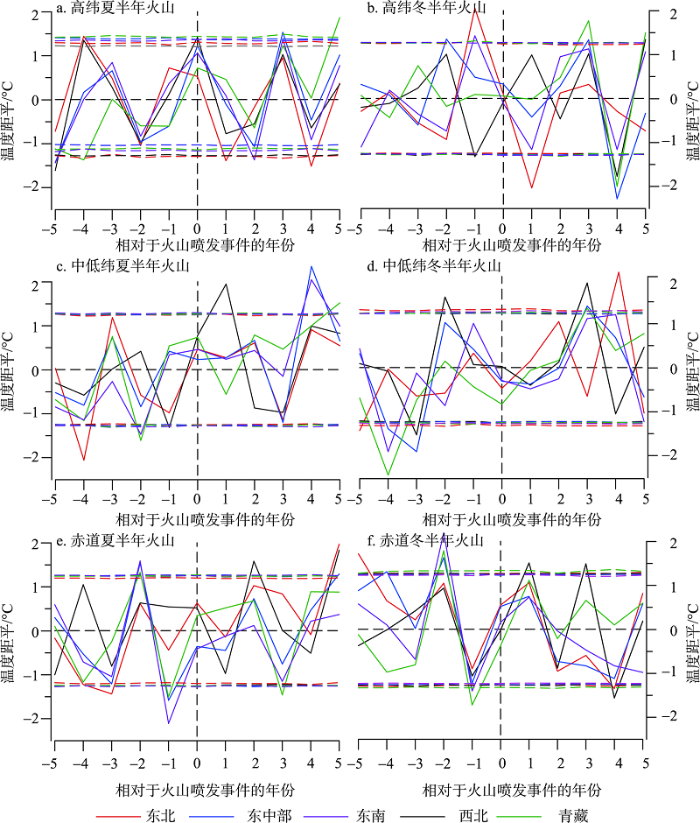
图3的SEA分析结果显示:高纬夏半年和冬半年火山喷发后的降温主要发生在第一年和第二年(图3a-3b)。夏半年火山喷发后的第一年,东南和青藏地区小幅升温;东中部、东北和西北地区降温,其中东北地区降幅最大,达1.4°C;喷发后的第二年,中国所有区域均降温,且以东南地区最为明显,达1.4°C,而青藏地区仅表现为较弱的降温过程。冬半年火山喷发后,东北、东南和东中部地区在第一年降温,最大降温幅度2.0°C,发生在东北地区;西北地区降温出现在第二年;青藏地区在火山喷发后的三年内未出现降温现象。
图3 不同纬度、不同季节的强火山喷发对中国夏半年温度区域差异影响的SEA分析
Fig.3 Superposed epoch analysis (SEA) for regional differences of summer half-year temperature from the impact of large volcanic eruptions at different latitude bands and seasons
中低纬火山喷发后,中国各区域降温现象并不普遍(图3c-3d)。夏半年火山喷发后第一年,降温现象仅发生在青藏地区;第二年也仅有西北地区发生降温;而东北、东中部和东南地区仅在第三年才表现出降温过程,最大降幅为1.2°C(发生在东北和东中部地区)。冬半年火山喷发后的第一年,除东北地区外,其他区域降温,但最大幅度为0.5°C,小于其他火山喷发后的降温幅度;火山喷发后的第二年,仅有东南地区降温,幅度为0.3°C;第三年则只有东北地区降温,幅度为0.6°C。
赤道地区夏半年火山喷发后,各个区域主要表现为第一年和第三年降温;冬半年火山喷发后各区域的降温过程主要发生在第二年(图3e-3f)。具体为:夏半年火山喷发后第一年,除青藏地区外,其他区域均降温,且以西北地区降幅最大,接近1.0°C;喷发后第三年,青藏、东南和东中部地区均降温,且最显著地区发生在青藏地区,幅度达1.4°C;西北地区温度与爆发前5年均值相当;东北地区则呈升温趋势。冬半年火山喷发后的第一年,所有区域均升温;第二年所有区域降温;第三年温度变化表现出一定的区域差异,其中西北和青藏地区升温,东南、东北和东中部地区降温,但降幅较上一年偏小。
上述结果显示:东北地区在高纬火山喷发后的第一年降温,中低纬火山喷发后的第三年降温,赤道夏半年火山喷发后的第一年小幅降温;而赤道冬半年火山喷发后,降温现象发生在第二年和第三年。东中部地区除中低纬夏半年和赤道冬半年的火山喷发后的第三年降温外,其他纬度和季节的火山喷发后均为第一年降温;此外,在赤道冬半年和高纬夏半年火山喷发后也同时存在第二年降温现象。东南地区在高纬冬半年、中低纬冬半年和赤道夏半年火山喷发后第一年降温,高纬夏半年、中低纬冬半年和赤道冬半年火山喷发后的第二年降温,赤道发生火山喷发后的第三年均降温。西北地区在高纬夏半年、中低纬冬半年和赤道夏半年火山喷发后的第一年降温,高纬、中低纬夏半年和赤道冬半年火山喷发后的第二年降温,而第三年降温的现象仅在中低纬夏半年火山喷发事件中检测到。青藏地区除在赤道夏半年火山喷发后的第三年有明显降温外,其余强火山喷发后降温并不明显,如高纬夏半年火山喷发后第二年和中低纬夏半年火山喷发后的第一年,小幅降温约0.5°C;有的甚至出现升温现象。
从图2和图3的显示结果看,不同纬度、不同季节的强火山喷发对中国冬/夏半年温度变化的影响存在明显的区域差异。如果仅从火山喷发纬度看,高纬火山喷发后的第一年,东北地区表现为降温(图2a-2b和图3a-3b共4个统计类别中发生3次,简称3/4,下同);喷发后的第二年,西北和东中部地区多出现降温(4/4和3/4)。中低纬火山喷发后第一年,青藏、东中部和东南部地区多为降温(4/4,3/4和3/4);喷发后的第二年,无一致降温区域;喷发后的第三年,东北地区主要表现为降温(3/4)。赤道火山喷发后第一年,西北、东中部和东北地区降温(均为3/4),喷发后第二年东南和西北地区降温(3/4);喷发后第三年主要降温区域发生在东中部和东南地区(4/4和3/4)。
1901-2013年,不同纬度、不同季节的强火山喷发后中国温度变化的区域差异主要呈现以下几个特征:冬半年温度变化明显的区域主要集中在青藏、东中部地区,其次为东南地区,最后为西北和东北地区。高纬火山喷发后第一年冬季,东中部地区小幅升温约0.4~0.6°C,青藏高原地区小幅降温约0.1~0.2°C;第二年青藏高原地区升温约0.5~0.7°C,东中部和西北地区降温超过0.5°C;第三年青藏高原明显降温约1.2°C,东北地区升温。中低纬火山喷发后,第一年东南、东中部和青藏高原地区均降温,第二年东南、青藏和东中部地区升温,第三年东南和东中部地区降温。赤道火山喷发后,第一年东北、西北和东中部地区降温,东南和青藏地区升温;第二年东北地区升温约0.8~1.0°C,东南地区大幅降温接近2.0°C;第三年东中部地区降温0.7~1.3°C。
中国夏半年温度变化受火山喷发影响的区域较冬半年偏少,主要集中在青藏和东北地区,且各区域升、降温变化差异明显。高纬火山喷发后第一年,东北地区降温明显,约1.3~2.0°C;第二年西北地区降温约0.5°C;第三年各区域升温。中低纬火山喷发后第一年,青藏地区小幅降温,东北地区小幅升温;第二年东北地区持续升温,青藏地区转为升温;第三年东北地区降温,青藏地区继续升温。赤道火山喷发后夏季第一年,青藏地区升温;第三年东中部和东南地区降温0.5~1.0°C。
在目前已有的关于火山个例分析中,如:Graf等(1993)通过对1982年的El Chichón火山和1991年的菲律宾Pinatubo火山喷发后的温度观测和模拟结果分析发现,北半球的高纬地区冬季在火山喷发后的1~2年内明显升温。本文的结果也证实中低纬地区火山喷发后的1~2年东北地区冬季升温,升温幅度分别达0.7°C和1.7°C。但Robock等(1995)的研究发现不同地理位置喷发的火山对温度变化具有明显的区域差异,如强火山喷发后两年的夏季,0~30°N区域降温0.1~0.2°C;30~60°N区域降温0.3°C;热带火山喷发后的第一个冬季,高纬火山喷发后的第二个冬季,北半球、北美和欧亚大陆的高纬地区大幅升温,而亚洲的西南部和非洲北部降温0.5°C。CCSM模式模拟结果发现(Driscoll et al, 2012),小冰期期间4次热带和4次高纬火山喷发后2年的夏季,中国明显降温;但对冬季的影响较复杂,低纬火山喷发后的第一年冬季东北地区升温,第二年冬季发生全国性降温;高纬火山喷发后的第一年中国东北和南方地区升温,第二年降温范围扩大,仅青藏高原升温。这些认识与本文存在一定的差异。主要原因为:他们更强调火山对全球温度变化格局的影响,对中国区域的影响并未细化;没有将火山按照不同季节、更多纬度带分类研究对温度变化区域差异的影响。此外,与温度变化区域差异有关的火山对气候的调节机制和原因仍有待模式的进一步检测和分析。
除了强火山喷发事件外,其他与温度变化年际信号有关的驱动因素,如太阳活动和ENSO也影响中国温度变化的区域差异。侯章栓等(2000)的研究表明,近百年温度变化在5年左右的年际尺度上还受到ENSO的影响。当ENSO事件与强火山喷发事件同时发生时,强火山喷发带来的降温效应会不同程度地被“掩盖”。例如,1982年的El Chichón火山喷发发生在强厄尔尼诺年(Robock, 2000),在其喷发后1~2年间,温度变化与其他火山喷发后的趋势几乎相反,直至第3年才与其他火山喷发所致的温度变化趋势接近(贾朋群等, 2001)。除此之外,太阳活动的11年周期震荡也不同程度影响强火山喷发带来的温度效应。一方面,在1930年代以后太阳常数变化超前于地表温度变化,太阳常数在30年代初-60年代初强度减小,随后的50年代初-70年代末出现降温时段(张博等, 2015),太阳活动减弱和强火山喷发均产生降温效应。
受温度资料时间序列长度的限制,本文开展的不同纬度、不同季节火山喷发对中国区域温度变化影响差异的统计分析,使用的样本量从8~16次火山事件不等,尽管可以从统计结果中发现一定的规律,但仍存在较大不确定性。因此,在本文的基础上,下一步将借助时段足够长的、分辨率较高的温度代用资料研究这一问题,增加统计样本量将有助于改善统计结果的可靠性(Hao et al, 2012; Baillie et al, 2015)。此外,1950年代以前,观测资料的站点主要分布在中国东部地区,而西北地区和青藏高原的观测站点较为稀少,可能影响CRU数据在中国西部地区的插值质量,同时也进一步影响本文对西部地区温度变化的结果分析。
The authors have declared that no competing interests exist.
| [1] |
近百年全球气候变化与外强因子信号检测 [J].
Signal detection of global climate change and external forcing factors [J].
|
| [2] |
公元 1600年秘鲁Huaynaputina火山喷发与长江中下游地区的气候异常 [J].
<p>公元1600年秘鲁Huaynaputina火山喷发是过去1 000年全球最大规模的火山喷发之一。考察了此次火山喷发在中国长江中下游地区的可能气候效应。经查阅中国历史文献,在《见闻杂记》、《袁宏道集》和明清地方志中发现了有价值的资料。此次火山喷发在长江中下游地区的气候效应可能表现得比较复杂。结合《见闻杂记》和明清地方志,发现1601年长江下游地区夏季降雪,异常寒冷;结合《袁宏道集》和明清地方志,发现1602年年初至春季长江中下游地区异常多雪和寒冷,这些气候异常与欧洲历史文献和北半球树轮序列等比较一致。另外,结合《见闻杂记》和明清地方志,还发现1601年秋季长江下游部分地区异常炎热。上述气候异常未必都能完全归因于Huaynaputina喷发,但Huaynaputina喷发应该是其中的一个重要原因。〖</p><p> </p>
The AD 1600 Huaynaputina eruption(peru) and climatic anomalies in the middle and lower reaches of the Yangtze River [J].
<p>公元1600年秘鲁Huaynaputina火山喷发是过去1 000年全球最大规模的火山喷发之一。考察了此次火山喷发在中国长江中下游地区的可能气候效应。经查阅中国历史文献,在《见闻杂记》、《袁宏道集》和明清地方志中发现了有价值的资料。此次火山喷发在长江中下游地区的气候效应可能表现得比较复杂。结合《见闻杂记》和明清地方志,发现1601年长江下游地区夏季降雪,异常寒冷;结合《袁宏道集》和明清地方志,发现1602年年初至春季长江中下游地区异常多雪和寒冷,这些气候异常与欧洲历史文献和北半球树轮序列等比较一致。另外,结合《见闻杂记》和明清地方志,还发现1601年秋季长江下游部分地区异常炎热。上述气候异常未必都能完全归因于Huaynaputina喷发,但Huaynaputina喷发应该是其中的一个重要原因。〖</p><p> </p>
|
| [3] |
近50年火山喷发和太阳活动对我国气候影响的研究 [J].
利用特征向量分析与时序叠加分析和谱分析相结合的方法,分析了近50a来我国地面气温和降水场中火山喷发和太阳活动的气候信号。强烈的火山喷发导致全国大部分地区降温,喷发1a多以后降温最明显,并能持续约半年。除这个主信号以外,青藏高原、东南沿海和东北地区都可能出现较为复杂的温度变化。温度变化与太阳活动之间的联系更多地反映在二者的振荡关系上。在降水场中的火山信号较弱,表现为火山喷发后的秋冬季节南方地区降水偏多。在青藏高原积雪和深层地温的变化中,没有发现火山和太阳活动信号。
Study on the effects of volcanic eruption and solar activity on climate in China in recent 50 years [J].
利用特征向量分析与时序叠加分析和谱分析相结合的方法,分析了近50a来我国地面气温和降水场中火山喷发和太阳活动的气候信号。强烈的火山喷发导致全国大部分地区降温,喷发1a多以后降温最明显,并能持续约半年。除这个主信号以外,青藏高原、东南沿海和东北地区都可能出现较为复杂的温度变化。温度变化与太阳活动之间的联系更多地反映在二者的振荡关系上。在降水场中的火山信号较弱,表现为火山喷发后的秋冬季节南方地区降水偏多。在青藏高原积雪和深层地温的变化中,没有发现火山和太阳活动信号。
|
| [4] |
1980年夏季我国天气气候反常和St.Helens火山爆发的影响 [J].https://doi.org/10.11676/qxxb1986.061 Magsci [本文引用: 2] 摘要
1980年5月18日St.Helens火山大爆发,大量火山灰喷入平流层,围绕北半球中纬度带飘浮.在30°N以北我国东部各站晴空直接辐射量(S)从6月上旬开始异常偏低,夏季S达到近二十余年来的最低值,夏季中纬度S的经向梯度异常增大;相应地,西太平洋副高及北侧的季风雨带在7-8月异常偏南,形成了我国严重的北旱南涝以及江淮冷夏等反常天气气候.本文现就此作物理分析.
The abnormal weather of China for summer 1980 and its relationship with the volcanic eruptions of St.Helens [J].https://doi.org/10.11676/qxxb1986.061 Magsci [本文引用: 2] 摘要
1980年5月18日St.Helens火山大爆发,大量火山灰喷入平流层,围绕北半球中纬度带飘浮.在30°N以北我国东部各站晴空直接辐射量(S)从6月上旬开始异常偏低,夏季S达到近二十余年来的最低值,夏季中纬度S的经向梯度异常增大;相应地,西太平洋副高及北侧的季风雨带在7-8月异常偏南,形成了我国严重的北旱南涝以及江淮冷夏等反常天气气候.本文现就此作物理分析.
|
| [5] |
皮纳图博火山云对1992 年大范围气候的影响 [J].
1991年6月中旬,菲律宾的Pinatubo火山将近二千万吨含硫气溶胶喷入平流层高空,形成了本世纪最大的一次火山云事件。文章叙述了火山云在高空的扩散状况及其对1992年大范围气候的致冷影响。这表现为全球平均气温的明显下降;北半球1 ̄10月(尤其是夏秋季节)气候冷区明显增多,这种气候冷区有从低纬向高纬逐步移动的趋势;而且夏半年在我国也出现了一系列冷害现象。
Influences of Pinatubo volcanic clouds on large scale climate in 1992 [J].
1991年6月中旬,菲律宾的Pinatubo火山将近二千万吨含硫气溶胶喷入平流层高空,形成了本世纪最大的一次火山云事件。文章叙述了火山云在高空的扩散状况及其对1992年大范围气候的致冷影响。这表现为全球平均气温的明显下降;北半球1 ̄10月(尤其是夏秋季节)气候冷区明显增多,这种气候冷区有从低纬向高纬逐步移动的趋势;而且夏半年在我国也出现了一系列冷害现象。
|
| [6] |
嘉庆云南大饥荒(1815-1817)与坦博拉火山喷发 [J].https://doi.org/10.3969/j.issn.0257-0289.2005.01.011 URL [本文引用: 1] 摘要
1815—1817年云南地区 发生长达三年的大饥荒,是云南前近代有记载的波及范围最大、最严重的一次。其灾害类型,是典型的夏秋季低温导致水稻、荞麦等主要农作物的大幅欠收引起的。 这次连续三年的低温冷害以1816年为高峰,其8月的平均气温在昆明可能要比多年平均气温低2.5—3℃。其原因主要是坦博拉火山喷发造成火山云减弱了到 达地球表面的太阳辐射能,太阳活动可能也有一定影响。这次低温在全国范围内都存在,但在东部地区虽有一些极端低温事件,并未造成大范围的灾害。
A serious famine in Yunnan (1815-1817) and the eruption of tambola volcano [J].https://doi.org/10.3969/j.issn.0257-0289.2005.01.011 URL [本文引用: 1] 摘要
1815—1817年云南地区 发生长达三年的大饥荒,是云南前近代有记载的波及范围最大、最严重的一次。其灾害类型,是典型的夏秋季低温导致水稻、荞麦等主要农作物的大幅欠收引起的。 这次连续三年的低温冷害以1816年为高峰,其8月的平均气温在昆明可能要比多年平均气温低2.5—3℃。其原因主要是坦博拉火山喷发造成火山云减弱了到 达地球表面的太阳辐射能,太阳活动可能也有一定影响。这次低温在全国范围内都存在,但在东部地区虽有一些极端低温事件,并未造成大范围的灾害。
|
| [7] |
温室气体、海表面温度、太阳常数及火山活动对中国地表气温影响之初探 [J].https://doi.org/10.3878/j.issn.1006-9585.2014.13171 URL [本文引用: 1] 摘要
利用全球大气环流模式 CAM3.1,对近百年温室气体浓度、全球海表面温度、太阳常数的变化以及火山活动对我国地表气温所产生的影响进行了研究。全球海表面温度的升高及温室气 体浓度的增加是导致中国年平均地表气温升高的部分因素。近百年我国年平均地表气温主要经历了两次年代际振荡并逐渐增温。第一次振荡的冷期为1910年代, 随后变暖,1940年代达暖峰期。第二次振荡冷期发生于1950~1960年代,随后变暖,暖峰期发生在1990年代。太阳常数和全球海表面温度的两次振 荡是造成这两次振荡主要因素,气温、太阳常数和全球海表面温度均发生了准60年周期的年代际振荡,气温振荡的位相落后于太阳常数和全球海表面温度的位相。 20世纪20年代以前及60年代以后火山活动的活跃是导致1910年代和1960~1980年代出现冷期的原因之一。
Influences of greenhouse gas, sea surface temperature, solar constant, and volcanic activity on surface temperature in China [J].https://doi.org/10.3878/j.issn.1006-9585.2014.13171 URL [本文引用: 1] 摘要
利用全球大气环流模式 CAM3.1,对近百年温室气体浓度、全球海表面温度、太阳常数的变化以及火山活动对我国地表气温所产生的影响进行了研究。全球海表面温度的升高及温室气 体浓度的增加是导致中国年平均地表气温升高的部分因素。近百年我国年平均地表气温主要经历了两次年代际振荡并逐渐增温。第一次振荡的冷期为1910年代, 随后变暖,1940年代达暖峰期。第二次振荡冷期发生于1950~1960年代,随后变暖,暖峰期发生在1990年代。太阳常数和全球海表面温度的两次振 荡是造成这两次振荡主要因素,气温、太阳常数和全球海表面温度均发生了准60年周期的年代际振荡,气温振荡的位相落后于太阳常数和全球海表面温度的位相。 20世纪20年代以前及60年代以后火山活动的活跃是导致1910年代和1960~1980年代出现冷期的原因之一。
|
| [8] |
强火山爆发与我国华北地区夏季旱涝的关系 [J].
本文根据我国1470~1990年旱涝型和旱涝等级指数资料,研究了15世纪以来世界8个区域强火山爆发与我国华北旱涝的统计关系,发现火山爆发后1~2a内华北地区夏季以偏旱为主。
The relationship between large volcanic eruptions in the world and the drought and flood of summer for North China [J].
本文根据我国1470~1990年旱涝型和旱涝等级指数资料,研究了15世纪以来世界8个区域强火山爆发与我国华北旱涝的统计关系,发现火山爆发后1~2a内华北地区夏季以偏旱为主。
|
| [9] |
Radiative forcing by volcanic aerosols from 1850 to 1994 [J].https://doi.org/10.1029/1999JD900165 URL [本文引用: 1] 摘要
We use our detailed radiative transfer model and the latitude-altitude distributions of zonal mean optical properties for the Pinatubo aerosol to calculate the time evolution of its instantaneous radiative forcing. We represent the zonal mean of this radiative forcing in terms of the zonal mean optical depth of the Pinatubo aerosol, together with the solar insolation, effective emitting temperature, daylight fraction of a day, and the planetary albedo in the absence of the aerosol. We use this representation, together with the volcano optical depths compiled by Sato et al . [1993], to calculate the instantaneous and adjusted radiative forcing by volcanic aerosols from 1850 to 1994.
|
| [10] |
Tree ring effects and ice core acidities clarify the volcanic record of the first millennium [J].https://doi.org/10.5194/cp-11-105-2015 URL [本文引用: 1] 摘要
In 2012 Plummer et al., in presenting the volcanic chronology of the Antarctic Law Dome ice core, chose to list connections to acid layers in other ice cores and also possible chronological coincidences between ice acid dates and the precise dates of frost damage, and/or reduced growth in North American bristlecone pines. We disagree with the chronological links indicated by Plummer et al. for the period before AD 700, and in this paper we show that a case can be made that better linkages between ice acid and tree ring effects occur for this period if the ice chronologies are systematically moved forward by around 7 years, consistent with a hypothesis published by Baillie in 2008. In the paper we seek to explore the proposition that frost damage rings in North American bristlecone pines are a very useful indicator of the dates of certain large explosive volcanic eruptions; the dating of major eruptions being critical for any clear understanding of volcanic forcing. This paper cannot prove that there is an error in the Greenland Ice Core Chronology 2005 (GICC05), and in equivalent ice chronologies from the Antarctic, however, it does provide a coherent argument for an apparent ice dating offset. If the suggested offset were to prove correct it would be necessary to locate where the error occurs in the ice chronologies and in this regard the dating of the increasingly controversial Icelandic Eldgj谩 eruption in the AD 930s, and the China/Korean Millennium eruption which occurs some 7 years after Eldgj谩, may well be critical. In addition, if the offset were to be substantiated it would have implications for the alleged identification of tephra at 429.3 m in the Greenland GRIP core, currently attributed to the Italian volcano Vesuvius and used as a critical zero error point in the GICC05 chronology.
|
| [11] |
Fire, fuel composition and resilience threshold in subalpine ecosystem [J].https://doi.org/10.1371/journal.pone.0012480 URL PMID: 20814580 [本文引用: 1] 摘要
Forecasting the effects of global changes on high altitude ecosystems requires an understanding of the long-term relationships between biota and forcing factors to identify resilience thresholds. Fire is a crucial forcing factor: both fuel build-up from land-abandonment in European mountains, and more droughts linked to global warming are likely to increase fire risks.To assess the vegetation response to fire on a millennium time-scale, we analyzed evidence of stand-to-local vegetation dynamics derived from sedimentary plant macroremains from two subalpine lakes. Paleobotanical reconstructions at high temporal resolution, together with a fire frequency reconstruction inferred from sedimentary charcoal, were analyzed by Superposed Epoch Analysis to model plant behavior before, during and after fire events.We show that fuel build-up from arolla pine (Pinus cembra) always precedes fires, which is immediately followed by a rapid increase of birch (Betula sp.), then by ericaceous species after 25-75 years, and by herbs after 50-100 years. European larch (Larix decidua), which is the natural co-dominant species of subalpine forests with Pinus cembra, is not sensitive to fire, while the abundance of Pinus cembra is altered within a 150-year period after fires. A long-term trend in vegetation dynamics is apparent, wherein species that abound later in succession are the functional drivers, loading the environment with fuel for fires. This system can only be functional if fires are mainly driven by external factors (e.g. climate), with the mean interval between fires being longer than the minimum time required to reach the late successional stage, here 150 years.Current global warming conditions which increase drought occurrences, combined with the abandonment of land in European mountain areas, creates ideal ecological conditions for the ignition and the spread of fire. A fire return interval of less than 150 years would threaten the dominant species and might override the resilience of subalpine forests.
|
| [12] |
Coupled Model Intercomparison Project 5 (CMIP5) simulations of climate following volcanic eruptions [J].https://doi.org/10.1029/2012JD017607 URL [本文引用: 1] 摘要
[1] The ability of the climate models submitted to the Coupled Model Intercomparison Project 5 (CMIP5) database to simulate the Northern Hemisphere winter climate following a large tropical volcanic eruption is assessed. When sulfate aerosols are produced by volcanic injections into the tropical stratosphere and spread by the stratospheric circulation, it not only causes globally averaged tropospheric cooling but also a localized heating in the lower stratosphere, which can cause major dynamical feedbacks. Observations show a lower stratospheric and surface response during the following one or two Northern Hemisphere (NH) winters, that resembles the positive phase of the North Atlantic Oscillation (NAO). Simulations from 13 CMIP5 models that represent tropical eruptions in the 19th and 20th century are examined, focusing on the large-scale regional impacts associated with the large-scale circulation during the NH winter season. The models generally fail to capture the NH dynamical response following eruptions. They do not sufficiently simulate the observed post-volcanic strengthened NH polar vortex, positive NAO, or NH Eurasian warming pattern, and they tend to overestimate the cooling in the tropical troposphere. The findings are confirmed by a superposed epoch analysis of the NAO index for each model. The study confirms previous similar evaluations and raises concern for the ability of current climate models to simulate the response of a major mode of global circulation variability to external forcings. This is also of concern for the accuracy of geoengineering modeling studies that assess the atmospheric response to stratosphere-injected particles.
|
| [13] |
European summer temperature response to annually dated volcanic eruptions over the past nine centuries [J].https://doi.org/10.1007/s00445-013-0736-z URL [本文引用: 1] 摘要
The drop in temperature following large volcanic eruptions has been identified as an important component of natural climate variability. However, due to the limited number of large eruptions that occurred during the period of instrumental observations, the precise amplitude of post-volcanic cooling is not well constrained. Here we present new evidence on summer temperature cooling over Europe in years following volcanic eruptions. We compile and analyze an updated network of tree-ring maximum latewood density chronologies, spanning the past nine centuries, and compare cooling signatures in this network with exceptionally long instrumental station records and state-of-the-art general circulation models. Results indicate post-volcanic June–August cooling is strongest in Northern Europe 202years after an eruption (610.5265±650.0502°C), whereas in Central Europe the temperature response is smaller and occurs 102year after an eruption (610.1865±650.0702°C). We validate these estimates by comparison with the shorter instrumental network and evaluate the statistical significance of post-volcanic summer temperature cooling in the context of natural climate variability over the past nine centuries. Finding no significant post-volcanic temperature cooling lasting longer than 202years, our results question the ability of large eruptions to initiate long-term temperature changes through feedback mechanisms in the climate system. We discuss the implications of these findings with respect to the response seen in general circulation models and emphasize the importance of considering well-documented, annually dated eruptions when assessing the significance of volcanic forcing on continental-scale temperature variations.
|
| [14] |
The possible climatic impact in China of iceland's Eldgjá eruption inferred from historical sources [J].https://doi.org/10.1007/s10584-005-9012-3 Magsci [本文引用: 1] 摘要
<a name="Abs1"></a>Based on Chinese historical sources, the possible climatic impact in China of the prolonged Eldgjá eruption starting around 934 AD was investigated. An extremely hot summer was reported in 934 AD; hundreds of people died of the intense heat of this summer in Luoyang, the capital of the Later Tang Empire (923–936 AD). Snowless (and possibly also mild) winters probably occurred successively following the Eldgjá eruption until 938 AD. In 939 AD, cold weather set in abruptly and lasted for about 3 years; whereas peak cooling occurred in 939AD. In the summer of 939 AD, it snowed in the southeast of the Inner Mongolia Plateau (about 40–44<sup>∘</sup>N, 113–123<sup>∘</sup>E). From 939AD to 941 AD, hard winters occurred successively in China. Worse, unprecedented drought and plague of locusts broke out in 942 AD and persisted in 943 AD. More than several hundred thousand people were starved to death. This catastrophe was at least partly responsible for the collapse of the Later Jin Dynasty in China. By comparison with the tree-ring evidence and uncovered European historical evidence, the spatial response to the Eldgjá eruption appeared to be complex, whereas hemispheric or global cooling occurred in 939–942 AD.
|
| [15] |
Temperature variation through 2000 years in China: An uncertainty analysis of reconstruction and regional difference [J].https://doi.org/10.1029/2009GL041281 URL [本文引用: 1] 摘要
Twenty-three published proxy temperature series over China spanning the last 2000 years were selected for an uncertainty analysis in five climate regions. Results indicated that, although large uncertainties are found for the period prior to the 16th century, high level of consistency were identified in all regions during the recent 500-years, highlighted by the two cold periods 1620s-1710s and 1800s-1860s, and the warming during the 20th century. The latter started in Tibet, Northwest and Northeast, and migrated to Central East and Southeast. The analysis also indicates that the warming during the 10-14th centuries in some regions might be comparable in magnitude to the warming of the last few decades of the 20th century which was unprecedented within the past 500 years. Citation: Ge, Q.-S., J.-Y. Zheng, Z.-X. Hao, X.-M. Shao, W.-C. Wang, and J. Luterbacher (2010), Temperature variation through 2000 years in China: An uncertainty analysis of reconstruction and regional difference, Geophys. Res. Lett., 37, L03703, doi: 10.1029/2009GL041281.
|
| [16] |
Pinatubo eruption winter climate effects: Model versus observations [J].https://doi.org/10.1007/BF00210011 URL 摘要
Large volcanic eruptions, in addition to the well-known effect of producing global cooling for a year or two, have been observed to produce shorterterm responses in the climate system involving non-linear dynamical processes. In this study, we use the ECHAM2 general circulation model forced with stratospheric aerosols to test some of these ideas. Run in a perpetual-January mode, with tropical stratospheric heating from the volcanic aerosols typical of the 1982 El Chichón eruption or the 1991 Pinatubo eruption, we find a dynamical response with an increased polar night jet in the Northern Hemisphere (NH) and stronger zonal winds which extend down into the troposphere. The Azores High shifts northward with increased tropospheric westerlies at 60°N and increased easterlies at 30°N. Surface temperatures are higher both in northern Eurasia and North America, in agreement with observations for the NH winters of 1982–83 and 1991–92 as well as the winters following the other 10 largest volcanic eruptions since 1883.
|
| [17] |
Winter temperature variations over the middle and lower reaches of the Yangtze River since 1736 AD [J].https://doi.org/10.5194/cp-8-1023-2012 URL [本文引用: 1] 摘要
ABSTRACT We present statistically reconstructed mean annual winter (December-February) temperatures from the middle and lower reaches of the Yangtze River (24° N-34° N, 108° E-123° E within mainland China) extending back to 1736. The reconstructions are based on information regarding snowfall days from historical documents of the Yu-Xue-Fen-Cun archive recorded during the Qing Dynasty (1644-1911). This information is calibrated with regional winter temperature series spanning the period from 1951 to 2007. The gap from 1912 to 1950 is filled using early instrumental observations. With the reference period of 1951-2007, the 18th century was 0.76 °C colder, and the 19th century was 1.18 °C colder. However, since the 20th century, the climate has been in a warming phase, particularly in the last 30 yr, and the mean temperature from 1981 to 2007 was 0.25 °C higher than that of the reference period of 1951-2007, representing the highest temperatures of the past 300 yr. Uncertainty existed for the period prior to 1900, and possible causes of this uncertainty, such as physical processes involved in the interaction between temperature and snowfall days and changing of observers, are discussed herein.
|
| [18] |
Updated high-resolution grids of monthly climatic observations-the CRU TS3.10 Dataset [J].https://doi.org/10.1002/joc.3711 Magsci [本文引用: 1] 摘要
<p>This paper describes the construction of an updated gridded climate dataset (referred to as CRU TS3.10) from monthly observations at meteorological stations across the world's land areas. Station anomalies (from 1961 to 1990 means) were interpolated into 0.5° latitude/longitude grid cells covering the global land surface (excluding Antarctica), and combined with an existing climatology to obtain absolute monthly values. The dataset includes six mostly independent climate variables (mean temperature, diurnal temperature range, precipitation, wet-day frequency, vapour pressure and cloud cover). Maximum and minimum temperatures have been arithmetically derived from these. Secondary variables (frost day frequency and potential evapotranspiration) have been estimated from the six primary variables using well-known formulae. Time series for hemispheric averages and 20 large sub-continental scale regions were calculated (for mean, maximum and minimum temperature and precipitation totals) and compared to a number of similar gridded products. The new dataset compares very favourably, with the major deviations mostly in regions and/or time periods with sparser observational data. CRU TS3.10 includes diagnostics associated with each interpolated value that indicates the number of stations used in the interpolation, allowing determination of the reliability of values in an objective way. This gridded product will be publicly available, including the input station series (<!--TODO: clickthrough URL--><a href="http://www.cru.uea.ac.uk/" title="Link to external resource: http://www.cru.uea.ac.uk/" shape="rect">http://www.cru.uea.ac.uk/</a> and <!--TODO: clickthrough URL--><a href="http://badc.nerc.ac.uk/data/cru/" title="Link to external resource: http://badc.nerc.ac.uk/data/cru/" shape="rect">http://badc.nerc.ac.uk/data/cru/</a>). © 2013 Royal Meteorological Society</p>
|
| [19] |
Self-limiting physical and chemical effects in volcanic eruption clouds [J].https://doi.org/10.1029/JD094iD08p11165 URL [本文引用: 1] 摘要
One-dimensional aerosol microphysical and photochemical models are used to study the chemistry of stratospheric volcanic clouds. The results indicate that the aerosol microphysical processes of condensation and coagulation produce larger particles as the SO2 injection rate is increased. Larger particles have a smaller optical depth per unit mass and settle out of the stratosphere at a faster rate than smaller ones, restricting the total number of particles in the stratosphere. The microphysical processes moderate the impact of volcanic clouds on the earth's radiation budget and climate, suggesting that volcanic effects may be self limiting. It is noted that the injection of HCl into the stratosphere, which could lead to large ozone changes, is limited by a cold trap effect in which HCl and water vapor condense on ash particles in the rising volcanic plume and fall out as ice.
|
| [20] |
Radiative impact of the Mount Pinatubo volcanic eruption: Lower stratospheric response [J].https://doi.org/10.1029/2000JD900355 URL [本文引用: 1] 摘要
Volcanic aerosols in the stratosphere produce significant transitory solar and infrared radiative perturbations, which warm the stratosphere, cool the surface and affect stratospheric circulation. In this study, using the Geophysical Fluid Dynamics Laboratory SKYHI general circulation model (GCM) with a high vertical resolution and a recently improved radiative transfer code, we investigate the aerosol radiative forcing and the stratospheric temperature response for the June 15, 1991, Mount Pinatubo eruption, the most well observed and largest volcanic eruption of the 20th Century. The investigation is carried out using an updated, comprehensive monthly and zonal-mean Pinatubo aerosol spectral optical properties data set. While the near-infrared solar spectral effects contribute substantially to the total stratospheric heating due to aerosols, over the entire global domain the longwave component exceeds the solar in causing a warming of the lower stratosphere (30-100 hPa). In contrast, the magnitude of the solar perturbation (increased reflection) in the overall surface-atmosphere radiative heat balance exceeds that due to the longwave (infrared trapping effect). The troposphere affects the stratospheric radiative forcing, mainly because of the dependence of the reflected solar and upward longwave radiation on cloudiness, and this adds to the uncertainty in the calculation of the stratospheric temperature response. A four-member ensemble of 2-year GCM integrations (June 1991 to May 1993) were performed using fixed sea surface temperatures and a cloud prediction scheme, one set with and another without the volcanic aerosols. The temperature of the tropical lower stratosphere increases by a statistically significant 3 K, which is almost 1 K less than in previous investigations that employed coarser vertical resolution in the stratosphere, but is still larger than observed. In the low latitudes the evolution of the simulated temperature response mimics that observed only through about the first year. Thereafter, despite a significant aerosol optical depth perturbation in the tropical atmosphere, there is a lack of a signature in the temperature response that can be unambiguously attributed to the Pinatubo aerosols, suggesting other forced or unforced variations (e.g., ozone changes, quasi-biennial oscillation) occurring in the actual atmosphere which are unaccounted for in the model. In the high latitudes the large interannual variability prohibits a clear quantitative comparison between simulated and observed temperature changes and renders the aerosol-induced thermal signals statistically insignificant. In the global mean the evolution of the simulated lower stratospheric temperature response is in excellent agreement with the observation for the entire 2-year period, in contrast to the model-observation comparison at the low latitudes. This arises because in the global mean the stratospheric response is not sensitive to dynamical adjustments within the atmosphere caused by internal variations, and depends principally on the external radiative forcing caused by the aerosols.
|
| [21] |
Volcanic eruptions and climate [J].https://doi.org/10.1029/1998RG000054 URL [本文引用: 2] 摘要
Volcanic eruptions are an important natural cause of climate change on many timescales. A new capability to predict the climatic response to a large tropical eruption for the succeeding 2 years will prove valuable to society. In addition, to detect and attribute anthropogenic influences on climate, including effects of greenhouse gases, aerosols, and ozone-depleting chemicals, it is crucial to quantify the natural fluctuations so as to separate them from anthropogenic fluctuations in the climate record. Studying the responses of climate to volcanic eruptions also helps us to better understand important radiative and dynamical processes that respond in the climate system to both natural and anthropogenic forcings. Furthermore, modeling the effects of volcanic eruptions helps us to improve climate models that are needed to study anthropogenic effects. Large volcanic eruptions inject sulfur gases into the stratosphere, which convert to sulfate aerosols with an e -folding residence time of about 1 year. Large ash particles fall out much quicker. The radiative and chemical effects of this aerosol cloud produce responses in the climate system. By scattering some solar radiation back to space, the aerosols cool the surface, but by absorbing both solar and terrestrial radiation, the aerosol layer heats the stratosphere. For a tropical eruption this heating is larger in the tropics than in the high latitudes, producing an enhanced pole-to-equator temperature gradient, especially in winter. In the Northern Hemisphere winter this enhanced gradient produces a stronger polar vortex, and this stronger jet stream produces a characteristic stationary wave pattern of tropospheric circulation, resulting in winter warming of Northern Hemisphere continents. This indirect advective effect on temperature is stronger than the radiative cooling effect that dominates at lower latitudes and in the summer. The volcanic aerosols also serve as surfaces for heterogeneous chemical reactions that destroy stratospheric ozone, which lowers ultraviolet absorption and reduces the radiative heating in the lower stratosphere, but the net effect is still heating. Because this chemical effect depends on the presence of anthropogenic chlorine, it has only become important in recent decades. For a few days after an eruption the amplitude of the diurnal cycle of surface air temperature is reduced under the cloud. On a much longer timescale, volcanic effects played a large role in interdecadal climate change of the Little Ice Age. There is no perfect index of past volcanism, but more ice cores from Greenland and Antarctica will improve the record. There is no evidence that volcanic eruptions produce El Ni帽o events, but the climatic effects of El Ni帽o and volcanic eruptions must be separated to understand the climatic response to each.
|
| [22] |
The volcanic signal in surface temperature observations [J].https://doi.org/10.1175/1520-0442(1995)008<1086:TVSIST>2.0.CO;2 URL 摘要
Climate records of the past 140 years are examined for the impact of major volcanic eruptions on surface temperature. After the low-frequency variations and El Ni09o/Southern Oscillation signal are removed, it is shown that for 2 years following great volcanic eruptions, the surface cools significantly by 0.1°-0.2°C in the global mean, in each hemisphere, and in the summer in the latitude bands 0°-30°S and 0°-30°N and by 0.3°C in the summer in the latitude band 30°-30°60°N. By contrast, in the first winter after major tropical eruptions and in the second winter after major high-latitude eruptions, North America and Eurasia warm by several degrees, while northern Africa and southwestern Asia cool by more than 0.5°C.Because several large eruptions occurred at the same time as ENSO events, the warming produced by the ENSO masked the volcanic cooling during the first year after the eruption. The timescale of the ENSO response is only 1 year while the volcanic response timescale is 2 years, so the cooling in the second year is evident whether the ENSO signal is removed or not.These results, both the global cooling and Northern Hemisphere continental winter warming, agree with general circulation model calculations.
|
| [23] |
Volcanism and the earth's atmosphere [M]. |
| [24] |
|
| [25] |
Radiative forcing from the 1991 Mount Pinatubo volcanic eruption [J].https://doi.org/10.1029/98JD00693 URL [本文引用: 1] |
| [26] |
A model simulation of Pinatubo volcanic aerosols in the stratosphere [J].https://doi.org/10.1016/S0168-8278(98)80373-5 URL [本文引用: 1] 摘要
Gollan JL, Gollan TJ.
|

/
| 〈 |
|
〉 |