焦利民 , 唐欣
, 唐欣
JIAO Limin, TANG Xin
版权声明: 2016 地理科学进展 《地理科学进展》杂志 版权所有
基金资助:
作者简介:
作者简介:焦利民(1977-),男,河南安阳人,教授,博士生导师,主要从事土地利用/覆盖变化、城市扩展、空间分析等方面的研究,E-mail: lmjiao027@163.com。
展开
摘要
在城市群发展的不同阶段,城市扩张表现出不同的时空特征。从城市群视角研究城市扩张的时空规律,对于理解城市扩张与城市群网络化组织结构之间的复杂耦合关系具有重要意义。本文以长江三角洲城市群为例,基于交通网络、引力模型和空间句法模型,结合1980、1990、2000和2010年Landsat遥感影像提取建设用地扩张信息,计算城市扩张强度与速度指标;采用核心城市可达性与空间相互作用力强度分析城市的交通网络区位;采用空间句法模型计算城市交通网络的通达性和城市在城市群交通路网中的地位。结果表明:城市扩张强度与核心城市可达性、核心城市空间相互作用力强度、空间句法变量指标呈正相关关系。城市扩张速度与上述指标在第一阶段(1980-1990年)和第二阶段(1990-2000年)呈正相关关系;但在第三阶段(2000-2010年)整体表现为负相关,分布在城市群外围、交通路网联系程度较低的城市扩张速度更快,呈现出空间收敛的趋势。表明城市群中的城市空间联系在城市扩张中起到重要但又不断演变的作用,研究结果对于长三角城市群规划和其他城市群城市扩张调控具有借鉴意义。
关键词:
Abstract
Urban expansion displays varied spatial characteristics in different periods of urban agglomeration development. Studying the spatial and temporal patterns of urban expansion from the perspective of urban agglomeration is important for understanding the complex relationship between urban expansion and network structure of urban agglomerations. In this study we analyzed urban expansion in the Yangtze River Delta urban agglomeration based on road network, a gravity model, and a space syntax model. Construction land expansion was obtained from Landsat remote sensing data in 1980, 1990, 2000, and 2010 and then was used to calculate intensity and speed of urban expansion. Position of cities in the traffic network of the urban agglomeration was analyzed by accessibility to and spatial interaction intensity of core cities. The space syntax model was used to compute accessibility of the road network and the status of a city in the network of the urban agglomeration. The results show that, first, urban expansion intensity displayed a positive correlation with accessibility to core cities, spatial interaction intensity of core cities, and space syntax indicators. Second, there was a positive correlation between urban expansion velocity and indicators identified above in the first (1980-1990) and second (1990-2000) periods. However, it exhibited a negative correlation in the third period (2000-2010). Cities with a relatively poor interconnectivity of traffic network and located in the periphery of the urban agglomeration developed more quickly in the last time period, displaying a trend of spatial convergence. This study shows that spatial linkage played an important but evolving role in urban expansion within the urban agglomeration of the Yangtze River Delta. In addition, it serves as a reference for the planning of the Yangtze River Delta urban agglomeration and the regulation of urban expansion of other urban agglomerations.
Keywords:
随着城镇化的发展,在世界各地逐步形成了在一定地域内具有层级结构、网络化组织和相互联系的城市群。城市群内部的城市增长已不是城镇化初期各城市孤立的发展,而是在城市之间相互作用影响下的协同发展。目前中国正在编制和实施以城市群为主体形态的城市空间战略规划。从城市群的整体视角研究城市扩张的规律和机制,对于城市群发展空间规划决策具有重要意义。
过去对城市扩张的分析大多局限于对单个城市分析或者孤立地分析区域系统内各个城市的城市扩张(Liu et al, 2010; Liu et al, 2014; Jiao, 2015; Jiao et al, 2015),很少从区域内城市间联系的角度来研究城市扩张。相关研究表明,区域内城市的相对位置、交通路网等因素都是影响城市扩张的驱动力(Lu et al, 2013; 冯志新等, 2014)。通过分析城市相对位置与交通路网通达性可定量计算城市群内城市联系的紧密程度。城市相对位置主要采用核心城市可达性与作用力测算。Wu等(2013)认为,区域中心城市对周围城市的发展会产生辐射影响,带动其发展。Sohn(2012)认为,到区域核心城市的距离会影响周围城市人口增长。空间相互作用强度可定量测算核心城市对其他城市的辐射作用(关伟等, 2014),引力模型则是测算空间相互作用的有效方法(杨丽华等, 2014)。交通路网将城市群内各城市有机联系成一个整体,空间句法模型主要揭示交通路网联系的紧密程度。在城市扩张过程中,交通路网发挥着日益重要的作用(李京涛等, 2014; Iacono et al, 2016)。Jiang等(2000)提出运用空间句法模型来定量分析城市空间形态。该方法后被研究者广泛应用于单个城市的道路网分析(刘承良等, 2015),以及城市群的路网通达性分析(朱桃杏等, 2011)。目前,基于区域城市间空间联系的方法来分析城市扩张的研究尚少;但随着城镇化进程的加快,基于城市群的整体视角研究城市扩张的规律和机制更加符合现势性。
长江三角洲城市群是中国经济最发达、城镇集聚程度最高的城镇化地区,也是世界六大城市群之一。由于率先经历了城镇化历程,城市扩张尤为迅速。本文以长江三角洲城市群为研究区,基于城市相对位置和交通路网,定量分析其空间联系与城市扩张之间的相关关系,以期为今后从城市间联系的角度研究其他城市群的城市扩张现象提供借鉴。
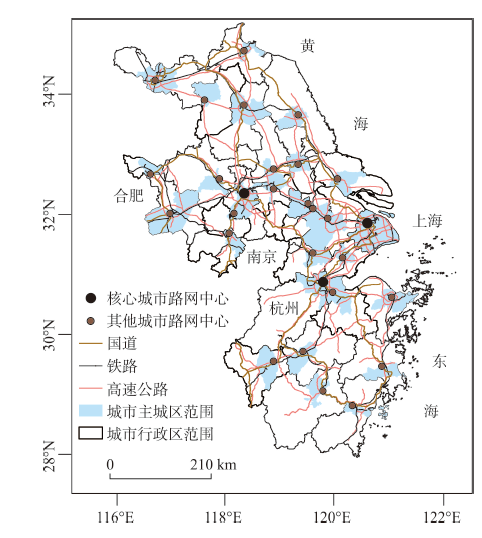
长江三角洲城市群位于中国东部(27°3′N~35°07′N,117°09′E~122°6′E之间),面积25.12万km2。根据《中国城市群发展报告》(刘士林等, 2014),长江三角洲城市群包括:上海市,江苏省和浙江省的全部地级及以上城市,安徽省的合肥市、芜湖市、淮南市、马鞍山市、滁州市等共30个城市(图1)。由于主要考虑道路交通与城市扩张的时空关系,而浙江省舟山市与其他城市相连的道路交通2009年底才开通,故本文并未将舟山市包含在研究区内。
图1 2010年长江三角洲城市群主要道路网分布图
Fig.1 Network of main roads in the Yangtze River Delta (YRD) region in 2010
研究数据包括主城区建设用地数据、主城区人口数据和道路交通数据。综合考虑地理意义的城市范围与统计年鉴数据的有效结合,选取长江三角洲城市群各城市市辖区范围作为其主城区。城市主城区建设用地数据采用1980、1990、2000和2010年的Landsat TM/ETM+的遥感影像(空间分辨率为30 m),运用监督分类的方法,提取上述年份的建设用地。城市主城区人口数据采用第六次全国人口普查得到的2010年主城区常住人口数据。道路交通数据包括铁路、高速公路和国道,基于2010年OpenStreetMap的道路数据,并根据上述道路开通时间进行修正,得到1990和2000年的道路数据。
采用3个指标定量计算主城区城市扩张水平:建设用地年均增长量(AI)、建设用地年均增长率(AGR)和各阶段建设用地扩张程度(AE)(以10年为一个阶段,即第一阶段(1980-1990年)、第二阶段(1991-2000年)、第三阶段(2001-2010年)。AI(单位为km2/a)直接测算建设用地面积年均变化量,揭示同一城市在不同阶段扩张水平的差异。AGR(单位为%)去除城市规模效应的影响,比较不同城市在同一时期扩张速度的差异。AE(单位为%)是指城市主城区在不同阶段建设用地增长量占其主城区面积的百分比,可以比较不同时期建设用地扩张的强度。其公式为:
式中:Aend表示某一时期末的主城区建设用地面积;
引力模型综合考虑距离衰减原理和牛顿万有引力定律,计算两城市的空间相互作用力大小。其公式为:
式中:
空间句法变量用于表示交通路网的通达性、空间联系的紧密程度等。其中,连接值用来表示路网轴线的局部联系,集成程度值和全局整合度值用来表示轴线的全局联系。通常局部连接性好的轴线全局连接能力也高。城市群中连接城市间的交通路网主要是铁路、高速公路和国道,针对不同类型交通路网,分别通过分区统计功能计算各个城市的总连接值,集成程度值和总全局整合度值。
(1) 连接值(Ci),即城市中各道路的连接值,表示某条轴线(道路)i在整个拓扑网络中的连接能力,其公式为:
式中:K表示道路i(i=1, 2, 3, ..., n)直接相邻的道路条数;
(2) 集成程度(
式中:
(3) 总全局整合度(
式中:n为城市内的总轴线数;深度值可标准化为相对不对称值
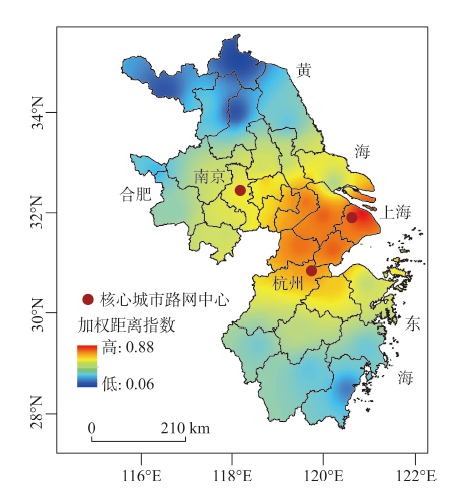
加权距离指数是路网距离经过加权标准化后的结果,表征区域内各城市到核心城市的邻近程度。计算城市到3个核心城市的高速公路和铁路的路网距离,并计算以各个核心城市的GDP和人口规模设定其辐射能力的权重系数,最后通过min-max标准化处理得到各城市的加权距离指数。其公式为:
式中:
采用核心城市可达性与核心城市空间相互作用强度分析城市相对位置。到核心城市的交通路网距离可以定量计算核心城市的可达性;采用引力模型计算各城市受到核心城市作用力大小。前者重点从到核心城市距离的角度分析城市相对位置,后者则在距离的基础上考虑城市本身规模的影响。本文通过两者结合来定量分析城市在城市群中的相对位置。
基于以下指标确定区域核心城市:研究期内(1980-2010年)城市主城区GDP、城市主城区常住人口、基于空间句法变量得出的城市在城市群交通路网中的地位。上海市、南京市和杭州市在研究期内上述各指标值均为长江三角洲城市群的前3位,并且均为区域政治中心。综上,选取上海市、南京市和杭州市作为长江三角洲城市群的区域核心城市。
4.1.1 核心城市可达性与城市扩张的关联分析
加权距离指数分析核心城市的可达性,核心城市的可达性测算城市在城市群体系中的相对区位,并进行其与城市扩张之间的关联分析。基于加权距离指数值,将29个城市按照数值由大到小,平均分为6级,其中前5级各5个城市,第六级4个城市(表1)。
表1 基于加权距离指数分级结果
Tab.1 Classification result based on the weighted distance index
| 级 别 | 城市 | 1980年主城区面积/km2 | |
|---|---|---|---|
| 1 | 0.81 | 上海市、苏州市、嘉兴市、湖州市、无锡市 | 166.10 |
| 2 | 0.68 | 常州市、杭州市、绍兴市、镇江市、南京市 | 123.04 |
| 3 | 0.53 | 马鞍山市、扬州市、滁州市、芜湖市、宁波市 | 55.31 |
| 4 | 0.44 | 泰州市、金华市、南通市、合肥市、衢州市 | 59.65 |
| 5 | 0.31 | 台州市、盐城市、宿迁市、丽水市、淮南市 | 63.54 |
| 6 | 0.13 | 温州市、徐州市、淮安市、连云港市 | 93.03 |
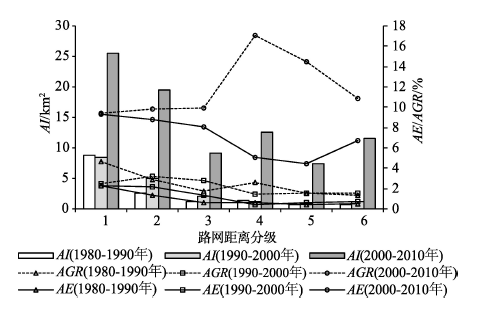
图2是基于路网距离得到各城市的加权距离指数,采用反距离加权法得到距离指数的空间插值图。从图3可以看出,总体而言,距离城市群区域中心越近的城市,城市扩张强度(AI和AE)越大。2000年后,中国进入快速城镇化进程,距离区域中心较远的城市这一趋势波动较大。由于区域核心城市的影响范围、辐射半径有限,位于城市群边缘的城市建设用地扩张强度与核心城市可达性之间的相关关系不明显。从表2可见,核心城市可达性与城市扩张指标在第二阶段(1990-2000年)秩相关系数最高。20世纪90年代以后,城市发展的总体格局发生了2个重要的变化:一是受经济聚合与外扩效应的影响,大型城市规模和数量大幅突破;二是大城市的良性发展没有引起令人生畏的“城市顽疾”,反而对周边的中小城市发展起到了强有力的辐射带动作用(王明, 2015)。而秩相关系数在第三阶段(2000-2010年)有所降低,表明城镇化和城市扩张达到一定程度后,核心城市对周边城市的城市扩张影响减弱。整体而言,城市扩张速度在第一阶段(1980-1990年)和第二阶段(1990-2000年)随着核心城市可达性降低而递减,但第三阶段(2000-2010年)距离核心城市较远的城市建设用地增长率相对更大。由此得出结论:城市扩张初期,核心城市对周边城市的城市扩张影响显著;随着城镇化进入高速发展阶段,城市群核心城市可达性对其他城市的城市扩张影响减弱。
图3 不同阶段核心城市可达性与城市扩张相关关系
Fig.3 Relationship between road network distance to core cities and urban expansion in different stages
表2 加权距离指数与城市扩张指标的斯皮尔曼秩相关系数值
Tab.2 Spearman's rank correlation coefficient between weighted distance index and urban expansion indicators
| AI/km2 | AGR/% | AE/% | |
|---|---|---|---|
| 1990年 | 0.345 | 0.297 | 0.307* |
| 2000年 | 0.576** | 0.372** | 0.614** |
| 2010年 | 0.315 | -0.210 | 0.391* |
4.1.2 空间相互作用与城市扩张的关联分析
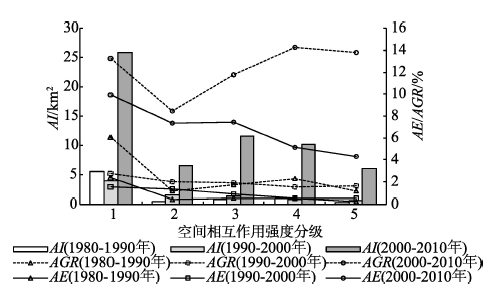
基于引力模型,以2010年统计数据为样本,计算各城市受到核心城市(上海市、南京市和杭州市)的空间相互作用力。每个城市受到的核心城市空间相互作用力之和为该城市受到的总作用力。按照受到的总空间相互作用力大小,将除核心城市外的26个城市由大到小,平均分为5级,其中前4级每级5个城市,第5级6个城市(表3)。
表3 基于空间相互作用强度分级结果
Tab.3 Classification result based on spatial interaction intensity
| 级 别 | 城市 | 1980年主城区面积/km2 | |
|---|---|---|---|
| 1 | 21.09 | 苏州市、无锡市、常州市、宁 波市、合肥市 | 98.89 |
| 2 | 3.80 | 镇江市、马鞍山市、扬州市、 嘉兴市、绍兴市 | 70.72 |
| 3 | 1.59 | 湖州市、芜湖市、南通市、徐 州市、温州市 | 69.23 |
| 4 | 0.45 | 泰州市、台州市、淮安市、盐 城市、金华市 | 68.85 |
| 5 | 0.19 | 滁州市、淮南市、宿迁市、衢 州市、连云港市、丽水市 | 54.24 |
图4 不同阶段空间相互作用强度与城市扩张相关关系
Fig.4 Relationship between spatial interaction intensity and urban expansion in different stages
图4从城市与区域中心城市空间联系强度的角度分析其与城市扩张水平之间的相关关系。从表4可以看出,各城市受到的区域核心城市空间相互作用力与城市扩张强度在各阶段均显著正相关。区域中心对城市的引力越强,建设用地增长量和扩张程度也相对越大。城市扩张速度与空间相互作用强度的秩相关系数仅在第二阶段为正且显著。在第一和第三阶段,除第一级城市(靠近核心城市)受到核心城市引力最大、城市扩张速度最快外,对其他级别城市、初始规模较小的城市其城市扩张则相对更快。城市相对位置与城市扩张的关联分析表明:城市相对位置指标与城市扩张指标相关系数在第二阶段最强,第三阶段次之,第一阶段最弱。改革开放初期,城市群的网络化组织结构还未形成,城市扩张孤立进行;20世纪90年代,城市发展总体格局转变,大城市对周边中小城市的发展起到强有力的辐射带动作用;2000年后,城镇化进入高速发展时期,城市扩张既受到区域核心城市的影响,低位序城市的城市扩张更受到相邻的高位序城市影响。
表4 空间相互作用强度与城市扩张指标的斯皮尔曼秩相关系数值
Tab.4 Spearman's rank correlation coefficient between spatial interaction intensity and urban expansion indicators
| F | AI/km2 | AGR/% | AE/% |
|---|---|---|---|
| 1990年 | 0.442* | 0.312 | 0.495* |
| 2000年 | 0.740** | 0.402* | 0.708** |
| 2010年 | 0.551** | -0.106 | 0.584** |
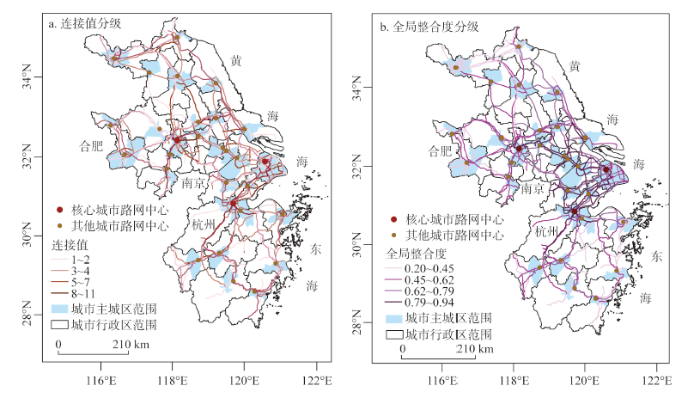
通过ArcGIS中的axowoman插件计算空间句法变量指标值,图5为2010年长江三角洲城市群交通路网空间句法指标的连接值和全局整合度值的分级结果。连接值表明(图5a),南京市—上海市—杭州市的沿线城市其连接值更高、局部通达性更好、空间联系更加紧密。全局整合度值表明(图5b),长江三角洲城市群中部城市全局通达性更强,到城市群其他城市的可达性更高。交通路网局部与整体联系均表明:长江三角洲城市群中部地区的交通路网通达性更高。此外,基于空间句法变量进行核密度分析,选取核密度值最高的点作为各城市的交通中心点。
图5 长江三角洲城市群空间句法变量的空间分异
Fig.5 Spatial differentiation of space syntax variables of road network in the Yangtze River Delta region
对于不同类型的交通路网,根据其速度设定相应权重,得到各城市加权空间句法指标值。根据《中华人民共和国公路工程技术标准(JTGB-2006)》和长江三角洲城市群的道路实际情况,得出不同等级道路在各时期的平均速度,如表5所示。
表5 长三角城市群不同类型交通路网平均速度/(km/h)
Tab.5 Speed of traffic in the road network of the Yangtze River Delta region/(km/h)
| 时间 | 国道 | 铁路 | 高速公路 |
|---|---|---|---|
| 1990年 | 60 | 50 | — |
| 2000年 | 70 | 100 | 110 |
| 2010年 | 80 | 140 | 120 |
基于交通路网均速(因1988年底开通第一条高速公路,故1990年前不考虑高速公路的影响)得到不同类型路网的权重,并通过min-max标准化处理得到城市空间句法变量(总连接值、集成程度和总全局整合度)的标准化值。以2010年城市总连接值为例,其计算公式为:
式中:
总连接值、集成程度和总全局整合度表示城市在城市群交通网络中的地位,定量地刻画城市交通的通达程度以及与城市群内其他城市联系的紧密程度。通过min-max标准化处理,上述指标标准化后结果处于[0, 1]。对空间句法变量标准化后指数做双变量皮尔逊相关分析,结果发现:皮尔逊相关系数均在0.96以上,且其显著相关,故上述指标具有可替代性。对空间句法变量指标和城市扩张指标进行双变量皮尔逊相关分析,结果表明总全局整合度(TGI)与城市扩张指标相关系数更大(相关系数值见表6),故采用总全局整合度表示路网通达性与联系紧密程度。
表6 总全局整合度与建设用地扩张指标双变量相关分析结果/(km/h)
Tab.6 Correlation of TGI and urban expansion in the Yangtze River Delta region/(km/h)
| TGI | AI/km2 | AGR/% | AE/% |
|---|---|---|---|
| 1990年 | 0.744*** | 0.328* | 0.574** |
| 2000年 | 0.860*** | 0.482** | 0.870*** |
| 2010年 | 0.850*** | -0.254 | 0.373* |
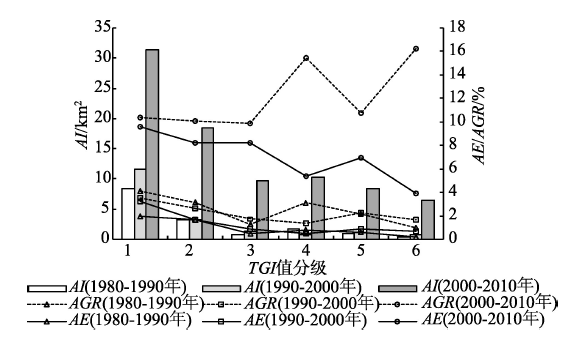
除2010年总全局整合度与建设用地年均增长率不相关外,其余均具有正相关关系。其中,总全局整合度与建设用地增长量的相关系数最高,与建设用地扩张程度的相关系数次之,与建设用地增长率的相关系数最低且在2010年不相关。从表7可以看出,根据不同阶段总全局整合度标准化系数由大到小,将29个城市平均分为6级,其中前5级每级分别有5个城市,最后一级4个城市。
表7 总全局整合度与城市扩张指标的斯皮尔曼秩相关系数值
Tab.7 Spearman's rank correlation coefficient between TGI and urban expansion indicators
| 级别 | 城市(2010年) |
|---|---|
| 1 | 上海市- -、南京市- -、杭州市- -、苏州市- -、镇江市↓- |
| 2 | 徐州市↓-、合肥市- -、无锡市↑-、嘉兴市- -、宁波市-↓ |
| 3 | 常州市↑↑、湖州市- -、马鞍山市- -、芜湖市- -、绍兴市- - |
| 4 | 淮安市↓↓、扬州市- -、衢州市- -、金华市- -、南通市- - |
| 5 | 泰州市↑↑、连云港市- -、温州市- -、盐城市-↓、淮南市- - |
| 6 | 台州市-↑、丽水市- -、滁州市- -、宿迁市- - |
表6显示,交通路网通达性与城市扩张强度的相关系数均为正且显著,且第二阶段的相关系数明显大于第一阶段和第三阶段,表明城市群交通路网组织的不断完善,对城市扩张的影响先增强后减弱。交通路网通达性与城市扩张速度的相关系数在第一和第二阶段显著正相关;第三阶段的相关系数为负,表明交通路网通达程度较弱(TGI低)的城市,此时建设用地扩张速度更为迅速。并且图6表明,AI、AGR、和AE在第一阶段和第二阶段相差不大,第三阶段和第一、第二阶段差异显著。2000年以来,由于国家城镇化政策调整,从之前的“严格控制城市规模,合理发展中等城市和小城市”,转为加快城镇化进程,坚持大中小城市和城镇协调发展(方创琳等, 2008)。2000年之后,长江三角洲城市群进入高速发展阶段,城市扩张更为迅速。综上可得,城市扩张强度与交通路网通达性联系更为紧密;城市扩张速度变化表明城市扩张呈现收敛趋势,路网通达性较弱的城市(主要分布在城市群边缘)在城市扩张加速阶段(第三阶段)扩张更快。
图6 空间句法指标与城市扩张相关关系
Fig.6 Relationship between road network space syntax variable and urban expansion
本文从城市群整体视角分析了长三角1980-2010年间空间联系与城市扩张之间的动态相关关系。总体而言,第一阶段(1980-1990年)和第二阶段(1990-2000年)间的城市扩张相对较慢、较缓和;第三阶段(2000-2010年)城市扩张进入加速发展,城市扩张的强度和速度都明显高于2000年前的城市扩张水平。
研究表明,区域核心城市可达性和辐射作用会促进周围城市的发展。但区域核心城市有一定的作用范围,超出这一范围后城市扩张的强度与核心城市可达性不具有正相关关系。随着城市扩张进程的加快,核心城市可达性对城市群内其他城市的城市扩张影响逐渐减弱。考虑城市自身规模(以主城区GDP和常住人口表示)后,核心城市的空间相互作用力依旧促进城市扩张。20世纪90年代,城市发展总体格局改变,大城市对周边中小城市的发展起到强有力的辐射带动作用,此时核心城市对周边城市的城市扩张关联最紧密。进入加速扩张阶段(第三阶段)后,受到核心城市引力最强以及与核心城市邻近的城市扩张速度仍然保持最快。对于其他级别城市,这一规律则不明显,此时初始规模较小的城市扩张速度更快,城市规模扩张呈现收敛的趋势。
随着城镇化进程的不断加快,交通路网与城市扩张强度的相关系数先增大后降低,说明城市群交通网络组织的不断完善,对城市扩张的影响先增强后减弱。城镇化进入高速发展阶段后,城市在城市群交通路网中的地位与城市扩张速度相关系数为负,此时交通路网通达性较低的城市扩张更快。并且,在第三阶段,到核心城市可达性相对较低、在城市群交通网络中地位较低、分布在城市群外围的城市的建设用地扩张速度较快;而核心城市周围的大规模城市的建设用地扩张速度放缓,呈现空间收敛的趋势。
除了本文采用的城市相对位置及其在交通网络中的地位,还可以采用其他方法来衡量城市间的空间联系。城市间空间联系的网络包括实体网络和虚拟网络,如基于道路网构建实体网络,基于信息流和经济流构建虚拟网络。城市群不同网络之间的关系、不同网络与城市扩张的时空关系等有待进一步探讨。本文结果表明,城市群中的城市空间联系在城市扩张过程中起到重要作用,但在城市群不同发展阶段,这一作用的强弱也随之发生变化。除长江三角洲城市群外,对其他处于不同城镇化水平的城市群,城市空间联系与城市扩张的关系有待进一步研究。
The authors have declared that no competing interests exist.
| [1] |
基于空间句法的城市交通网络特征研究: 以安徽省芜湖市为例 [J].https://doi.org/10.3969/j.issn.1672-0504.2005.02.010 URL [本文引用: 1] 摘要
加速的城市化进程迫切要求加强交通网络的规划与建设,而定量研究交通网络一直是城市研究中的难点,传统GIS空间分析功能在城市交通网络研究中也显不足.该文引入空间句法理论,提出通达能力CCi与集成程度CAi两个新的变量,以安徽省芜湖市为例,将空间句法模型用于城市交通网络的定量化实证研究.结果表明,芜湖市交通网络通达能力空间分布呈环状特征,与该市经济发展、交通需求基本吻合,空间句法理论可以有效地定量研究城市交通网络以及空间形态.
A research on urban traffic network based on space syntax: A case study on Wuhu City [J].https://doi.org/10.3969/j.issn.1672-0504.2005.02.010 URL [本文引用: 1] 摘要
加速的城市化进程迫切要求加强交通网络的规划与建设,而定量研究交通网络一直是城市研究中的难点,传统GIS空间分析功能在城市交通网络研究中也显不足.该文引入空间句法理论,提出通达能力CCi与集成程度CAi两个新的变量,以安徽省芜湖市为例,将空间句法模型用于城市交通网络的定量化实证研究.结果表明,芜湖市交通网络通达能力空间分布呈环状特征,与该市经济发展、交通需求基本吻合,空间句法理论可以有效地定量研究城市交通网络以及空间形态.
|
| [2] |
中国城市化发展阶段的修正及规律性分析 [J].Stages correction and regularity analysis of urbanization course of China [J]. |
| [3] |
东莞市交通路网格局对城市空间扩张影响研究 [J].https://doi.org/10.3724/SP.J.1047.2014.00079 URL Magsci [本文引用: 1] 摘要
城市化进程中,交通路网格局的发展与土地利用变化有着密切关系,交通系统的发展引起城市空间形态、土地利用开发、土地利用价格和用地布局特征的变化,反之,土地利用变化也引起了交通路网格局、路网密度的改变。本文以东莞市为例,对其交通路网密度与新增城市用地变化强度作了定量分析。根据TM遥感影像提取2001、2005和2009年3期的城市用地,采用核密度估算(KDE)新增城市用地变化强度,探讨区域内交通路网格局与新增城市用地变化强度的关系。结果表明,在2001-2005年间,路网格局变化较大,新增道路类型主要为高速路,新增城市用地总量较大、扩张速度快,特别是交通路网密度大的边缘区域。在2005-2009年间,随着路网发育不断成熟,路网密度内部差异减少,新增道路类型主要为县乡道路,新增城市用地速度明显放缓。经相关系数显著性检验后表明:2001-2009年间,在置信度为95%时,东莞市道路网密度、加权密度(<em>x</em>)与新增城市用地核密度(<em>y</em>)的相关系数<em>R</em><sub><em>xy</em></sub>均大于0.1946,证明东莞市道路网密度、加权密度与新增城市用地核密度高度相关。
Relationship between the structure of urban traffic network and urban spatial expansion: A case study of Dongguan City [J].https://doi.org/10.3724/SP.J.1047.2014.00079 URL Magsci [本文引用: 1] 摘要
城市化进程中,交通路网格局的发展与土地利用变化有着密切关系,交通系统的发展引起城市空间形态、土地利用开发、土地利用价格和用地布局特征的变化,反之,土地利用变化也引起了交通路网格局、路网密度的改变。本文以东莞市为例,对其交通路网密度与新增城市用地变化强度作了定量分析。根据TM遥感影像提取2001、2005和2009年3期的城市用地,采用核密度估算(KDE)新增城市用地变化强度,探讨区域内交通路网格局与新增城市用地变化强度的关系。结果表明,在2001-2005年间,路网格局变化较大,新增道路类型主要为高速路,新增城市用地总量较大、扩张速度快,特别是交通路网密度大的边缘区域。在2005-2009年间,随着路网发育不断成熟,路网密度内部差异减少,新增道路类型主要为县乡道路,新增城市用地速度明显放缓。经相关系数显著性检验后表明:2001-2009年间,在置信度为95%时,东莞市道路网密度、加权密度(<em>x</em>)与新增城市用地核密度(<em>y</em>)的相关系数<em>R</em><sub><em>xy</em></sub>均大于0.1946,证明东莞市道路网密度、加权密度与新增城市用地核密度高度相关。
|
| [4] |
辽中南城市群空间相互作用的时空演变 [J].
利用改进后的引力模型和潜力模型并结合GIS空间分析方法,分析了辽中南城市群2002—2011年这10年间空间相互作用的时空演变,结果表明:辽中南城市群空间相互作用强度总体上呈现下降趋势,其中沈阳与城市群内其它城市间的空间相互作用强度普遍较高,充分体现了沈阳的中心城市地位,但近10年来也存在波动下降的趋势;大连与大多数城市的空间相互作用强度处于中等强度以下且有渐弱的趋势,未能充分发挥辐射带动作用;其他城市之间,除了辽阳与鞍山联系强度较大外均处于较低水平且波动较小。潜力值的空间分异和空间辐射能力的特征及演变规律比较明显,近10年来呈现出普遍递减的趋势;沈阳、鞍山、抚顺潜力值一直稳居前3位但变动幅度较大,辐射带动能力强,其中鞍山渐渐呈现出明显的对外辐射作用,成为继沈阳之后新的辐射中心;其他城市潜力相对较小且变化不明显。
The spatio-temporal evolvement of spatial interaction among cities of south central Liaoning [J].
利用改进后的引力模型和潜力模型并结合GIS空间分析方法,分析了辽中南城市群2002—2011年这10年间空间相互作用的时空演变,结果表明:辽中南城市群空间相互作用强度总体上呈现下降趋势,其中沈阳与城市群内其它城市间的空间相互作用强度普遍较高,充分体现了沈阳的中心城市地位,但近10年来也存在波动下降的趋势;大连与大多数城市的空间相互作用强度处于中等强度以下且有渐弱的趋势,未能充分发挥辐射带动作用;其他城市之间,除了辽阳与鞍山联系强度较大外均处于较低水平且波动较小。潜力值的空间分异和空间辐射能力的特征及演变规律比较明显,近10年来呈现出普遍递减的趋势;沈阳、鞍山、抚顺潜力值一直稳居前3位但变动幅度较大,辐射带动能力强,其中鞍山渐渐呈现出明显的对外辐射作用,成为继沈阳之后新的辐射中心;其他城市潜力相对较小且变化不明显。
|
| [5] |
道路交通网络与城市土地利用时空耦合关系: 以南京市为例 [J].https://doi.org/10.11870/cjlyzyyhj201401003 Magsci [本文引用: 1] 摘要
<p>城市的扩张与道路交通的发展是相辅相成的。道路建设造成了城市景观的破碎化,使城市景观呈现不同的空间格局和空间异质性特征,并且这种空间异质性随着时间的变化而发生改变。在RS和GIS技术的支持下,利用1989、1999和2008年的Landsat TM/ETM+数据,以南京市为例对道路交通网络与城市土地利用之间关系进行了不同层次和尺度的空间分析。结果表明:1989~2008年近20 a来,南京市城市空间形态扩展迅速,建设用地面积从1989年的1003 km2增加到2008年的6847 km2;在不同时期,南京市城市化过程表现出不同的道路交通网络结构和城市空间扩展模式;由道路交通建设造成的局部区域的景观破碎度在一定程度上能够反映周边区域的土地利用强度;土地利用强度和由道路交通建设造成的景观破碎度均表现出显著的空间自相关性,随时间推移,这种特征愈加明显,并且二者在表征城市空间拓展方面具有较高的耦合度;受其他辐射中心的作用,交通干线周边地区土地利用强度并未表现出距离指数衰减效应</p>
Relationship between traffic network and urban land use in Nanjing with Landsat TM/ETM+ images [J].https://doi.org/10.11870/cjlyzyyhj201401003 Magsci [本文引用: 1] 摘要
<p>城市的扩张与道路交通的发展是相辅相成的。道路建设造成了城市景观的破碎化,使城市景观呈现不同的空间格局和空间异质性特征,并且这种空间异质性随着时间的变化而发生改变。在RS和GIS技术的支持下,利用1989、1999和2008年的Landsat TM/ETM+数据,以南京市为例对道路交通网络与城市土地利用之间关系进行了不同层次和尺度的空间分析。结果表明:1989~2008年近20 a来,南京市城市空间形态扩展迅速,建设用地面积从1989年的1003 km2增加到2008年的6847 km2;在不同时期,南京市城市化过程表现出不同的道路交通网络结构和城市空间扩展模式;由道路交通建设造成的局部区域的景观破碎度在一定程度上能够反映周边区域的土地利用强度;土地利用强度和由道路交通建设造成的景观破碎度均表现出显著的空间自相关性,随时间推移,这种特征愈加明显,并且二者在表征城市空间拓展方面具有较高的耦合度;受其他辐射中心的作用,交通干线周边地区土地利用强度并未表现出距离指数衰减效应</p>
|
| [6] |
基于空间句法的武汉城市圈城乡道路网通达性演化分析 [J].
<p>将空间句法理论与GIS 相结合,基于1989~2010 年武汉城市圈城乡道路网数据,定量分析城乡道路网发育的空间通达性演化规律:① 1989~2010 年,城乡道路网拓扑连接位序-规模结构日益发育典型,形成稳定的“金字塔”结构,高等级、高控制力的高通达性轴线发育水平较低,导致整个网络伺服效率和应对“拥堵”能力的低下;② 武汉城市圈城乡道路网生长发育具有时空惯性,呈现典型的“核心-边缘”和“等级圈层”复合结构;并生成两条带状城乡交通走廊和多个不同等级有序融合的“轴-辐”网络体系;③ 城乡道路网这种通达性等级空间格局与圈域城镇体系、交通设施和社会经济发展状况密切相关,尤其是与高速公路为代表的高等级路网发育水平,表现出复杂的共轭协调关系,表现出周期性和螺旋式的空间嬗变,是城乡道路网自组织生长机制支配,以及路网扩张和细分两种内力共同交互作用的结果。</p>
The evolution of spatial accessibility of urban-rural road network based on the space syntax in Wuhan Metropolitan Area [J].
<p>将空间句法理论与GIS 相结合,基于1989~2010 年武汉城市圈城乡道路网数据,定量分析城乡道路网发育的空间通达性演化规律:① 1989~2010 年,城乡道路网拓扑连接位序-规模结构日益发育典型,形成稳定的“金字塔”结构,高等级、高控制力的高通达性轴线发育水平较低,导致整个网络伺服效率和应对“拥堵”能力的低下;② 武汉城市圈城乡道路网生长发育具有时空惯性,呈现典型的“核心-边缘”和“等级圈层”复合结构;并生成两条带状城乡交通走廊和多个不同等级有序融合的“轴-辐”网络体系;③ 城乡道路网这种通达性等级空间格局与圈域城镇体系、交通设施和社会经济发展状况密切相关,尤其是与高速公路为代表的高等级路网发育水平,表现出复杂的共轭协调关系,表现出周期性和螺旋式的空间嬗变,是城乡道路网自组织生长机制支配,以及路网扩张和细分两种内力共同交互作用的结果。</p>
|
| [7] |
|
| [8] |
改革开放以来中国城市化的历程演进、态势与新进程 [J].https://doi.org/10.3969/j.issn.1672-2728.2015.04.020 URL [本文引用: 1] 摘要
改革开放以来,中国城市化经历了三个阶段的演进之后,进入了转型发展的新时期.从历程回顾的视角分析当前城市化呈现的新态势,有助于辨明中国新型城镇化的实质、特征与未来趋向.研究表明,就现实态势而言,国内城市将呈现组团式发展并形成丰富的城市带是一个重要的宏观进程;知识型发展将成为城市发展的新微观机制;中小城镇发展有利于实现新农村与新型城镇的和谐发展与融合.
Gaige kaifang yilai Zhongguo chengshihua de lishi yanjin, taishi yu xinjincheng [J].https://doi.org/10.3969/j.issn.1672-2728.2015.04.020 URL [本文引用: 1] 摘要
改革开放以来,中国城市化经历了三个阶段的演进之后,进入了转型发展的新时期.从历程回顾的视角分析当前城市化呈现的新态势,有助于辨明中国新型城镇化的实质、特征与未来趋向.研究表明,就现实态势而言,国内城市将呈现组团式发展并形成丰富的城市带是一个重要的宏观进程;知识型发展将成为城市发展的新微观机制;中小城镇发展有利于实现新农村与新型城镇的和谐发展与融合.
|
| [9] |
京津冀城市群交通网络综合分析 [J].https://doi.org/10.7702/dlydlxxkx20140216 URL [本文引用: 1] 摘要
为优化城市群交通网络结构,促进京津冀城市群交通一体化与经济一体化的发展,从交通建设度、交通运输度、交通通行度及关联度等方面构建交通网络总体建设水平的评价指标体系,并运用SPSS模型对城市群内的交通节点进行分级,然后运用交通联系度模型对各城市间的交通网络联系进行了定量分析,从而构建了京津冀城市群交通网络联系的基本结构.研究表明,京津冀城市群各节点城市交通网络综合实力的两极分化现象严重;交通网络的联系不健全,存在南北不对称的松散结构;交通网络呈现以北京市为中心的放射式格局并形成以京津为核心的三条主要联系通道.
Comprehensive analysis of the Beijing-Tianjin-Hebei city cluster transportation network [J].https://doi.org/10.7702/dlydlxxkx20140216 URL [本文引用: 1] 摘要
为优化城市群交通网络结构,促进京津冀城市群交通一体化与经济一体化的发展,从交通建设度、交通运输度、交通通行度及关联度等方面构建交通网络总体建设水平的评价指标体系,并运用SPSS模型对城市群内的交通节点进行分级,然后运用交通联系度模型对各城市间的交通网络联系进行了定量分析,从而构建了京津冀城市群交通网络联系的基本结构.研究表明,京津冀城市群各节点城市交通网络综合实力的两极分化现象严重;交通网络的联系不健全,存在南北不对称的松散结构;交通网络呈现以北京市为中心的放射式格局并形成以京津为核心的三条主要联系通道.
|
| [10] |
京津冀区域铁路交通网络结构评价 [J].
在区域一体化背景下,将城市空间分析法和社会网络分析法应用于区域铁路交通网络研究,对了解区域中各重要节点交通特征、加强区域间合作和优化区域铁路交通规划有着重要的参考价值。以目前京津冀区域铁路交通城市节点间铁路距离里程为依据,借助空间句法模型指标评价京津冀区域铁路网络规划的合理性;以区域内城际间列车联结次数为依据,借助社会网络分析法,评价城市节点间社会联系的密切度。结论包括:①空间句法指标值中,京津冀都市圈铁路网连接度平均水平为3,控制值均值为1.06,平均深度值高于50的城市节点占85%,说明铁路交通轴线具备较强控制力和联动性。其中北京、天津、廊坊、保定等城市节点平均深度值相对较小,便捷程度相对较好;②社会网络分析均表明京津冀区域铁路网络结构呈现以北京、天津、石家庄为核心,以唐山、秦皇岛为次核心,其他城市节点为第三梯队的格局。京津冀铁路出行网络总体联系密度为0.673,说明京津冀区域各节点铁路出行线路联系比较密切;③京津冀区域铁路网整体规划现状和连接格局、联系水平等与各城市经济发展基本保持相关性和一致性。在城市铁路网络规划与加强联系的过程中,应考虑各城市产业特征,进一步统筹产业发展与铁路网络布局的关系,以相互促进,协调发展。
Evaluation of rail transport network within Beijing-Tianjin-Hebei region [J].
在区域一体化背景下,将城市空间分析法和社会网络分析法应用于区域铁路交通网络研究,对了解区域中各重要节点交通特征、加强区域间合作和优化区域铁路交通规划有着重要的参考价值。以目前京津冀区域铁路交通城市节点间铁路距离里程为依据,借助空间句法模型指标评价京津冀区域铁路网络规划的合理性;以区域内城际间列车联结次数为依据,借助社会网络分析法,评价城市节点间社会联系的密切度。结论包括:①空间句法指标值中,京津冀都市圈铁路网连接度平均水平为3,控制值均值为1.06,平均深度值高于50的城市节点占85%,说明铁路交通轴线具备较强控制力和联动性。其中北京、天津、廊坊、保定等城市节点平均深度值相对较小,便捷程度相对较好;②社会网络分析均表明京津冀区域铁路网络结构呈现以北京、天津、石家庄为核心,以唐山、秦皇岛为次核心,其他城市节点为第三梯队的格局。京津冀铁路出行网络总体联系密度为0.673,说明京津冀区域各节点铁路出行线路联系比较密切;③京津冀区域铁路网整体规划现状和连接格局、联系水平等与各城市经济发展基本保持相关性和一致性。在城市铁路网络规划与加强联系的过程中,应考虑各城市产业特征,进一步统筹产业发展与铁路网络布局的关系,以相互促进,协调发展。
|
| [11] |
Mutual causality in road network growth and economic development [J]. |
| [12] |
Integration of space syntax into GIS for modelling urban spaces [J].https://doi.org/10.1016/S0303-2434(00)85010-2 URL 摘要
In the past, many methods of spatial analysis have been developed for a better understanding and modelling of real-world phenomena. However there is still a need for exploration of new analytical techniques for modelling urban spaces. Space syntax models the spatial configurations of urban spaces by using a connectivity graph representation. Such a configuration of space identifies patterns that can be used to study urban structures and human behaviours. This paper proposes methodological and practical evaluations of the potential of the space syntax approach within GIS. We present the main principles that are the basis of space syntax, in addition to methodological perspectives for a closer integration with GIS, which should be of use for many GIS applications, such as urban planning and design.
|
| [13] |
Urban land density function: A new method to characterize urban expansion [J].https://doi.org/10.1016/j.landurbplan.2015.02.017 URL [本文引用: 1] 摘要
Density analysis lies at the core of studies on urban expansion; however, many methods in urban land density analysis are arbitrary and suffer from the lack of an established foundation. We observed an 鈥淚nverse S-shape Rule鈥 for urban land density that varies outward from an urban center by investigating 28 major cities in China at three time points. We proposed an inverse S-shaped function to formulate urban land density, which fit well for all of the cities in our sample using a nonlinear least squares fitting method. The parameters of the function explicitly describe the basic properties of an urban form. Based on the fitted functions, we derived an established method for the concentric partitioning of urban area and further proposed indicators to measure the urban compactness, urban expansion rate, and degree of urban sprawl. These indicators are practical for characterizing urban form and urban sprawl for either a single city or for multiple cities. A case study on major Chinese cities from 1990 to 2010 reveals that most of the cities expanded rapidly and became less compact and more dispersed during those two decades. However, most of the cities grew faster and showed more sprawl in the second decade compared to the first one. Discussions show that the model is also applicable for non-monocentric cities and possibly can be applied to many other geographical phenomena.
|
| [14] |
Multi-order landscape expansion index: Characterizing urban expansion dynamics [J].https://doi.org/10.1016/j.landurbplan.2014.10.023 URL 摘要
Most of the landscape metrics used in urban expansion studies are capable of reflecting the spatial characteristics for individual time points, but are not efficient to capture the integrated information from time series data. A few spatial metrics, for example, Landscape Expansion Index (LEI), are calculated based on two-time-point data. These metrics are insufficient for the analysis of urban expansion dynamics based on multi-temporal data. In this study, we propose an improved spatial metric, Multi-order Landscape Expansion Index (MLEI), to measure the expansion degree of newly grown urban patches by considering their relationships with old patches and their spatial context in the process of urban expansion. A case study is conducted in Wuhan, a fast-growing metropolis in central China, based on remote sensing images from three time points (2000, 2005 and 2010). The MLEI map in 2010 clearly shows the areas that have experienced expansive growth. The greatest difference between MLEI and LEI occurs where outlying clusters are formed gradually through time. Some spatial analysis methods are applied on the MLEI map in 2010 to delineate outlying urban clusters in urban expansion. The map of urban clusters clearly shows the spatial heterogenicity of urban expansion and the most expansive areas in Wuhan. This study suggests that MLEI is capable to capture multi-temporal information, and can be used to characterize the spatial structure of urban expansion dynamics.
|
| [15] |
A new landscape index for quantifying urban expansion using multi-temporal remotely sensed data [J].https://doi.org/10.1007/s10980-010-9454-5 Magsci [本文引用: 1] 摘要
Landscape metrics or indices have been commonly used for quantifying landscape patterns. However, most of these indices are generally focused on simple analysis and description of the characterization of the geometric and spatial properties of categorical map patterns. These indices can hardly obtain the information about the spatio-temporal dynamic changes of landscape patterns, especially when multi-temporal remote sensing data are used. In this paper, a new landscape index, i.e., landscape expansion index (LEI), is proposed to solve such problems. In contrast with conventional landscape indices which are capable of reflecting the spatial characteristics for only one single time point, LEI and its variants can capture the information of the formation processes of a landscape pattern. This allows one to quantify the dynamic changes in two or more time points. These proposed indices have been applied to the measurement of the urban expansion of Dongguan in Guangdong province, China, for the period of 1988–2006. The analysis identifies three urban growth types, i.e., infilling, edge-expansion and outlying. A further analysis of different values of LEI in each period reveals a general temporal transition between phases of diffusion and coalescence in urban growth. This implies that the regularity in the spatiotemporal pattern of urban development in Dongguan, is consistent with the explanations according to urban development theories.
|
| [16] |
Simulating urban growth by integrating Landscape Expansion Index (LEI) and cellular automata [J].https://doi.org/10.1080/13658816.2013.831097 Magsci 摘要
Traditional urban cellular automata (CA) model can effectively simulate infilling and edge-expansion growth patterns. However, most of these models are incapable of simulating the outlying growth. This paper proposed a novel model called LEI-CA which incorporates landscape expansion index (LEI) with CA to simulate urban growth. Urban growth type is identified by calculating the LEI index of each cell. Case-based reasoning technique is used to discover different transition rules for the adjacent growth type and the outlying growth type, respectively. We applied the LEI-CA model to the simulation of urban growth in Dongguan in southern China. The comparison between logistic-based CA and LEI-CA indicates that the latter can yield a better performance. The LEI-CA model can improve urban simulation accuracy over logistic-based CA by 13.8%, 10.8% and 6.9% in 1993, 1999 and 2005, respectively. Moreover, the outlying growth type hardly exists in the simulation by logistic-based CA, while the proposed LEI-CA model performs well in simulating different urban growth patterns. Our experiments illustrate that the LEI-CA model not only overcomes the deficiencies of traditional CA but might also better understand urban evolution process.
|
| [17] |
Driving force of urban growth and regional planning: A case study of China's Guangdong Province [J].https://doi.org/10.1016/j.habitatint.2013.01.006 URL Magsci [本文引用: 1] 摘要
Since China's economic reforms began in 1978, rural urban migration has accelerated urban growth and the consequential need for regional planning. In order to make effective strategic decisions on regional planning, it is essential to identify the determinants that promote or restrain urban growth. Based on the theoretical underpinnings of classical economics, spatial economics and sustainable development, this paper establishes a theoretical model of urban population growth and uses a case study of China's Guangdong Province to test a hypothesis. The driving force of urban population growth is derived from natural and mechanical increases that include original urban size, living environment, industrial agglomeration, and location. Regression results from the case study reveal that during the period 2000-2010, factor of dominant industry significantly and consistently impacted urban growth, whereas the influence of living conditions and location on urban growth varied from year to year. These findings imply that local government pays less attention to residents' livelihood and more to the effect of location on urban growth. The paper concludes by proposing some regional planning policies for sustainable development. (C) 2013 Elsevier Ltd. All rights reserved.
|
| [18] |
Does city location determine urban population growth? The case of small and medium cities in Korea [J].https://doi.org/10.1111/j.1467-9663.2011.00685.x Magsci 摘要
Accessibility to large cities has been recognised as a significant factor for the growth of small and medium cities. The dependence on large cities is especially strong in the urban system with strong urban hierarchy. Based on this observation, this study attempts to examine the influence of city location in the Korean urban system on the growth of small and medium cities. The result shows that distance from Seoul is significant in explaining the overall urban population growth although distance from regional centres is important in explaining in- and out-migration, suggesting that the spillover effect of Seoul is the dominant determinant of growth.
|
| [19] |
Comprehensive delimitation and ring identification on urban spatial radiation of regional central cities: Case study of Zhengzhou [J].https://doi.org/10.1061/(ASCE)UP.1943-5444.0000120 URL 摘要
In China and a number of other countries, recent years have seen a prevailing trend in collective and cooperative urban development, transforming individual cities to polycentric metropolis. Such a phenomenon, also termed urban agglomeration by some researchers in China, has gradually become the main body of urbanization and the basic terrain unit in participating international competition and international division of labor. However, the spatial delimitation of urban agglomeration has been historically heavily influenced by subjective administrative instruction, as opposed to being primarily driven by radiation effects by regional central cities. To better delimitate the urban agglomeration sphere in China and other fast-developing areas, this work seeks to scientifically assess and comprehensively delimitate the spatial patterns of regional central cities’ radiation through quantitative analysis and modeling. Zhengzhou, a typical regional central city in central China is chosen as the study case. First, it makes a modification to the traditional gravity model by constructing a radiation quality index (RQI) and integrating distances representing commuter traffic, economic development gap, and cultural psychological factors. Subsequently, a comprehensive delimitation is derived that demarcates and describes Zhengzhou’s urban radiation toward 42 neighboring cities by applying the radiation field intensity model, radiation effect function, and judgment vectors of the urban radiation ring-layer model. The chief findings are that Zhengzhou’s radiation effect is not prominent compared to other similar provincial capital-level cities. There is no distinct psychological or spatial differentiation between Zhengzhou and its 42 neighboring cities. The economic distance between Zhengzhou and other cities has been stable, and has even shrunk, whereas there are notable differences among fixed range ring patterns. The interaction forces between Zhengzhou and neighboring cities have increased, and radiation field intensity of Zhengzhou has been expanded to outer rings. However, some cities along the provincial boundary received very limited influence from Zhengzhou, and are significantly more influenced by other radiation sources. In 2001 and 2009, there were 26 and 24 cities that fell in Zhengzhou’s urban radiation rings, respectively, whereas only seven cities were included in the core and primary radiation ring. This list of seven cities excluded Luohe City, in spite of its administrative inclusion within Zhengzhou. Zhengzhou’s urban radiation ring contracts in its southern and western quadrants, whereas it expands in the eastern and northern quadrants. This finding prompts the authors to advocate the city of Zhengzhou to prioritize on expanding its radiation to the southeastern area around the Zhongyuan Urban Agglomeration. Such balanced development could prove beneficial to not only Zhengzhou City, but also the entire Henan Province.
|
| [20] |
Applying and exploring a new modeling approach of functional connectivity regarding ecological network: A case study on the dynamic lines of space syntax [J].https://doi.org/10.1016/j.ecolmodel.2014.11.015 URL [本文引用: 1] 摘要
The construction of ecological network or other continuous habitat is essential for urban eco-system; however, to quantify the heterogeneous functional connectivity for eco-network is academically attractive and challenging. The dynamic lines of space syntax, tenable to simulate perception and navigation flows in network-configured human settlements, is introduced to inspire idea and approach to modeling connectivity in eco-network, while the classical graphic notions and variables are assumed functional to new relationship between other species and eco-network. After mapping continuous functional components among land layout into free space and then into dynamic lines that influence bio-flows, the paper conducts an exploration on functional connectivity of Singapore's green network. Conclusions involves the distribution heterogeneity of basic variables, Connectivity , Control , Mean Depth and Integration , demonstrating each meaning for functional connectivity in the network, with a step-wise Integration further comparing the connectivity patterns under different behavioral ranges. Moreover, a scale robustness determined via linear regression between Integration and Connectivity reveals network functionality as behavioral scale varying. The analogical modeling of space syntax raised in this paper is adaptive and instructive, particularly if original essential traits remain valid between the substituted species and space, because several principles and characteristics of conventional connectivity models can be logically inherited, while the graphic notions of dynamic line shares unique advantages.
|

/
| 〈 |
|
〉 |