马文勇 , 王训明
, 王训明
中国科学院地理科学与资源研究所,北京 100101
MA Wenyong, WANG Xunming
通讯作者:
版权声明: 2016 地理科学进展 《地理科学进展》杂志 版权所有
基金资助:
作者简介:
作者简介:马文勇(1988-),男,山东新泰人,博士生,主要从事沙漠化与遥感监测研究,E-mail: mawenyong2162@126.com。
展开
摘要
叶绿素是草地进行光合作用最重要的色素,与氮素、蛋白质、水分等其他植被生化参数均有着密切关系,是草地光合能力及生理状况的良好指示剂。利用高光谱数据建模分析是实现大面积草地叶绿素含量估算的一种重要手段。本文将基于高光谱分析估算草地叶绿素含量的方法总结为:基于红边位置及光谱指数的经验模型和辐射传输模型两类。经验模型通过建立叶绿素含量与红边位置、光谱指数之间统计关系来估算叶绿素含量,参数简单,实用性较强;但光谱指数构造形式多样且与草地叶绿素含量关系复杂,在一定程度上影响了叶绿素的估算精度。辐射传输模型以叶绿素含量与辐射能量的作用过程作为其理论基础,模型中参数较多且对估算尺度敏感,有待于进一步完善。目前草地叶绿素估算的研究相对薄弱,专门用于估算的模型较少。未来的工作一方面应致力于发展和改进适宜于草地的光谱指数,同时确定合适的辐射传输模型参数以改进模型对草地的监测效果;另一方面,如何由叶片尺度拓展到冠层尺度进而拓展到像元尺度,从而更好地实现大面积草地叶绿素含量估算,是一项既具有重要意义又有挑战性的工作。
关键词:
Abstract
As the key pigment for photosynthesis, chlorophyll is closely related to nitrogen, protein, moisture, and other biochemical parameters of vegetation. Chlorophyll is a good indicator for photosynthesis activity and physiological state of grasslands. Hyperspectral analysis is a powerful means for accurately retrieving grassland chlorophyll contents in large areas. Based on the existing methods for monitoring grassland chlorophyll contents, this article summarizes and groups such methods into two categories: empirical models of red edge position (REP) / spectral indices, and radiative transfer models. With statistical analysis of the relationships between chlorophyll contents and REP/ spectral indices, empirical models were extensively employed for estimating grassland chlorophyll contents. These models use simple parameters and the REP that is closely related to grassland chlorophyll contents can be conveniently calculated. Due to the diverse structural forms of the spectral indices and the complicated relationships between spectral indices and chlorophyll contents, accuracy of chlorophyll content estimation is still limited, although novel algorithms of REP calculation and, to a lesser extent, new spectral indices, have significantly improved the estimation accuracy of grassland chlorophyll contents. Based on the relationships of chlorophyll contents and radiation energy, radiative transfer models were founded. Multiple parameters are required in the models, which are highly sensitive to the scale of estimation, and these models need to be further improved. Currently there exist few studies on grassland chlorophyll content estimation and only very few models have been developed for grassland chlorophyll content estimation. Future research should focus on developing new indices or improving existing indices and determining appropriate parameters of radiative transfer models to achieve better results for grassland application. In addition, current studies are limited to leaf and canopy scale analyses, and therefore expanding grassland chlorophyll content estimation to the landscape scale will be an important and challenging task.
Keywords:
中国草地面积393万km2,约占全国陆地总面积的40%和全球草地总面积的6%~8%(Ni,2002),是中国分布面积最广的生态系统,对畜牧业发展、水土保持和生态平衡维持起着巨大作用。近年来,干旱、半干旱区的草地退化问题日益严峻,而草地叶绿素含量是研究草地退化的重要切入点。叶绿素是一种植被生化参数,与氮素、蛋白质、水分等其他植被生化参数均有密切关系(Clifton et al,1994; Gáborčík,2003),当草地受到破坏时,叶绿素含量会降低,能间接反映草地受外界胁迫后的生理状态(Peñuelas et al,1998); 同时叶绿素也是草地光合作用的重要色素(Niinemets et al,1997),是草地进行第一性生产的重要物质。综上所述,叶绿素含量可以很好地表征草地光合能力及生理健康状况(Carter et al,1994; Lichtenhaler,1998),可作为评价草地质量的指示指标(Wright et al, 2004; Kokaly et al, 2009)。
草地叶绿素含量获取方法很多,传统方法如化验法(分光光度计法)既耗时又会对植被造成损伤;仪器测试法(如SPAD502)虽然便携却受到野外样点数量的限制,仅能用于小面积调查,在草地资源的管理中作用有限。因此,为快速获取大面积草地叶绿素信息以便及时准确地监测草地质量状况,传统方法有一定难度。而借助于机载成像光谱仪和星载高光谱成像仪提供的高光谱数据,利用遥感手段快速获取大面积草地叶绿素信息已成为一种重要而广为接受的研究方法(Jago et al, 1999; Richardson et al, 2002; Zhang et al,2008; Si et al, 2012)。大面积草地叶绿素估算的实现对合理开发与保护草地资源,有效发展畜牧业,最大限度地保持或提高草地生产力以及维护草地生态系统结构和功能具有重要的作用(张云海等,2013)。
基于高光谱分析的草地叶绿素含量估算,是指在深入分析草地光谱特征及其生物理化参数定量化特征基础上,通过探索最优波段或波段组合,并利用数学模型来实现草地叶绿素的评估。目前使用高光谱分辨率遥感数据估算草地叶绿素含量的数学模型主要有以下两类:①经验模型。利用统计方法建立叶绿素含量与草地光谱特征之间的回归模型,从而估算叶绿素含量。常用的草地光谱特征有两个:一是特定光谱位置—红边位置;二是光谱指数,包括光谱反射率、导数光谱及由此衍生的不同形式的光谱组合。②物理模型。其中辐射传输模型通过分析草地叶绿素含量与辐射能量的作用过程能较好地模拟草地光谱特征,在草地叶绿素反演中取得了一定效果,常用的辐射传输模型有叶片尺度的PROSPECT和冠层尺度的PROSAIL。本文将从两个方面对上述模型进行详细阐述,首先总结现有研究中红边位置、光谱指数和辐射传输模型的计算方法,在此基础上,概括它们估算植被叶绿素含量的方法与效果,探讨其针对草地的适用性与不足,以期为大面积草地叶绿素含量估算提供参考。
基于红边位置及光谱指数的经验模型中,通过建立叶绿素含量与红边位置、指数之间的统计关系估算草地叶绿素含量,具有关系密切、参数简单、计算方法简便、实用性较强等特点。
2.1.1 红边位置计算方法概要
由于红边位置是指反射率一阶导数在红—近红外区间内的拐点,因此其精确计算需要此区域许多窄波段的光谱数据。目前,红边位置的计算方法主要分为两类:一类是基于导数光谱,如最大一阶微分法、拉格朗日插值法和线性外推法等;另一类则是基于曲线拟合技术,如线性插值法、倒高斯模型和多项式拟合法等(表1)。
表1 6种红边位置提取技术比较
Tab.1 Comparison of six red edge position (REP) techniques
| 红边位置技术 | 算法 | 执行难易及光谱类型 | 参考文献 |
|---|---|---|---|
| 最大一阶微分 | 容易 反射率光谱 | Horler et al, 1983 | |
| 拉格朗日插值 | 适中 导数光谱 | Dawson et al, 1998 | |
| 线性外推法 | 远红色区直线: 近红外区直线: REP= | 适中 导数光谱 | Cho et al, 2006 |
| 线性插值 | 容易 反射率光谱 | Guyot et al,1988 | |
| 倒高斯模型 | 困难 反射率光谱 | Bonham-Carter, 1988 | |
| 多项式拟合 | 较难 反射率光谱 | Pu et al, 2003 |
基于导数光谱的最大一阶微分法由于简单易算且能够消除光谱数据中背景噪音的影响而得到广泛应用,但研究(Horler et al, 1983)发现这种方法会产生位于700 nm和725 nm的两个峰值,导致了红边—叶绿素关系的不连续性。Lamb等(2002)进一步研究指出,第一个峰值和低叶绿素含量有较好相关性而第二个峰值和高叶绿素含量有较好相关性。研究人员在对草地冠层光谱的研究中也证实了这一点(Clevers et al, 2004; Smith et al, 2004)。近年来随着高光谱数据处理手段的进步,基于曲线拟合技术的方法(如倒高斯模型)逐渐得到了一定程度的应用(陈雪洋等, 2011)。Cho等(2006)提出的线性外推法可有效减轻红边位置对叶绿素含量变化的不敏感性和不连续性,能充分追踪叶绿素吸收峰附近的光谱变化,因此和叶绿素含量的关系最好(薛利红等, 2008; 姚霞等, 2010)。
2.1.2 红边位置对草地叶绿素含量估算研究
由于植被反射光谱在400~700 nm的可见光区域主要受植被色素(叶绿素和类胡萝卜素)影响,在近红外区域则主要受叶片内部结构和其他生化参数(蛋白质、纤维素)影响,因此可以用植被反射光谱来估算其生化参数,尤其是色素含量(Thomas et al, 1977)。研究表明,叶绿素吸收波段为680 nm(Blackburn, 1998),导致叶绿素对红光吸收强烈,形成了植被光谱曲线中红光部分的低谷;而光在叶片内部的多次散射导致了近红外区域的高反射率,造成了绿色植被在680~750 nm时的光谱反射率快速上升区域“红边”。在植被反射光谱曲线中,红边是其最明显的光谱特征之一,是描述植被叶绿素状态的重要指示波段。红边位置(REP)则是植被在这一区间反射率增高最快的波长位置,也是光谱反射率一阶导数在该区间内的拐点。历经30多年的研究,红边位置至今仍然是估算植被叶绿素含量的重要光谱参数(Boochs et al, 1990; Asner et al, 2005; Sims et al, 2006)。
草地叶绿素含量与红边位置具有较好的相关关系(Pinar et al, 1996)。图1为从机载CASI高光谱影像提取的草地红边位置图,该草地叶面积指数变化不大。Jago等(1999)指出,随着草地叶绿素含量的增加,红边逐渐向长波方向移动,即红移现象。同时,随着叶绿素含量的降低,红边会逐渐向短波方向移动,即蓝移现象(Rock et al, 1988)。
图1 英国肯特郡谷岛某处草地的红边位置图(
Fig.1 Red edge position (REP) image of a grassland site, Isle of Grain, Kent, the United Kingdom (
基于红边位置与叶绿素含量的相关关系,研究人员通过建立回归模型估算得到叶绿素含量。由于不同类型植被具有不同的光谱特性,计算得到的红边位置也会有差异,所以针对不同类型植被建立的回归方程会出现形式上的差异。对草地来说,常见回归形式为简单的线性回归,如Chl=a+b×REP(Clevers et al, 2001),其中Chl为叶绿素或叶绿素相关物质的含量,REP为红边位置,a和b为拟合参数。这种基于红边位置建立回归方程估算草地叶绿素含量的方法,回归关系较单一,实际应用中易于操作。
2.2.1 光谱指数类型及计算方法概要
为了使植被反射信息最大和外部因素影响最小,研究人员提出并构建了一些高光谱指数,这些高光谱指数以其特有的精细光谱特征,能获得非常细微的植被生理状况和环境胁迫差异,使其在叶绿素含量的反演方面有着广阔的应用前景。根据各个指数的构造形式及构造原理,高光谱指数总体来说可以分为以下四种类型:单波谱及其变换形式,归一化光谱指数及其变换形式,比值光谱指数及其变换形式,多波段光谱指数(表2)。
表2 叶绿素相关光谱指数
Tab.2 Spectral indices developed as chlorophyll indicators
| 指数类型 | 指数缩写 | 计算公式 | 参考文献 |
|---|---|---|---|
| 单波谱及其变换形式 | RR | Gitelson et al, 1999 | |
| LRR | Yoder et al, 1995 | ||
| 归一化型光谱指数 | NDI | Richardson et al, 2002; Tucker, 1979; Gitelson , Merzlyak, 1996 | |
| mNDI | Sims et al, 2002 | ||
| OSAVI | Rondeaux et al, 1996 | ||
| 比值型光谱指数 | SR | Gitelson, Merzlyak, Lichtenthale,1996, 1999; Sims et al, 2006 | |
| CIred-edge | Clevers et al, 2011 | ||
| mSR | Sims et al, 2002 | ||
| PSSR | PSSRa= PSSRb= | Blackburn, 1998, 1999; Sims et al, 2002 | |
| RARS | RARSa= | Chappelle et al, 1992; Blackburn, 1999 | |
| 多波段光谱指数 | MTCI | Dash et al, 2007 | |
| GCI | 肖汉等, 2014 | ||
| DCNI | Chen et al, 2010 | ||
| CARI | a=( | Kim et al, 1994 | |
| MCARI/OSAVI | Wu et al, 2008 | ||
| RII | Richardson et al, 2002 | ||
| NAOC | Delegido et al, 2010 |
单波谱指数重在探寻不同植被类型在不同生长期对叶绿素的敏感波段;归一化光谱指数由基于红光区域的低反射率和近红外区域的高反射率构成,一定程度上消除了大气气溶胶和土壤背景的影响,基本形式为NDSI=[Rx -Ry]/[Rx+Ry],Rx取值一般为750~900 nm,而Ry为660~720 nm; 比值光谱指数同样基于红光区域的低反射率和近红外区域的高反射率构成,基本形式为SR=Rx/Ry; 多波段光谱指数至少包含三个波段,构造形式相对复杂,其目的也是为了进一步减轻外界因素(大气气溶胶和土壤背景)及植被冠层结构和冠层非光合作用物质的干扰,基本形式有[Ra-Rb]/[Rb-Rc]、[Ra-Rb]/[Rc-Rd]及积分光谱,其中a、b、c、d值大致在680~750 nm之间,且a>b>c>d。
Le Maire等(2004)对比较成熟的叶绿素指数进行了统计,指出大部分指数都是对农作物进行叶绿素反演研究,专门针对草地的指数几乎没有。本文概括的四种形式的高光谱指数,除了多波段光谱指数中的GCI(肖汉等,2014)是专门针对草地研究之外,其他同Le Maire等(2004)的研究相一致,大部分用于农作物和森林植被的叶绿素研究。研究人员将其中一部分光谱被指数应用在草地叶绿素估算上,同样取得了较好的结果(Sims et al, 2002; Clevers et al, 2011),而对于尚未应用的指数,需要后续研究工作的确定。
2.2.2 光谱指数对草地叶绿素含量的估算研究
在可见光的红光和蓝光区域,植被反射光谱曲线呈现低谷,红光区域主要是受到叶绿素强烈吸收而蓝光区域则受到叶绿素和类胡萝卜素的共同吸收。相比蓝光区域受到类胡萝卜素的干扰,红光区域更适宜叶绿素含量的估算,很多单波段指数也都出现在红光区域。Blackburn(1998)研究发现,尽管波谱反射率680及650 nm处分别对应叶绿素a及叶绿素b的最大吸收峰,但实际常用波段往往会小幅度偏离这些波长。Yoder等(1995)利用植被光谱曲线700 nm附近的反射率估算了枫树叶片叶绿素含量(R2=0.64),Gitelson等(1999)利用700 nm反射率估算了三种高等植物叶片叶绿素含量[R700=6450/(Chl+121),R2=0.95]。同是基于700 mm反射率波段,但是实际估算效果相差较大,这表明单一波段指数估算叶绿素含量易受到外界因素(如大气气溶胶和土壤背景)的影响,在影像质量不好或者下垫面复杂地区(如稀疏草地)效果可能不好。
在近红外区域,植被光谱曲线反射率高达40%~50%,主要由于光在叶片内部的多次散射而成。与单片叶片相比,多片叶片在近红外波段会产生更高的反射率。利用植被在红光和近红外区域反射率差异,结合手持叶绿素仪的工作原理,研究人员通过简单的比值运算和归一化运算,构造了SR (比值光谱指数)及NDSI (归一化光谱指数)进行叶绿素含量估算。Gitelson,Merzlyak,Lichtenthale(1996)、Richardson等(2002)和Clevers等(2011)利用植被叶片700 nm和750 nm附近的反射率估算了植被叶绿素含量并取得了较好的结果(R2>0.94),这表明双波段组合一定程度上消除了大气气溶胶和土壤背景的影响。Richardson等(2002)进一步指出,在叶绿素含量较低时(0.0004~0.0455 mg·cm-2),这些光谱指数估算结果精度超过了手持叶绿素仪SPAD502;但在叶绿素含量较高时则出现了饱和现象,表明双波段构造指数在一定程度上仍然受到植被自身结构,尤其是叶面积指数的干扰。天然草地种类组成繁多,层次结构复杂,SR和NDSI在对草地叶绿素含量进行估算时,效果相对较差。Sims等(2002)总结了自然条件下不同植被类型不同叶片结构的叶绿素含量估算效果,认为草地估算效果相比森林较差; Amiri等(2011)采用NDI (归一化差别指数)和SRI (简单比值指数)估算了澳大利亚北部草原的叶片叶绿素含量,结果发现这两个光谱指数应用在次大陆尺度的普适性较差。
为在消除外界因素(如大气气溶胶和土壤背景)的影响下,进一步消除植被自身结构的干扰,研究人员用多达四个波段构造的复杂光谱指数估算了叶绿素含量(Haboudane et al, 2002; Wu et al, 2008),并且取得了较好的结果(R2=0.8)。Dash等(2007)发现,在叶绿素含量较高时,MTCI(MERIS陆地叶绿素指数)仍然能够比较准确估算出植被叶绿素含量(R2>0.73)。相比构造形式简单的光谱指数,多光谱指数在一定程度上消除了干扰,使其在对复杂植被结构的估算中也能保证一定的精度。在对天然草地叶绿素的估算中,多光谱指数显著提升了其估算精度。肖汉等(2014)提出了多光谱指数GCI (草地叶绿素含量指数),并估算了中国四川省松潘草原和内蒙古自治区贡格尔草原的草地叶绿素含量(R2=0.703),相比传统的CARI(叶绿素吸收比值指数)、SIPI(结构不敏感色素指数)和MTCI指数,它的敏感性更强,更适宜草地叶绿素估算。
从单一波段指数到复杂光谱指数,这种形式上的多样性使基于光谱指数的经验模型成为目前较实用、普适性较强的研究方法(董恒等, 2012)。与森林和农作物相比,草地受自身种类组成及层次结构的影响,较新的光谱指数显著提升了其叶绿素估算精度。许多研究中利用高光谱指数估算植被叶绿素含量的主要方法还是回归方法(特别是逐步回归),找出与叶绿素含量相关的波段并构造合适光谱指数,然后建立这些指数与叶绿素含量间的回归分析,进而建立回归模型。目前草地叶绿素估算常见回归形式有简单的线性回归,如:Chl=a+b×Index(Vuolo et al,2012; Wong et al,2013),其中Chl为叶绿素含量,Index为高光谱指数,a和b为拟合参数。
基于物理规律的辐射传输模型通过分析叶片或冠层叶绿素含量与辐射能量的作用过程,利用数学方法模拟得到植被叶片的反射率、透射率及冠层的反射率,为模型的前向过程。与之相反的是,从实测植被叶片的反射率、透射率及冠层的反射率数据获取植被叶片或冠层叶绿素含量的过程为模型的反向过程。遥感反演就是根据实测光谱信息结合模型的前向过程,求解或推算目标参数,也就是从实测的光谱反射率估算植被叶绿素含量(图2)。研究人员提出用不同方法解决辐射传输模型的反演问题,经常使用的反演算法包括数值优化方法、查找表法、人工神经网络和支持向量机回归(Kimes et al, 2000; Liang,2004)。相对于经验模型,辐射传输模型物理意义明确,不再局限于几个特定波长反射率,有效地利用了连续光谱数据,在叶绿素估算方面表现出更强的稳定性和可移植性,能估算不同植被叶片及冠层尺度叶绿素含量(Ustin et al,2004)。
图2 叶绿素反演的辐射传输模型方法
Fig.2 Radiative transfer models for estimating chlorophyll content
常用的辐射传输模型有叶片尺度的PROSPECT、LIBERTY、LEAFMOD等,冠层尺度的SAIL、NADI等及它们彼此之间的耦合模型,但上述模型主要应用于某一作物类型、某一森林植被及其混合形式(Newnham et al, 2001; Botha et al, 2010)。几年来辐射传输模型在草地叶绿素估算中的作用越来越重要,但天然草地由于自身复杂的种类组成和层次结构且容易受到人为因素干扰(施肥、放牧、刈割),导致上述许多模型不适用或者反演效果不好。基于叶片尺度辐射传输模型PROSPECT、冠层尺度传输模型SAIL及其耦合模型PROSAIL由于简单易用,逐渐移植到草地叶绿素估算中(Vohland et al, 2008; Si et al 2012)。
PROSPECT是Jacquemoud等(1990)基于对Allen平板的改进建立的叶片光学模型,它假设叶片是由N层同性质平板叠加而成,由N-1层空气隔开,光线的非漫射特性只存在于最顶层,而在叶子内部,光线被认为是各向同性。通过建立叶片结构参数、生物化学参数与叶片反射率和透射率的函数,模拟叶片在400~2500 nm的光学特性。其计算公式较为简单:
叶片—冠层辐射传输模型各个参数敏感性分析结果表明,在可见光波段,对模拟结果影响最大的参数是叶绿素含量,其贡献率达到60% (Bacour et al,2002);在近红外波段,影响最大的参数则是叶面积指数,贡献率达到50%以上(王李娟等,2014)。这表明,对于形态相对一致的植被叶片或者均匀的冠层来说,辐射传输模型效果较好,但是随着植被的混合,模型的精度呈现下降趋势。Jacquemoud等(1996)应用PROSPECT模型结合LOPEX93数据集反演了多种类型叶片叶绿素含量,但整体估算结果较差(R2=0.68);而Ma等(2012)根据不同叶片形态对PROSPECT模型逐一进行修正并估算叶绿素含量,发现逐一修正的结果其精度有了大幅度提高(R2由0.41上升到0.75)。
近年来研究人员开展了辐射传输模型反演草地叶绿素含量的研究,由于草地和其他植被的差异性,而且模型中的参数并不是针对草地设定的,所以反演结果和实际叶绿素观测结果会有一定程度的偏离(Vohland et al, 2008)。研究认为,辐射传输模型对异质性草地叶绿素反演效果总体较差,并且指出随着单位面积草类的增加,模型的反演精度呈下降趋势(Darvishzadeh et al, 2008)。尽管总体结果较差,但在不同尺度,模型反演结果存在明显差异。在叶片尺度,模型对草地叶绿素含量估算效果较差;而在冠层尺度,估算效果相对较好(Si et al,2012)。
目前植被叶绿素的估算重心仍在森林和农作物方面,针对草地叶绿素的研究相对薄弱。基于红边位置和光谱指数的经验模型在估算草地或其他植被叶绿素含量时,除了建立的回归模型不同外,并没有本质上的区别;但某些光谱指数是否适合于草地估算,仍有待于后续的研究工作证实; 基于物理规律的辐射传输模型则有很强的针对性,用于草地估算主要有叶片尺度的PROSPECT及冠层尺度的PROSAIL耦合模型。天然草地由于自身复杂的种类组成及层次结构且容易受到人为因素干扰(施肥、放牧、刈割),辐射传输模型的估算效果较差,还需要加以改进。经验模型依然是目前较实用、普适性较强的研究方法,尤其是其中的光谱指数法。
受限于高光谱数据和实际样点数据的获取,目前大部分叶绿素估算研究仍停留在叶片或者冠层尺度(冠层叶绿素含量=叶片叶绿素含量×叶面积指数)。另外,冠层尺度叶绿素含量的提取会受到土壤背景及植被冠层结构的干扰,尤其是叶面积指数干扰。经验模型方法是一种近似方法,可针对不同尺度建立不同的回归模型;而辐射传输模型PROSPECT在叶片尺度的估算效果较差,而PROSAIL模型在冠层尺度估算效果一般。
经验模型未来的工作重点应在现有光谱指数的基础上,结合不同类型草地特点构造新的光谱指数,以取得比现有指数更好的估算效果。辐射传输模型有多个输入参数,在进一步明晰其运行原理的情况下,针对草地类型特点确定合适的模型参数以改进模型估算效果,从而提高草地叶绿素含量的估算水平。当前研究仍然集中在叶片及冠层尺度,由叶片尺度拓展到冠层尺度进而拓展到像元尺度进而实现大面积草地叶绿素含量估算,是草地叶绿素估算走向实际应用的必要途径。在此基础上,结合多时相遥感数据实现草地叶绿素含量的连续估算,为长期合理利用和保护草地资源提供保障,是一项既具有重要意义又具有挑战性的工作。
The authors have declared that no competing interests exist.
| [1] |
基于HJ星高光谱数据红边参数的冬小麦叶面积指数反演 [J].
针对我国HJ-1A星搭载的高 光谱成像仪(HSI)数据,探索基于HJ星高光谱影像的LAI反演研究,本文利用inverted Gaussian模型提取红谷位置、红边位置、红边振幅以及红边斜率4个红边参数,结合2009年4月、5月两期同步地面观测LAI数据,经过回归分析构 建了反演叶面积指数的最优红边参数模型.结果表明红边位置、红边斜率和红边振幅与叶面积指数都达到了极显著相关,R2分别为0.5592,0.7796和 0.8107说明HJ星高光谱影像数据在叶面积指数反演方面有很大的应用潜力.
Study on monitoring the winter wheat Leaf Area Index based on HJ-1 HSI red edge Parameters [J].
针对我国HJ-1A星搭载的高 光谱成像仪(HSI)数据,探索基于HJ星高光谱影像的LAI反演研究,本文利用inverted Gaussian模型提取红谷位置、红边位置、红边振幅以及红边斜率4个红边参数,结合2009年4月、5月两期同步地面观测LAI数据,经过回归分析构 建了反演叶面积指数的最优红边参数模型.结果表明红边位置、红边斜率和红边振幅与叶面积指数都达到了极显著相关,R2分别为0.5592,0.7796和 0.8107说明HJ星高光谱影像数据在叶面积指数反演方面有很大的应用潜力.
|
| [2] |
一种改进的叶绿素提取植被指数 [J].https://doi.org/10.3724/SP.J.1010.2012.00336 URL [本文引用: 1] 摘要
对MERIS陆地叶绿素指数(MTCI)进行了改进,提出了改性的MERIS陆地叶绿素指数(M-MTCI).该指数在植被覆盖度较高时(LAI〉1),可获得比MTCI和双峰冠层氮素指数(DCNI)更好的叶绿素提取精度,且比MTCI有更好的抗LAI干扰能力.这些结果的验证是建立在模拟以及实测数据的基础上,具有较好的可靠性,所以M-MTCI具有很好地监测植被叶绿素含量的潜力.
A modified vegetation index for crop canopy chlorophyll content retrieval [J].https://doi.org/10.3724/SP.J.1010.2012.00336 URL [本文引用: 1] 摘要
对MERIS陆地叶绿素指数(MTCI)进行了改进,提出了改性的MERIS陆地叶绿素指数(M-MTCI).该指数在植被覆盖度较高时(LAI〉1),可获得比MTCI和双峰冠层氮素指数(DCNI)更好的叶绿素提取精度,且比MTCI有更好的抗LAI干扰能力.这些结果的验证是建立在模拟以及实测数据的基础上,具有较好的可靠性,所以M-MTCI具有很好地监测植被叶绿素含量的潜力.
|
| [3] |
PROSAIL模型的参数敏感性研究 [J].https://doi.org/10.11873/j.issn.1004-0323.2014.2.0219 URL Magsci [本文引用: 1] 摘要
为了对植被参数反演以及模型优化提供一定的参考,采用扩展傅立叶幅度灵敏度检验法(EFAST)对PROSAIL模型的各输入参数进行全局敏感性定量化分 析,筛选出对模型结果影响最大的参数.结果表明:在红光波段,总敏感指数大于0.1的参数依次为Cab、Ns、Hspot和LAI,其中Cab的总敏感性 指数最大为0.489,是在红光波段范围对PROSAIL模型模拟结果影响最显著的参数.在近红外波段,总敏感指数大于0.1的参数依次为LAI、Cm、 ALA、Ns和Hspot,LAI是近红外波段区域对PROSAIL模型模拟结果影响最大的参数,其总敏感性指数高达0.512.
Sensitivity analysis of vegetation parameters based on PROSAIL model [J].https://doi.org/10.11873/j.issn.1004-0323.2014.2.0219 URL Magsci [本文引用: 1] 摘要
为了对植被参数反演以及模型优化提供一定的参考,采用扩展傅立叶幅度灵敏度检验法(EFAST)对PROSAIL模型的各输入参数进行全局敏感性定量化分 析,筛选出对模型结果影响最大的参数.结果表明:在红光波段,总敏感指数大于0.1的参数依次为Cab、Ns、Hspot和LAI,其中Cab的总敏感性 指数最大为0.489,是在红光波段范围对PROSAIL模型模拟结果影响最显著的参数.在近红外波段,总敏感指数大于0.1的参数依次为LAI、Cm、 ALA、Ns和Hspot,LAI是近红外波段区域对PROSAIL模型模拟结果影响最大的参数,其总敏感性指数高达0.512.
|
| [4] |
基于光谱分析的草地叶绿素含量估测植被指数 [J].Vegetation index estimation by chlorophyll content of grassland based on spectral analysis [J]. |
| [5] |
采用不同红边位置提取技术估测蔬菜叶绿素含量的比较研究 [J].https://doi.org/10.3321/j.issn:1002-6819.2008.09.033 URL Magsci [本文引用: 1] 摘要
红边位置常被用来估测植被的叶绿素/氮素含量、叶面积以及探测植被胁迫,其精确计算十分重要。目前其计算主要是基于导数光谱或曲线拟合技术,但哪种方法能更有效地探测植被的叶绿素/氮素含量,还没有一个定论。本研究以菠菜的叶片高光谱为例,详细比较了目前常用的6种红边位置提取方法与叶片叶绿素之间的关系,并从其对叶绿素含量预测的准确度、计算的难易程度、所需数据的精度及适用范围等几个方面进行了讨论。结果表明,叶片红边位置的计算结果对选择方法的依赖性很大,几种计算方法提取的红边位置与叶绿素含量的相关性均较好。四点线性内插法计算的红边位置往往偏大,最大一阶导数法与叶绿素含量的关系存在着明显的不连续性,拉格朗日内插法、倒高斯模型法在一定程度上存在着对高叶绿素含量的饱和现象,多项式拟合法对拟合波段区间、最高项次及光谱分辨率等比较灵敏而导致结果不够稳定,而线性外推法计算出的红边位置对叶绿素含量最为敏感,预测的准确度最高,且计算相对比较简单,并能适用于较宽波段的遥感数据。在实际应用时还应根据具体情况而选择合适的红边位置提取方法。
Comparative study on estimation of chlorophyll content in spinach leaves using various red edge position extraction techniques [J].https://doi.org/10.3321/j.issn:1002-6819.2008.09.033 URL Magsci [本文引用: 1] 摘要
红边位置常被用来估测植被的叶绿素/氮素含量、叶面积以及探测植被胁迫,其精确计算十分重要。目前其计算主要是基于导数光谱或曲线拟合技术,但哪种方法能更有效地探测植被的叶绿素/氮素含量,还没有一个定论。本研究以菠菜的叶片高光谱为例,详细比较了目前常用的6种红边位置提取方法与叶片叶绿素之间的关系,并从其对叶绿素含量预测的准确度、计算的难易程度、所需数据的精度及适用范围等几个方面进行了讨论。结果表明,叶片红边位置的计算结果对选择方法的依赖性很大,几种计算方法提取的红边位置与叶绿素含量的相关性均较好。四点线性内插法计算的红边位置往往偏大,最大一阶导数法与叶绿素含量的关系存在着明显的不连续性,拉格朗日内插法、倒高斯模型法在一定程度上存在着对高叶绿素含量的饱和现象,多项式拟合法对拟合波段区间、最高项次及光谱分辨率等比较灵敏而导致结果不够稳定,而线性外推法计算出的红边位置对叶绿素含量最为敏感,预测的准确度最高,且计算相对比较简单,并能适用于较宽波段的遥感数据。在实际应用时还应根据具体情况而选择合适的红边位置提取方法。
|
| [6] |
不同算法红边位置监测小麦冠层氮素营养指标的比较 [J].https://doi.org/10.3864/j.issn.0578-1752.2010.13.005 URL Magsci [本文引用: 1] 摘要
[目的]红边位置常被用于监测作物叶片氮素营养状况.本文旨在通 过不同算法提取红边位置,分析并比较不同算法提取的红边位置对氮素营养监测模型的准确性和可靠性差异,确定监测小麦叶片氮素营养的最佳红边位置算法及定量 模型.[方法]基于不同施氮水平、播种密度、品种类型和生育时期的小麦田间试验,系统分析不同算法的红边位置(一阶微分、倒高斯法、多项式拟合法、四点内 插法、拉格朗日法、线性外推法)与冠层叶片氮素营养指标的定量关系,比较不同算法红边位置对氮素营养监测的准确性和可靠性.[结果]线性外推法为计算小麦 红边位置的最佳算法,并建立了基于线性外推法的小麦冠层叶片氮素营养定量监测模型.[结论]研究结果为小麦冠层叶片氮素营养指标的可靠监测提供了有效途 径.
Comparative study on monitoring canopy leaf nitrogen status on red edge position with different algorithms in wheat [J].https://doi.org/10.3864/j.issn.0578-1752.2010.13.005 URL Magsci [本文引用: 1] 摘要
[目的]红边位置常被用于监测作物叶片氮素营养状况.本文旨在通 过不同算法提取红边位置,分析并比较不同算法提取的红边位置对氮素营养监测模型的准确性和可靠性差异,确定监测小麦叶片氮素营养的最佳红边位置算法及定量 模型.[方法]基于不同施氮水平、播种密度、品种类型和生育时期的小麦田间试验,系统分析不同算法的红边位置(一阶微分、倒高斯法、多项式拟合法、四点内 插法、拉格朗日法、线性外推法)与冠层叶片氮素营养指标的定量关系,比较不同算法红边位置对氮素营养监测的准确性和可靠性.[结果]线性外推法为计算小麦 红边位置的最佳算法,并建立了基于线性外推法的小麦冠层叶片氮素营养定量监测模型.[结论]研究结果为小麦冠层叶片氮素营养指标的可靠监测提供了有效途 径.
|
| [7] |
氮沉降强度和频率对羊草叶绿素含量的影响 [J].https://doi.org/10.5846/stxb201207050939 URL Magsci [本文引用: 1] 摘要
氮沉降强度和沉降频率是决定其 对陆地生态系统影响的重要决定因素。结合当前世界上各地区的氮沉降状况,设计了包括9个氮沉降梯度的长期控制实验,并将氮沉降分为两种沉降频率(1年2次 和每月1次)、草原管理方式分为封育和割草两种。基于上述实验平台的优势植物(羊草)叶片叶绿素含量来探讨氮沉降方式(强度和频度)和草原管理方式(封育 和打草)对草地生态系统结构和功能的影响。实验结果表明:1)氮沉降显著增加了植物叶片叶绿素含量(P0.001);2)每月1次模拟氮沉降处理的植物叶 绿素含量显著低于1年2次氮沉降的处理(P=0.026);3)在相同的氮沉降强度处理下,打草地相对于封育草地具有更高的叶绿素含量 (P=0.012);4)羊草叶绿素含量与其叶片氮浓度显著正相关(P0.001);5)羊草叶绿素含量与该植株高度极显著正相关(P0.001)。结果 表明1年1次或1年2次的模拟氮沉降(类似于施肥处理或低频率的氮素添加实验)可能会夸大真实氮沉降对草地生态系统结构和功能的影响,今后在外推类似实验 结论时应更加谨慎。此外,氮沉降下打草管理有利于增加了植物叶片叶绿素含量,可提高植物的光合作用,因此在未来氮沉降加剧状况下,打草可以保持或提高内蒙 古草地生产力,有利于该地区草地的可持续利用。
Nitrogen deposition and Leymus chinensis leaf chlorophyll content in Inner Mongolian grassland [J].https://doi.org/10.5846/stxb201207050939 URL Magsci [本文引用: 1] 摘要
氮沉降强度和沉降频率是决定其 对陆地生态系统影响的重要决定因素。结合当前世界上各地区的氮沉降状况,设计了包括9个氮沉降梯度的长期控制实验,并将氮沉降分为两种沉降频率(1年2次 和每月1次)、草原管理方式分为封育和割草两种。基于上述实验平台的优势植物(羊草)叶片叶绿素含量来探讨氮沉降方式(强度和频度)和草原管理方式(封育 和打草)对草地生态系统结构和功能的影响。实验结果表明:1)氮沉降显著增加了植物叶片叶绿素含量(P0.001);2)每月1次模拟氮沉降处理的植物叶 绿素含量显著低于1年2次氮沉降的处理(P=0.026);3)在相同的氮沉降强度处理下,打草地相对于封育草地具有更高的叶绿素含量 (P=0.012);4)羊草叶绿素含量与其叶片氮浓度显著正相关(P0.001);5)羊草叶绿素含量与该植株高度极显著正相关(P0.001)。结果 表明1年1次或1年2次的模拟氮沉降(类似于施肥处理或低频率的氮素添加实验)可能会夸大真实氮沉降对草地生态系统结构和功能的影响,今后在外推类似实验 结论时应更加谨慎。此外,氮沉降下打草管理有利于增加了植物叶片叶绿素含量,可提高植物的光合作用,因此在未来氮沉降加剧状况下,打草可以保持或提高内蒙 古草地生产力,有利于该地区草地的可持续利用。
|
| [8] |
Narrowband spectral indices for the estimation of chlorophyl along a precipitation gradient [ |
| [9] |
Ecosystem structure along bioclimatic gradients in Hawai'i from imaging spectroscopy [J].https://doi.org/10.1016/j.rse.2005.04.008 URL [本文引用: 1] 摘要
The Hawaiian Islands contain more than two-thirds of the life zones delineated by Holdridge, L.R., 1947. Determination of world plant formations from simple climate data. Science, 105, 367–368, and is thus an ideal testing ground for remote sensing studies of ecosystem function and structure. We tested the generality of imaging spectroscopy with “tied” red-edge and shortwave-infrared (RE-SWIR2) spectral mixture modeling for automated analysis of the lateral distribution of plant tissues and bare substrate across diverse bioclimatic gradients in Hawai'i. Unique quantities of the fractional cover of photosynthetic and non-photosynthetic vegetation (PV, NPV) and bare substrate identified fundamental differences in ecosystem structure across life zones. There was a 6520-fold increase in fractional PV cover with a 10-fold increase in mean annual precipitation (≤ 250–2000 mm year). This rate of increase diminished from 2000 to 3000 mm yearof rainfall, suggesting that photosynthetic canopy cover may be limited by water saturation at 3000 mm year. The
|
| [10] |
Information content of HyMap hyperspectral imagery [ |
| [11] |
Spectral indices for estimating photosynthetic pigment concentrations: A test using senescent tree leaves [J].https://doi.org/10.1080/014311698215919 URL [本文引用: 1] 摘要
Abstract. The possibility of estimating the concentration of individual photosynthetic pigments within vegetation from reflectance spectra offers great promise for the use of remote sensing to assess physiological status, species type and productivity. This study evaluates a number of spectral indices for estimating pigment concentrations at the leaf scale, using samples from deciduous trees at various stages of senescence. Two new indices (PSSR and PSND) are developed which have advantages over previous techniques. The optimal individual wavebands for pigment estimation are identified empirically as 680nm for chlorophyll a , 635nm for chlorophyll b and 470nm for the carotenoids. These wavebands are justified theoretically and are shown to improve the performance of many of the spectral indices tested. Strong predictive models are demonstrated for chlorophyll a and b , but not for the carotenoids and the paper explores the reasons for this.
|
| [12] |
Relationships between spectral reflectance and pigment concentrations in stacks of deciduous broadleaves [J].https://doi.org/10.1016/S0034-4257(99)00048-6 URL 摘要
This article presents the findings of a laboratory experiment using stacks of leaves obtained from four species of deciduous tree at various stages of senescence. This methodology generated a wide variation in pigment concentrations (per unit leaf area and per unit ground area) and leaf area index, as may be expected at the plant canopy scale, and provided independent variation between the chlorophylls and carotenoids and leaf area index. Spectral reflectance was measured for each leaf increment of each stack using a spectroradiometer and these data were used to evaluate the nature and strength of relationships between a number of existing and novel spectral transformations and the concentrations of pigments (per unit ground area) within the leaf stacks. Reflectance in narrow wavebands within the visible region was moderately related to chlorophyll concentrations, while ratio indices, employing wavebands in the near- infrared and visible, particularly the green, were more successful. While the wavelength position of the red edge was related to chlorophyll concentration, characteristics of the amplitude of the first and second derivatives of reflectance and pseudo absorbance were more strongly correlated with chlorophyll. No transformation of spectral reflectance that was tested was strongly related to the concentration of carotenoids but two ratio indices were highly correlated with the ratio of carotenoids to chlorophyll Interestingly, leaf area index (LAI) was unrelated to all spectral ratio indices including the broad-band normalized-difference and the simple ratio vegetation indices. This indicates that spectral indices may have limited applicability for estimating the LAI of vegetation canopies when the leaves that comprise these canopies have differing chlorophyll concentrations (per unit leaf area).
|
| [13] |
Numerical procedures and computer program for fitting an inverted Gaussian model to vegetation reflectance data [J].https://doi.org/10.1016/0098-3004(88)90065-9 URL 摘要
A FORTRAN 77 program for making the fitting calculations is included in the Appendix.
|
| [14] |
Shape of the red edge as vitality indicator for plants [J].https://doi.org/10.1080/01431169008955127 URL [本文引用: 1] 摘要
The shift of the red edge in the reflection spectra of vegetation targets is a known phenomenon documenting changes in the biological status of plants. In our study we analysed the variability of red edge reflection in dependency of differently managed field plots, The results indicate that the red edge is not fully described by the shift of the main inflection point, but has to be considered as a collection of several different and possibly independent features, each of them influenced by biological parameters of the plants. Thus, taking all features, the red edge as derived from high resolution spectra may provide enough information to detect small differences in the chemical and morphological status of plants.
|
| [15] |
Non-destructive estimation of wheat leaf chlorophyll content from hyperspectral measurements through analytical model inversion [J].https://doi.org/10.1080/01431160902926574 URL [本文引用: 1] 摘要
Optimizing nitrogen (N) fertilization in crop production by in-season measurements of crop N status may improve fertilizer N use efficiency. Hyperspectral measurements may be used to assess crop N status indirectly by estimating leaf and canopy chlorophyll content. This study evaluated the ability of the PROSAIL canopy-level reflectance model to predict leaf chlorophyll content of spring wheat ...
|
| [16] |
Early detection of plant stress by digital imaging within narrow stress-sensitive wavebands [J].https://doi.org/10.1016/0034-4257(94)90079-5 URL [本文引用: 1] 摘要
Digital images of soybean canopies [Glycine max (L.) Merrill] were obtained within selected narrow wavebands (6–10 nm bandwidths) to determine their capability for early detection of plant stress. Images and physiological measurements of stress were acquired 2 days, 4 days, and 7 days following application of control, drought, and herbicide [(3,4-dichlorophenyl)-1, 1-dimethylurea, or DCMU] treatments. As a result of frequent rainfall, drought stress never occurred. However, exposure to herbicide rapidly induced plant stress. By day 4, the ratio of variable to maximum leaf fluorescence ( F v / F m ) decreased and leaf water potentials ( ψ w ) increased in the herbicide treated soybean, indicating damage to the photosynthetic apparatus and stomatal closure. Also, Munsell leaf color had increased from approximately 5GY 4.6/5.7 to a lighter green-yellow value. Canopy reflectances at 670 nm, 694 nm, and in the 410–740 nm band ( R vis ), as well as reflectance at 694 nm divided by reflectance at 760 nm ( R 694 / R 760 ), detected stress simultaneously with the physiological measurements and increased consistently with stress through day 7. Reflectances at 420 nm and 600 nm, together with R 600 / R 760 and R vis / R 760 , did not increase until leaves were yellow or brown and wilted and canopies had begun to collapse on day 7. None of the reflectance or reflectance ratio images detected stress prior to visible color changes. This was attributed primarily to the rapid inducement of chlorosis by the herbicide. Reflectance in narrow wavebands within the 690–700 nm region and its ratio with near-infrared reflectance should provide earlier detection of stress-induced chlorosis compared with broad band systems or narrow bands located at lesser wavelengths.
|
| [17] |
Ratio analysis of reflectance spectra (RARS): An algorithm for the remote estimation of the concentrations of chlorophyll a, chlorophyll b, and carotenoids in soybean leaves [J].https://doi.org/10.1109/IGARSS.1990.688815 URL 摘要
ABSTRACT An algorithm has been developed by which additional information may extracted from a reflectance spectra. This involves the ratioing of reflectance spectra against a reference spectra. This gives a ratio curve by which a more sensitive differentiation among spectra is possible. The use of a ratio curve allows also the identification of the pigments contributing to a reflectance spectra. The high correlation of certain bands of the ratio curve with the photosynthetic pigments provides the basis for a nondestructive measurement of these pigments. Unlike the reflectance spectra, the ratio curve is similar to the action spectra of photosynthesis.
|
| [18] |
New spectral indicator assessing the efficiency of crop nitrogen treatment in corn and wheat [J].https://doi.org/10.1016/j.rse.2010.04.006 URL 摘要
To reduce environment pollution from cropping activities, a reliable indicator of crop N status is needed for site-specific N management in agricultural fields. Nitrogen Nutrition Index (NNI) can be a valuable candidate, but its measurement relies on tedious sampling and laboratory analysis. This study proposes a new spectral index to estimate plant nitrogen (N) concentration, which is a critic...
|
| [19] |
A new technique for extracting the red edge position from hyperspectral data: The linear extrapolation method [J].https://doi.org/10.1016/j.rse.2005.12.011 URL 摘要
ABSTRACT There is increasing interest in using hyperspectral data for quantitative characterization of vegetation in spatial and temporal scopes. Many spectral indices are being developed to improve vegetation sensitivity by minimizing the background influence. The chlorophyll absorption continuum index (CACI) is such a measure to calculate the spectral continuum on which the analyses are based on the area of the troughs spanned by the spectral continuum. However, different values of CACI were obtained in this method because different positions of continuums were determined by different users. Furthermore, the sensitivity of CACI to agronomic parameters such as green leaf chlorophyll density (GLCD) has been reduced because the fixed positions of continuums are determined when the red edge shifted with the change in GLCD. A modified chlorophyll absorption continuum index (MCACI) is presented in this article. The red edge inflection point (REIP) replaces the maximum reflectance point (MRP) in near-infrared (NIR) shoulder on the CACI continuum. This MCACI has been proved to increase the sensitivity and predictive power of GLCD.
|
| [20] |
Assessment of heavy metal contamination river floodplains by using the red-edge index [C]// |
| [21] |
Using hyperspectral remote sensing data for retrieving total canopy chlorophyll and nitrogen content [C]// |
| [22] |
Study of heavy metal contamination in river floodplains using the red-edge position in spectroscopic data [J]. |
| [23] |
The fine-scale mapping of grassland protein densities [J]. |
| [24] |
Inversion of a radiative transfer model for estimating vegetation LAI and chlorophyll in a heterogeneous grassland [J]. |
| [25] |
Evaluation of the MERIS terrestrial chlorophyll index (MTCI) [J].https://doi.org/10.1109/IGARSS.2004.1369009 URL Magsci 摘要
The MEdium Resolution Imaging Spectrometer (MERIS), one of the payloads on Envisat, has fine spectral resolution, moderate spatial resolution and a three day repeat cycle. This makes MERIS a potentially valuable sensor for the measurement and monitoring of terrestrial environments at regional to global scales. The red edge, which results from an abrupt change in reflectance in red and near-infrared wavelength has a location that is related directly to the chlorophyll content of vegetation. A new index called the MERIS terrestrial chlorophyll index (MTCI) uses data in three red/NIR wavebands centred at 681.25nm, 705nm and 753.75nm (bands 8, 9 and 10 in the MERIS standard band setting). The MTCI is easy to calculate and can be automated. Preliminary indirect evaluation using model, field and MERIS data suggested its sensitivity, to notably high values of chlorophyll content and its limited sensitivity to spatial resolution or atmospheric effects. As a result this index is now a standard level-2 product of the European Space Agency. For direct MTCI evaluation two different approaches were used. First, the MTCI/chlorophyll content relationship were determined using a chlorophyll content surrogate for sites in southern Vietnam and second, the MTCI/chlorophyll relationship was determined using actual chlorophyll content for sites in the New Forest, UK and for plots in the greenhouse. Forests in southern Vietnam were contaminated heavily with Agent Orange during the Vietnam War. The contamination level was so high that it led to a long term decrease in chlorophyll content within forests that have long since regained full canopy cover. In this approach the amount of Agent Orange dropped on to the forest between 1965 and 1971 was used as a surrogate (inverse) for contemporary chlorophyll content and was related to current MTCI at selected forest sites. The resulting relationship was negative. Further per pixel investigation of the MTCI/Agent Orange concentration relationship is under way for large forest regions. In the second approach MTCI was related directly to chlorophyll content at two scales and the initial resulting relationships were positive. Further plans involve the evaluation of the MTCI at local, regional and eventually global scales.
|
| [26] |
Technical note A new technique for interpolating the reflectance red edge position [J]. |
| [27] |
Estimating chlorophyll content of crops from hyperspectral data using a normalized area over reflectance curve (NAOC) [J].https://doi.org/10.1016/j.jag.2010.02.003 URL Magsci 摘要
The Normalized Area Over reflectance Curve (NAOC) is proposed as a new index for remote sensing estimation of the leaf chlorophyll content of heterogeneous areas with different crops, different canopies and different types of bare soil. This index is based on the calculation of the area over the reflectance curve obtained by high spectral resolution reflectance measurements, determined, from the integral of the red–near-infrared interval, divided by the maximum reflectance in that spectral region. For this, use has been made of the experimental data of the SPARC campaigns, where in situ measurements were made of leaf chlorophyll content, LAI and fCOVER of 9 different crops – thus, yielding 300 different values with broad variability of these biophysical parameters. In addition, Proba/CHRIS hyperspectral images were obtained simultaneously to the ground measurements. By comparing the spectra of each pixel with its experimental leaf chlorophyll value, the NAOC was proven to exhibit a linear correlation to chlorophyll content. Calculating the correlation between these variables in the 600–80002nm interval, the best correlation was obtained by computing the integral of the spectral reflectance curve between 643 and 79502nm, which practically covers the spectral range of maximum chlorophyll absorption (at around 67002nm) and maximum leaf reflectance in the infrared (750–80002nm). Based on a Proba/CHRIS image, a chlorophyll map was generated using NAOC and compared with the land-use (crops classification) map. The method yielded a leaf chlorophyll content map of the study area, comprising a large heterogeneous zone. An analysis was made to determine whether the method also serves to estimate the total chlorophyll content of a canopy, multiplying the leaf chlorophyll content by the LAI. To validate the method, use was made of the data from another campaign ((SEN2FLEX), in which measurements were made of different biophysical parameters of 7 crops, and hyperspectral images were obtained with the CASI imaging radiometer from an aircraft. Applying the method to a CASI image, a map of leaf chlorophyll content was obtained, which on, establishing comparisons with the experimental data allowed us to estimate chlorophyll with a root mean square error of 4.202μg/cm 2 , similar or smaller than other methods but with the improvement of applicability to a large set of different crop types.
|
| [28] |
PROSPECT-4 and 5: Advances in the leaf optical properties model separating photosynthetic pigments [J].https://doi.org/10.1016/j.rse.2008.02.012 URL [本文引用: 1] 摘要
The PROSPECT leaf optical model has, to date, combined the effects of photosynthetic pigments, but a finer discrimination among the key pigments is important for physiological and ecological applications of remote sensing. Here we present a new calibration and validation of PROSPECT that separates plant pigment contributions to the visible spectrum using several comprehensive datasets containing hundreds of leaves collected in a wide range of ecosystem types. These data include leaf biochemical (chlorophyll, chlorophyll, carotenoids, water, and dry matter) and optical properties (directional–hemispherical reflectance and transmittance measured from 400 nm to 2450 nm). We first provide distinctspecific absorption coefficients for each biochemical constituent and determine an average refractive index of the leaf interior. Then we invert the model on independent datasets to check the prediction of the biochemical content of intact leaves. The main result of this study is that the new chlorophyll and carotenoid specific absorption coefficients agree well with availableabsorption spectra, and that the new refractive index displays interesting spectral features in the visible, in accordance with physical principles. Moreover, we improve the chlorophyll estimation (RMSE = 9 µg/cm) and obtain very encouraging results with carotenoids (RMSE = 3 µg/cm). Reconstruction of reflectance and transmittance in the 400–2450 nm wavelength domain using PROSPECT is also excellent, with small errors and low to negligible biases. Improvements are particularly noticeable for leaves with low pigment content.
|
| [29] |
Relationship between contents of chlorophyll (a+b) (SPAD values) and nitrogen of some temperate grasses [J].https://doi.org/10.1023/B:PHOT.0000011963.43628.15 Magsci [本文引用: 1] 摘要
<a name="Abs1"></a>In a field experiment the chlorophyll (<i>a+b</i>) (<i>SPAD</i> readings) and nitrogen contents of three grass species (<i>Festuca arundinacea</i> Schreb., <i>Lolium perenne</i> L., and <i>Lolium multiflorum</i> Lam.) and three intergeneric hybrids of <i>Festuca pratensis</i> Huds. × <i>Lolium multiflorum</i> Lam. and <i>Festuca arundinacea</i> Schreb. × <i>Lolium multiflorum</i> Lam. were measured. Close relationships were found between <i>SPAD</i> readings and nitrogen leaf content (<i>r</i> <sup>2</sup> = 0.873<sup>**</sup> 0.491<sup>**</sup> and 0.938<sup>**</sup>) for the 1<sup>st</sup>, 2<sup>nd</sup>, and 3<sup>rd</sup> cut, respectively. <i>SPAD</i> readings and N contents were closely correlated (<i>r</i> = 0.836<sup>**</sup>) confirming that <i>SPAD</i> measurements could be used in grass selection and/or breeding for high N concentration in herbage.
|
| [30] |
The chlorophyll fluorescence ratio R735/F700 as an accurate measure of the chlorophyll content in plants [J]. |
| [31] |
Signature analysis of leaf reflectance spectra: algorithm development for remote sensing of chlorophyll [J].https://doi.org/10.1016/S0176-1617(96)80284-7 URL 摘要
The goal of the study is to investigate the basic spectral properties of plant leaves to develop spectral indices more sensitive to chlorophyll concentration than the presently widely used Notmalized Difference Vegetation Index. These indices can serve as indicators of stress, senescence, and disease in higher plants. The spectral reflectance of senescing leaves of two deciduous species (maple and chestnut) as well as their pigment content were measured. Spectral indices were developed using reflectances corresponding to wavelengths with maximum and minimum sensitivity to variation in pigment concentration. The signature analysis of reflectance spectra indicated that, for a wide range of leaf greenness (completely yellow to dark green leaves), the maximum sensitivity of reflectance coincides with the maximum absorption of chlorophyll a at 670 nm. However, for yellow-green to green leaves (minimum chlorophyll a as low as 3-5 nmol/cm 2 ), the reflectance near 670nm is not sensitive to chlorophyll concentration due to saturation effects. Therefore, it seems inappropriate to use this spectral band for pigment estimation in yellow-green to green vegetation. The spectral bands ranging from 400 to 480 nm and above 730 nm are not sensitive to chlorophyll concentration as found for 670 nm. The reflectances at these wavelengths could be used as references in the vegetation indices. Maximum sensitivity to chlorophyll a concentration was found at 550-560 nm and 700-710 nm. Reflectances at 700 nm correlated very well with that at 550 nm for a wide range of chlorophyll concentrations for both plant species studied. The inverse reflectance, R 550 ) -1 and (R 700 ) -1 are proportional to chlorophyll a concentration; therefore indices R 750 /R 550 and R 750 /R 700 are directly proportional (correlation r 2 > 0.95) to chlorophyll concentration. These indices were tested for a wide range of chlorophyll a concentration, using several independent data sets. The estimation error in the derivation of chlorophyll concentration from the indices is assessed to be less than 1.2 nmol/cm 2 .
|
| [32] |
Detection of red edge position and chlorophyll content by reflectance measurements near 700 nm [J].https://doi.org/10.1016/S0176-1617(96)80285-9 URL 摘要
Pigment contents was determined in and high spectral resolution reflectance measurements were acquired for spring, summer and autumn maple and horse chestnut leaves covering a wide range of chlorophyll content. Consistent and diagnostic differences in the red edge range (680-750 nm) of the reflectance spectrum were obtained for the various leaf samples of both species studied. This included the differences in the wavelength position of the red edge and in the reflectance values in the range of 690 to 710 nm. Both characteristics were found to be dependent on leaf chlorophyll concentration. The first derivative of reflectance spectra showed four peaks at 685-706, 710, 725 and 740 nm that were dependent in different degree on leaf age and pigment concentration in the leaves. The position and the magnitude of the first peak showed a high correlation with the leaf chlorophyll concentration. Reflectance at 700 nm was linearly dependent on the wavelength of the first peak. Variation of inflection point position with change in chlorophyll content was found small for yellow-green to dark green leaves (total chlorophyll in the range above 10 nmol/cm 2 ). Reflectance near 700 nm was found to be a very sensitive indicator of the red edge position as well as of chlorophyll concentration. The ratio of reflectances at 750 nm to that near 700 nm (R 750 /R 700 ) was directly proportional (correlation r 2 > 0.95) to chlorophyll concentration. The ratio R 750 /R 700 as a newly established index for non-invasive in-vivo chlorophyll determination was tested by independent data sets in the range of Chl contents from 0.6 to more than 60nmol/cm 2 of maple and chestnut leaves with an estimation error of Chl of less than 3.7 nmol/cm 2 .
|
| [33] |
High spectral resolution: Determination of spectral shifts between the red and the near infrared [J]. |
| [34] |
Integrated narrow-band vegetation indices for prediction of crop chlorophyll content for application to precision agriculture [J].https://doi.org/10.1016/S0034-4257(02)00018-4 URL [本文引用: 1] 摘要
Recent studies have demonstrated the usefulness of optical indices from hyperspectral remote sensing in the assessment of vegetation biophysical variables both in forestry and agriculture. Those indices are, however, the combined response to variations of several vegetation and environmental properties, such as Leaf Area Index (LAI), leaf chlorophyll content, canopy shadows, and background soil reflectance. Of particular significance to precision agriculture is chlorophyll content, an indicator of photosynthesis activity, which is related to the nitrogen concentration in green vegetation and serves as a measure of the crop response to nitrogen application. This paper presents a combined modeling and indices-based approach to predicting the crop chlorophyll content from remote sensing data while minimizing LAI (vegetation parameter) influence and underlying soil (background) effects. This combined method has been developed first using simulated data and followed by evaluation in terms of quantitative predictive capability using real hyperspectral airborne data. Simulations consisted of leaf and canopy reflectance modeling with PROSPECT and SAILH radiative transfer models. In this modeling study, we developed an index that integrates advantages of indices minimizing soil background effects and indices that are sensitive to chlorophyll concentration. Simulated data have shown that the proposed index Transformed Chlorophyll Absorption in Reflectance Index/Optimized Soil-Adjusted Vegetation Index (TCARI/OSAVI) is both very sensitive to chlorophyll content variations and very resistant to the variations of LAI and solar zenith angle. It was therefore possible to generate a predictive equation to estimate leaf chlorophyll content from the combined optical index derived from above-canopy reflectance. This relationship was evaluated by application to hyperspectral CASI imagery collected over corn crops in three experimental farms from Ontario and Quebec, Canada. The results presented here are from the L'Acadie, Quebec, Agriculture and Agri-Food Canada research site. Images of predicted leaf chlorophyll content were generated. Evaluation showed chlorophyll variability over crop plots with various levels of nitrogen, and revealed an excellent agreement with ground truth, with a correlation of r 2 =.81 between estimated and field measured chlorophyll content data.
|
| [35] |
The red edge of plant leaf reflectance [J].https://doi.org/10.1080/01431168308948546 URL [本文引用: 1] 摘要
ABSTRACT A detailed study of the red edge spectral feature of green vegetation based on laboratory reflectance spectrophotometry is presented. A parameter lambda is defined as the wavelength is defined as the wavelength of maximum slope and found to be dependent on chlorophyll concentration. Species, development stage, leaf layering, and leaf water content of vegetation also influences lambda. The maximum slope parameter is found to be independent of simulated ground area coverage. The results are interpreted in terms of Beer's Law and Kubelka-Munk theory. The chlorophyll concentration dependence of lambda seems to be explained in terms of a pure absorption effect, and it is suggested that the existence of two lambda components arises from leaf scattering properties. The results indicate that red edge measurements will be valuable for assessment of vegetative chlorophyll status and leaf area index independently of ground cover variations, and will be particularly suitable for early stress detection.
|
| [36] |
PROSPECT: A model of leaf optical properties spectra [J].https://doi.org/10.1016/0034-4257(90)90100-Z URL [本文引用: 1] 摘要
ABSTRACT PROSPECT is a radiative transfer model based of Allen's generalized “plate model” that represents the optical properties of plant leaves from 400 nm to 2500 nm. Scattering is described by a spectral refractive index (n) and a parameter characterizing the leaf mesophyll structure (N). Absorption is modeled using pigment concentration (Ca+b), water content (Cw), and the corresponding specific spectral absorption coefficients (Ka+b and Kw). The parameters n, Ka+b, and Kw have been fitted using experimental data corresponding to a wide range of plant types and status. PROSPECT has been tested successfully on independent data sets. Its inversion allows one to reconstruct, with reasonable accuracy, leaf reflectance, and transmittance features in the 400–2500 nm range by adjusting the three input variables N, Ca+b, and Cw.
|
| [37] |
Estimating leaf biochemistry using the PROSPECT leaf optical properties model [J].https://doi.org/10.1016/0034-4257(95)00238-3 URL 摘要
The biophysical, biochemical, and optical properties of 63 fresh leaves and 58 dry leaves were measured to investigate the potential of remote sensing to estimate the leaf biochemistry from space. Almost 2000 hemispherical reflectance and transmittance spectra were acquired from 400 nm to 2500 nm using a laboratory spectrophotometer. The amount of chlorophyll, water, protein, cellulose, hemicellulose, lignin, and starch was determined on these leaves using standard wet chemistry techniques. These experimental data were used to improve the PROSPECT model, a simple but effective radiative transfer model that calculates the leaf optical properties with a limited number of input parameters: a structure parameter and the leaf biochemistry. The new model construction mainly consisted in providing specific absorption coefficients for the biochemical constituents; the comparison with absorption spectra of pure materials derived from the literature showed good agreement. In the inversion, however, it was necessary to group some leaf components in order to estimate leaf biochemistry with reasonable accuracy. Predictive power varied with the chemistry variable, wavelengths used in analysis, and whether leaves were fresh or dry. r 2 ranged from 0.39 to 0.88 for predictions on dry leaves; on fresh leaves, water and chlorophyll had high r 2 values, 0.95 and 0.68 respectively, carbon based compounds reasonable r 2 , from 0.50 to 0.88, while the estimation of protein is still at issue.
|
| [38] |
Estimating canopy chlorophyll concentration from field and airborne spectra [J].https://doi.org/10.1016/S0034-4257(98)00113-8 URL [本文引用: 3] 摘要
This article investigates the effects of both soil contamination and nitrogen application on the red edge鈥揷hlorophyll concentration relationship for a vegetation canopy. Field based canopy reflectance and chlorophyll concentration data were collected at a grassland field site affected by soil contamination and a winter wheat field site affected by different levels of nitrogen fertilisation. The correlation between red edge position (REP) and canopy chlorophyll concentration was =0.84 and 0.80 for the grassland and winter wheat field sites, respectively. Airborne imaging spectrometry was used to generate REP images (units, nm) of the grassland and winter wheat field sites. Strong correlations were observed between REP and canopy chlorophyll concentration at both field sites. Predictive regression equations were developed to map canopy chlorophyll concentration across the field sites. The rms error of estimated chlorophyll concentration was 0.42 mg g(卤12.69% of mean) and 2.09 mg g(卤16.4% of mean) at the grassland and winter wheat field sites respectively. Results demonstrated the use of remotely sensed estimates of the REP from both field and airborne spectrometers for estimating chlorophyll concentration and indicated the potential of this technique for inferring both land contamination and grain yield.
|
| [39] |
The use of high spectral resolution bands for estimating absorbed photosynthetically active radiation (APAR) [
|
| [40] |
Inversion methods for physically-based models [J].https://doi.org/10.1080/02757250009532396 URL [本文引用: 1] 摘要
ABSTRACT Physically‐based models of vegetation reflectance serve as a basis for extracting vegetation variables using directional and spectral data from modern‐borne sensors (e.g., MODIS, MISR, POLDER, SeaWiFS). Although many models have been inverted, only recently have significant efforts been made to provide operational algorithms. These efforts have exposed a need to significantly improve efficient and accurate methods for inverting these physically‐based models. The characteristics of the traditional inversion, table look‐up, neural network and other methods are discussed as well as the major achievements, advantages/disadvantages, and research issues for each method.The traditional inversion methods using repeated model runs are computationally intensive and are not appropriate for operational application on a per pixel basis for regional and global data. Thus, for larger data sets, simplified (reduced number of variables and/or physical processes) physically‐based models are generally used. The table look‐up and neural network methods are computationally efficient and can be applied on a per pixel basis. Moreover, they can be applied to the most sophisticated models without any simplifications. Finally, they do not require initial guesses to model variables as do the traditional inversion methods. However, traditional inversion and table look‐up methods are inherently designed to handle any arbitrary set of Sun‐view angles. Neural networks have not been generalized, as of yet, to handle arbitrary angles. We believe the most pressing research priority is to perform a rigorous comparison of the various inversion methods in terms of accuracy and stability, computational efficiency, general applicability, and number of variables obtainable.
|
| [41] |
Characterizing canopy biochemistry from imaging spectroscopy and its application to ecosystem studies [J].https://doi.org/10.1016/j.rse.2008.10.018 URL [本文引用: 1] 摘要
For two decades, remotely sensed data from imaging spectrometers have been used to estimate non-pigment biochemical constituents of vegetation, including water, nitrogen, cellulose, and lignin. This interest has been motivated by the important role that these substances play in physiological processes such as photosynthesis, their relationships with ecosystem processes such as litter decomposition and nutrient cycling, and their use in identifying key plant species and functional groups. This paper reviews three areas of research to improve the application of imaging spectrometers to quantify non-pigment biochemical constituents of plants. First, we examine recent empirical and modeling studies that have advanced our understanding of leaf and canopy reflectance spectra in relation to plant biochemistry. Next, we present recent examples of how spectroscopic remote sensing methods are applied to characterize vegetation canopies, communities and ecosystems. Third, we highlight the latest developments in using imaging spectrometer data to quantify net primary production (NPP) over large geographic areas. Finally, we discuss the major challenges in quantifying non-pigment biochemical constituents of plant canopies from remotely sensed spectra.
|
| [42] |
Estimating leaf nitrogen concentration in ryegrass (Lolium spp.) pasture using the chlorophyll red-edge: Theoretical modelling and experimental observations [J].https://doi.org/10.1080/01431160110114529 URL 摘要
Chlorophyll red-edge descriptors have been used to estimate leaf nitrogen concentration in ryegrass ( Lolium spp.) pasture. Two-layer model calculations have been used to predict the influence of chlorophyll content and Leaf Area Index (LAI) on the shape and location of the peaks observed in the derivative spectra of a ryegrass canopy. The complex structure of the resulting derivative spectra precluded extracting red-edge wavelengths by fitting inverted Gaussian curves to reflectance profiles. Fitting a combination of three sigmoid curves to the calculated reflectance spectra provided a better representation of subsequent derivative spectra. The derivative spectra in the vicinity of the chlorophyll red-edge is predicted to contain two peaks (~705 and ~725 nm), which on increasing the canopy LAI is generally found to shift to longer wavelengths. However, for a canopy containing leaves of low chlorophyll content and LAI>5, the wavelength of the first peak becomes insensitive to changes in LAI. The same phenomenon is predicted for high-chlorophyll leaves of LAI>10. The role of multiple scattering, primarily due to increased leaf transmittance at higher wavelengths, has also been verified. In subsequent experiments, the predicted shape of the derivative spectra was observed and the use of three sigmoid curves to better represent this shape verified. Changes in the descriptors used to describe the chlorophyll red-edge were observed to explain 60% and 65% of the variance of leaf nitrogen concentration and total leaf nitrogen content, respectively. The resulting regression equation was found to predict leaf nitrogen concentration, in the range of 2-5.5%, with a standard error of prediction (SEP) of 0.4%. The confounding influence of canopy biomass on the red-edge determination of leaf nitrogen concentration was found to be significantly less at higher canopy biomass, confirming both theoretical predictions and the potential of using the chlorophyll red-edge as a biomass-independent means of estimating leaf chlorophyll, and hence nitrogen, concentration in high-LAI ryegrass pastures.
|
| [43] |
Towards universal broad leaf chlorophyll indices using PROSPECT simulated database and hyperspectral reflectance measurements [J].https://doi.org/10.1016/j.rse.2003.09.004 URL 摘要
chosen indices. These conclusions will certainly be different for a canopy-level study, where the derivative-based indices may perform
|
| [44] |
Quantitative remote sensing of land surfaces [M]. |
| [45] |
The stress concept in plants: An introduction [J].https://doi.org/10.1111/j.1749-6632.1998.tb08993.x URL PMID: 9668620 [本文引用: 2] 摘要
First page of article
|
| [46] |
Retrieval of leaf biochemical properties by inversed PROSPECT model and hyperspectral indices: An application to Populus euphratica polymorphic leaves [J].https://doi.org/10.3724/SP.J.1227.2012.00052 Magsci 摘要
Leaf biochemical properties have been widely assessed using hyperspectral reflectance information by inversion of PROSPECT model or by using hyperspectral indices, but few studies have focused on arid ecosystems. As a dominant species of riparian ecosystems in arid lands, Populus euphratica Oliv. is an unusual tree species with polymorphic leaves along the vertical profile of canopy corresponding to different growth stages. In this study, we evaluated both the inversed PROSPECT model and hyperspectral indices for estimating biochemical properties of P. euphratica leaves. Both the shapes and biochemical properties of P. euphratica leaves were found to change with the heights from ground surface. The results indicated that the model inversion calibrated for each leaf shape performed much better than the model calibrated for all leaf shapes, and also better than hyperspectral indices. Similar results were obtained for estimations of equivalent water thickness (EWT) and leaf mass per area (LMA). Hyperspectral indices identified in this study for estimating these leaf properties had root mean square error (RMSE) and R2 values between those obtained with the two calibration strategies using the inversed PROSPECT model. Hence, the inversed PROSPECT model can be applied to estimate leaf biochemical properties in arid ecosystems, but the calibration to the model requires special attention.
|
| [47] |
Validation of a leaf reflectance and transmittance model for three agricultural crop species [ |
| [48] |
Carbon storage in grasslands of China [J].https://doi.org/10.1006/jare.2001.0902 Magsci 摘要
<h2 class="secHeading" id="section_abstract">Abstract</h2><p id="">Carbon storage in grasslands of China was estimated by the carbon density method and based on a nationwide grassland resource survey finished by 1991. The grasslands in China were classified into 18 types, which are distributed mostly in the temperate region and on the Tibetan Plateau, and scattered in the warm-temperate and tropical regions. Based on the median estimate, vegetation, soil and total carbon storage of grasslands in China were 3·06, 41·03 and 44·09 Pg C, respectively. Vegetation had low carbon storage and most carbon was stored in soils. Of the four types of regions that have grasslands, alpine region (54·5%) and temperate region (31·6%) hold more than 85% of the total grassland carbon (in both vegetation and soils) in China. Considering specific types within these two regions, three grassland types, alpine meadow (25·6%), alpine steppe (14·5%) and temperate steppe (11%) constituted more than half of all carbon stored in China's grasslands. In general and regardless of regional vegetation types, steppes (38·6%) and meadows (38·2%) made up more than 2/3 of total grassland carbon. The carbon storage in alpine grasslands may have a significant and long-lived effect on global C cycles. This study estimated more carbon storage in vegetation and less in soils than previous studies. The differences of grassland carbon between this study and two previous studies were due probably to four reasons, i.e. different estimation methods, different classification systems of grasslands, different areas of grasslands, and different carbon densities. China's grasslands cover only 6–8% of total world grassland area and have 9–16% of total carbon in the world grasslands. They make a big contribution to the world carbon storage and may have significant effects on carbon cycles, both in global and in arid lands.</p>
|
| [49] |
A model separating leaf structural and physiological effects on carbon gain along light gradients for the shade-tolerant species Acer saccharum [J].https://doi.org/10.1046/j.1365-3040.1997.d01-133.x URL [本文引用: 1] 摘要
ABSTRACT A process-based leaf gas exchange model for C 3 plants was developed which specifically describes the effects observed along light gradients of shifting nitrogen investment in carboxylation and bioenergetics and modified leaf thickness due to altered stacking of photosynthetic units. The model was parametrized for the late-successional, shade-tolerant deciduous species Acer saccharum Marsh. The specific activity of ribulose-1,5-bisphosphate carboxylase (Rubisco) and the maximum photosynthetic electron transport rate per unit cytochrome f (cyt f) were used as indices that vary proportionally with nitrogen investment in the capacities for carboxylation and electron transport. Rubisco and cyt f per unit leaf area are related in the model to leaf dry mass per area ( M A ), leaf nitrogen content per unit leaf dry mass ( N m ), and partitioning coefficients for leaf nitrogen in Rubisco ( P R ) and in bioenergetics ( P B ). These partitioning coefficients are estimated from characteristic response curves of photosynthesis along with information on lear structure and composition. While P R and P B determine the light-saturated value of photosynthesis, the fraction of leaf nitrogen in thylakoid light-harvesting components ( P L ) and the ratio of leaf chlorophyll to leaf nitrogen invested in light harvesting ( C B ), which is dependent on thylakoid stoichiometry, determine the initial photosynthetic light utilization efficiency in the model. Carbon loss due to mitochondrial respiration, which also changes along light gradients, was considered to vary in proportion with carboxylation capacity. Key model parameters - N m , P R , P B , P L C B and stomatal sensitivity with respect to changes in net photosynthesis ( G r )鈥 were examined as a function of M A , which is linearly related to irradiance during growth of the leaves. The results of the analysis applied to A. saccharum indicate that P B and P R increase, and G f , P L and C B decrease with increasing M A . As a result of these effects of irradiaiice on nitrogen partitioning, the slope of the light-saturated net photosynthesis rate per unit leaf dry mass ( A m max ) versus N m relationship increased with increasing growth irradiance in mid-season. Furthermore, the nitrogen partitioning coefficients as well as the slopes of A m max versus N m were independent of season, except during development of the leaf photosynthetic apparatus. Simulations revealed that the acclimation to high light increa
|
| [50] |
Visible and near-infrared reflectance techniques for diagnosing plant physiological status [J].https://doi.org/10.1016/S1360-1385(98)01213-8 URL [本文引用: 1] 摘要
In addition to their well-established function as collectors of light energy for photosynthesis and as quenchers of triplet chlorophyll and singlet oxygen, carotenoids of higher plant chloroplasts might also play an important structural role. Recent studies have revealed that carotenoids of the xanthophyll family and some other terpenoids, such as isoprene or alpha-tocopherol, stabilize and photoprotect the lipid phase of the thylakoid membranes. Current evidence suggests that, when plants are exposed to potentially harmful environmental conditions such as strong light and/or elevated temperatures, the xanthophyll violaxanthin and the products of its enzymic de-epoxidation, antheraxanthin and zeaxanthin, partition between the light-harvesting complexes and the lipid phase of the thylakoid membranes. The resulting interaction of the xanthophyll molecules and the membrane lipids brings about a decrease in membrane fluidity, an increase in membrane thermostability and a lowered susceptibility to lipid peroxidation.
|
| [51] |
Technical note grass chlorophyll and the reflectance red edge [J].https://doi.org/10.1080/01431169608949010 URL [本文引用: 1] 摘要
ABSTRACT The point of maximum slope in the reflectance spectra of leaves occurs around 690-740 nm and is termed the ‘red edge’. Strong correlations have been found between the red edge of leaves and the chlorophyll concentration of those leaves. Imaging spectrometers can record the red edge of canopies and strong correlations have been observed between canopy red edge and the chlorophyll concentration of leaves in those canopies; providing the canopies were optically thick and/or had spatially invariant biomass.This study investigated relations between (i) canopy red edge and the chlorophyll concentration of leaves, and (ii) canopy red edge and the chlorophyll content of the canopy for a grass canopy with a spatially variable biomass. The canopy red edge as recorded by an airborne imaging spectrometer was correlated more strongly with the chlorophyll content of the canopy (r = 0·93) than the chlorophyll concentration of the leaves (r = 0·86).These results suggested that in the absence of other information the most appropriate measure of chlorophyll to relate to the red edge of a grass canopy is content rather than concentration.
|
| [52] |
Extraction of red edge optical parameters from Hyperion data for estimation of forest leaf area index [J].https://doi.org/10.1109/TGRS.2003.813555 URL 摘要
A correlation analysis was conducted between forest leaf area index (LAI) and two red edge parameters: red edge position (REP) and red well position (RWP), extracted from reflectance image retrieved from Hyperion data. Field spectrometer data and LAI measurements were collected within two days after the Earth Observing One satellite passed over the study site in the Patagonia region of Argentina. The two red edge parameters were extracted with four approaches: four-point interpolation, polynomial fitting, Lagrangian technique, and inverted-Gaussian (IG) modeling. Experimental results indicate that the four-point approach is the most practical and suitable method for extracting the two red edge parameters from Hyperion data because only four bands and a simple interpolation computation are needed. The polynomial fitting approach is a direct method and has its practical value if hyperspectral data are available. However, it requires more computation time. The Lagrangian method is applicable only if the first derivative spectra are available; thus, it is not suitable to multispectral remote sensing. The IG approach needs further testing and refinement for Hyperion data.
|
| [53] |
An evaluation of noninvasive methods to estimate foliar chlorophyll content [J].https://doi.org/10.1046/j.0028-646X.2001.00289.x URL [本文引用: 1] 摘要
Summary Top of page Summary Introduction Methods Results Discussion Conclusion Acknowledgements References 61 68Over the last decade, technological developments have made it possible to quickly and nondestructively assess, in situ , the chlorophyll (Chl) status of plants. We evaluated the performance of these optical methods, which are based on the absorbance or reflectance of certain wavelengths of light by intact leaves. 61 68As our benchmark, we used standard extraction techniques to measure Chl a , Chl b , and total Chl content of paper birch ( Betula papyrifera ) leaves. These values were compared with the nominal Chl index values obtained with two hand-held Chl absorbance meters and several reflectance indices correlated with foliar Chl. 61 68The noninvasive optical methods all provided reliable estimates of relative leaf Chl. However, across the range of Chl contents studied (0.0004–0.0455mgcm 612 ), some reflectance indices consistently out-performed the hand-held meters. Most importantly, the reflectance indices that performed best were not those most commonly used in the literature. 61 68We report equations to convert from index values to actual Chl content, but caution that differences in leaf structure may necessitate species-specific calibration equations.
|
| [54] |
Comparison of in situ and airborne spectral measurements of the blue shift associated with forest decline [J].https://doi.org/10.1016/0034-4257(88)90008-9 URL [本文引用: 1] 摘要
During August 1985, extensive field activities were conducted at spruce/fir ( Picea and Abies ) sites in Vermont and Baden-W眉rttemberg (FRG) currently undergoing rapid forest decline suspected of being due to various forms of air pollution. High-spectral resolution in situ reflectance curves and photosynthetic pigment determinations were acquired for common branch samples from specimens of spruce typical of both high- and low-damage sites. Similar spectral responses (reflectance data) were exhibited for specimens collected from high-damage sites in both the United States and FRG. Both current year and older foliage from high-damage sites in both countries showed an approximately 5 nm shift away from the normal inflection point of the red edge reflectance feature toward shorter wavelengths (a blue shift). This blue shift was associated with an observed reduction in chlorophyll b and a relative decrease in chlorophylls for needles collected from the high-damage sites, as compared with those from low-damage sites. An airborne high-resolution imaging spectrometer (the Fluorescence Line Imager or FLI) was flown over the Vermont study sites in August 1985 and has detected a blue shift of the chlorophyll absorption maximum at the high-damage site. Red edge parameters (wavelength position of the chlorophyll absorption maximum, red radiance, and NIR radiance) detected by the FLI have been used to image and map areas of damage in a highly accurate manner. Since data presented here suggest that the blue shift is a previsual symptom of damage, the ability to remotely detect such subtle spectral symptoms may serve as an early indicator of certain types of forest damage, and thus could be of considerable value in monitoring forest condition and state of health.
|
| [55] |
Optimization of soil-adjusted vegetation indices [J].https://doi.org/10.1021/ac401871t URL 摘要
The sensitivity of the normalized difference vegetation index (NDVI) to soil background and atmospheric effects has generated an increasing interest in the development of new indices, such as the soil-adjusted vegetation index (SAVI), transformed soil-adjusted vegetation index (TSAVI), atmospherically resistant vegetation index (AR VI), global environment monitoring index (GEMI), modified soil-adjusted vegetation index (MSAVI), which are less sensitive to these external influences. These indices are theoretically more reliable than NDVI, although they are not yet widely used with satellite data. This article focuses on testing and comparing the sensitivity of NDVI, SAVI, TSAVI, MSAVI and GEMI to soil background effects. Indices are simulated with the SAIL model for a large range of soil reflectances, including sand, clay, and dark peat, with additional variations induced by moisture and roughness. The general formulation of the SAVI family of indices with the form VI = (NIR - R) / (NIR + R + X) is also reexamined. The value of the parameter X is critical in the minimization of soil effects. A value of X = 0.16 is found as the optimized value. Index performances are compared by means of an analysis of variance.
|
| [56] |
Mapping spatio-temporal variation of grassland quantity and quality using MERIS data and the PROSAIL model [J].https://doi.org/10.1016/j.rse.2012.02.011 URL [本文引用: 3] 摘要
Accurate estimates of the quantity and quality of grasslands, as they vary in space and time and from regional to global scales, furthers our understanding of grassland ecosystems. The Medium Resolution Imaging Spectrometer (MERIS) is a promising sensor for measuring and monitoring grasslands due to its high spectral resolution, medium spatial resolution and a two- to three-day repeat cycle. However, thus far the multi-biome MERIS land products have limited consistency with in-situ measurements of leaf area index (LAI), while the multi-biome canopy chlorophyll content (CCC) has not been validated yet with in-situ data. This study proposes a single-biome approach to estimate grassland LAI (a surrogate of grass quantity) and leaf chlorophyll content (LCC) and CCC (surrogates of grass quality) using the inversion of the PROSAIL model and MERIS reflectance. Both multi-biome and single-biome approaches were validated using two-season in-situ data sets and the temporal consistency was analyzed using time-series of MERIS data. The single-biome approach showed a consistently better performance for estimating LAI ( R 2 02=020.70, root mean square error (RMSE)02=021.02, normalized RMSE (NRMSE)02=0216%) and CCC ( R 2 02=020.61, RMSE02=020.36, NRMSE02=0223%) compared with the multi-biome approach (LAI: R 2 02=020.36, RMSE02=021.77, NRMSE02=0228%; CCC: R 2 02=020.47, RMSE02=021.33, NRMSE02=0284%). However, both single-biome and multi-biome approaches failed to retrieve LCC. The multi-biome LAI was overestimated at lower LAI values (<022) and saturated at higher LAI values (≥024), and the multi-biome CCC was consistently overestimated through the whole data range. Similar temporal trajectories of grassland LAI and CCC estimates were observed using these two approaches, but the multi-biome trajectory consistently produced larger values than the single-biome trajectory. The spatio-temporal variation of grassland LAI and CCC estimated by the single-biome approach was shown to be closely associated with agricultural practices. Our results underline the potential of mapping grassland LAI and CCC using the PROSAIL model and MERIS satellite data.
|
| [57] |
Relationships between leaf pigment content and spectral reflectance across a wide range of species, leaf structures and developmental stages [J].https://doi.org/10.1016/S0034-4257(02)00010-X URL [本文引用: 1] 摘要
Leaf pigment content can provide valuable insight into the physiological performance of leaves. Measurement of spectral reflectance provides a fast, nondestructive method for pigment estimation. A large number of spectral indices have been developed for estimation of leaf pigment content. However, in most cases these indices have been tested for only one or at most a few related species and thus it is not clear whether they can be applied across species with varying leaf structural characteristics. Our objective in this study was to develop spectral indices for prediction of leaf pigment content that are relatively insensitive to species and leaf structure variation and thus could be applied in larger scale remote-sensing studies without extensive calibration. We also quantified the degree of spectral interference between pigments when multiple pigments occur within the same leaf tissue. We found that previously published spectral indices provided relatively poor correlations with leaf chlorophyll content when applied across a wide range of species and plant functional types. Leaf surface reflectance appeared to be the most important factor in this variation. By developing a new spectral index that reduces the effect of differences in leaf surface reflectance, we were able to significantly improve the correlations with chlorophyll content. We also found that an index based on the first derivative of reflectance in the red edge region was insensitive to leaf structural variation. The presence of other pigments did not significantly affect estimation of chlorophyll from spectral reflectance. Previously published carotenoid and anthocyanin indices performed poorly across the whole data set. However, we found that the photochemical reflectance index (PRI, originally developed for estimation of xanthophyll cycle pigment changes) was related to carotenoid/chlorophyll ratios in green leaves. This result has important implications for the interpretation of PRI measured at both large and small scales. Our results demonstrate that spectral indices can be applied across species with widely varying leaf structure without the necessity for extensive calibration for each species. This opens up new possibilities for assessment of vegetation health in heterogeneous natural environments.
|
| [58] |
Parallel adjustments in vegetation greenness and ecosystem CO2 exchange in response to drought in a Southern California chaparral ecosystem [J].https://doi.org/10.1016/j.rse.2005.01.020 URL [本文引用: 1] 摘要
Some form of the light use efficiency (LUE) model is used in most models of ecosystem carbon exchange based on remote sensing. The strong relationship between the normalized difference vegetation index (NDVI) and light absorbed by green vegetation make models based on LUE attractive in the remote sensing context. However, estimation of LUE has proven problematic since it varies with vegetation type and environmental conditions. Here we propose that LUE may in fact be correlated with vegetation greenness (measured either as NDVI at constant solar elevation angle, or a red edge chlorophyll index), making separate estimates of LUE unnecessary, at least for some vegetation types. To test this, we installed an automated tram system for measurement of spectral reflectance in the footprint of an eddy covariance flux system in the Southern California chaparral. This allowed us to match the spatial and temporal scales of the reflectance and flux measurements and thus to make direct comparisons over time scales ranging from minutes to years. The 3-year period of this study included both “normal” precipitation years and an extreme drought in 2002. In this sparse chaparral vegetation, diurnal and seasonal changes in solar angle resulted in large variation in NDVI independent of the actual quantity of green vegetation. In fact, one would come to entirely different conclusions about seasonal changes in vegetation greenness depending on whether NDVI at noon or NDVI at constant solar elevation angle were used. Although chaparral vegetation is generally considered “evergreen”, we found that the majority of the shrubs were actually semi-deciduous, leading to large seasonal changes in NDVI at constant solar elevation angle. LUE was correlated with both greenness indices at the seasonal timescale across all years. In contrast, the relationship between LUE and PRI was inconsistent. PRI was well correlated with LUE during the “normal” years but this relationship changed dramatically during the extreme drought. Contrary to expectations, none of the spectral reflectance indices showed consistent relationships with COflux or LUE over the diurnal time-course, possibly because of confounding effects of sun angle and stand structure on reflectance. These results suggest that greenness indices can be used to directly estimate COexchange at weekly timescales in this chaparral ecosystem, even in the face of changes in LUE. Greenness indices are unlikely to be as good predictors of COexchange in dense evergreen vegetation as they were in the sparse, semi-deciduous chaparral. However, since relatively few ecosystems are entirely evergreen at large spatial scales or over long time spans due to disturbance, these relationships need to be examined across a wider range of vegetation types.
|
| [59] |
Use of hyperspectral derivative ratios in the red-edge region to identify plant stress responses to gas leaks [J].https://doi.org/10.1016/j.rse.2004.06.002 URL [本文引用: 1] 摘要
Spectral responses included increased reflectance in the visible wavelengths and decreased reflectance in the near infra-red. Derivative analysis identified features within the red-edge at 720鈥730 and 702 nm. Ratios of the magnitude of the derivative at 725 to that at 702 nm were less in areas where gas was present. This ratio enabled identification of stress due to gas leakage up to 7 days before visible symptoms were observed and also at the edges of gassed plots where visible symptoms were not expressed. The technique was able to identify stress responses to long-term leaks in all the crops tested but to short-term leaks only in grass. This study therefore suggests that under appropriate conditions remote sensing could be used to detect pipeline gas leaks from decreases in the ratio of peaks within the red-edge.
|
| [60] |
Leaf reflectance vs. leaf chlorophyll and carotenoid concentrations for eight crops [J].https://doi.org/10.2134/agronj1977.00021962006900050017x URL [本文引用: 1] 摘要
Leaf reflectance in the 0.40- to 0.75-µm wavelength interval is influenced primarily by the pigments chlorophyll and carotenoid. However, the literature contains very few references to the relation between reflectance from leaves and their carotenoid content. Our objectives in this study were to determine which of three wavelengths in the visible spectral region best related leaf reflectance to total chlorophyll and carotenoid concentrations, and the relative effect of these pigments on reflectance.
|
| [61] |
Red and photographic infrared linear combinations for monitoring vegetation [J].https://doi.org/10.1016/0034-4257(79)90013-0 URL 摘要
The vegetation index, transformed vegetation index, and square root of the IR/red ratio were the most significant, followed closely by the IR/red ratio. Less than a 6% difference separated the highest and lowest of these four ER and red linear combinations. The use of these linear combinations was shown to be sensitive primarily to the green leaf area or green leaf biomass. As such, these linear combinations of the red and photographic IR radiances can be employed to monitor the photosynthetically active biomass of plant canopies.
|
| [62] |
Remote sensing of environment: State of the science and new directions [M] |
| [63] |
Light scattering by leaf layers with application to canopy reflectance modeling: The SAIL model [J].https://doi.org/10.1016/0034-4257(84)90057-9 URL [本文引用: 1] 摘要
The scattering and extinction coefficients of the SAIL canopy reflectance model are derived for the case of a fixed arbitrary leaf inclination angle and a random leaf azimuth distribution. The SAIL model includes the uniform model of G. H. Suits as a special case and its main characteristics are that canopy variables such as leaf area index and the leaf inclination distribution function are used as input parameters and that it provides more realistic angular profiles of the directional reflectance as a function of the view angle or the solar zenith angle.
|
| [64] |
Estimating structural and biochemical parameters for grassland from spectroradiometer data by radiative transfer modelling (PROSPECT+SAIL) [J].https://doi.org/10.1080/01431160701268947 URL [本文引用: 2] 摘要
As permanent grassland is a large‐scale land‐use type in Central Europe, grassland inventories are relevant for ecological and agrarian issues. The objective of this study was to assess structural and biochemical grassland parameters (LAI, chlorophyll, water and dry matter contents) from field spectroradiometer data (ASD FieldSpec II) by radiative transfer modelling (PROSPECT+SAIL). Constraints were necessary to compensate the ill‐posed nature of model inversion for accurate parameter retrieval. In this context, we found the foliage moisture content to play an important role. After coupling the equivalent water thickness and the dry matter content in a ratio of 4:1, the estimation accuracy for the LAI clearly improved. In terms of LAI, the RMSE decreased from 0.86 to 0.74, and the range of LAI values measured in the field (min02=020.10, max02=025.88) was reproduced exactly with estimates ranging from 0.05 to 5.46. The spectra reconstructed by PROSPECT+SAIL using the inverted parameter estimates coincided well with the measured spectra. Nonetheless, obtained canopy chlorophyll contents tended to be too high. When using ground measured chlorophyll data for spectra generation, simulated reflectances were clearly higher in the visible domain than the measured ones. This is partly attributed to the chlorophyll absorption coefficients of PROSPECT that may not be true for the majority of grassland plant species in reality. Neverthelesss, the obtained results prove the potential of PROSPECT+SAIL for retrieving structural and biochemical grassland parameters; results may be appropriate for assimilation in the modelling of plant growth or carbon cycle, for example.
|
| [65] |
Methodologies and uncertainties in the use of the terrestrial chlorophyll index for the Sentinel-3 mission [J].https://doi.org/10.3390/rs4051112 URL [本文引用: 1] 摘要
A methodology is described for the validation of Medium Resolution Imaging Spectrometer (MERIS) Terrestrial Chlorophyll Index (MTCI) data over heterogeneous land surfaces in an agricultural region in Southern Italy. The approach involves the use inverse canopy reflectance modeling techniques to derive maps of canopy chlorophyll content (CCC) and leaf area index (LAI) at fine spatial resolution. Indirect field measurements are used for validation of the fine spatial resolution data. Subsequently, these maps are aggregated based on a regular grid at 1 km spatial resolution to validate MERIS Level 2 MTCI (300?m). RapidEye satellite sensor data with a pixel size of 6.5 m are used for this purpose. Based on a set of independent ground measurements, fine spatial resolution maps achieved an R2 = 0.78 and RMSE = 0.39 for CCC and R2 = 0.76 and RMSE = 0.64 for LAI. The relationship between MERIS L2 MTCI and CCC [g?m?2] achieved a coefficient of determination of 0.74 and it resulted to be extremely statistically significant (p-value < 0.001). Additionally, a relative validation of two other satellite products at medium resolution spatial scale, namely MERIS leaf area index (LAI) and Moderate Resolution Imaging Spectrometer (MODIS) LAI was performed by comparison with the fine spatial resolution LAI map. Results indicated a better accuracy in LAI estimation of MERIS (RMSE = 0.33) compared to MODIS (RMSE = 0.81) data.
|
| [66] |
Estimating grassland chlorophyll content using remote sensing data at leaf, canopy, and landscape scales [J]. |
| [67] |
The worldwide leaf economics spectrum [J].https://doi.org/10.1038/nature02403 URL PMID: 15103368 [本文引用: 1] 摘要
Bringing together leaf trait data spanning 2,548 species and 175 sites we describe, for the first time at global scale, a universal spectrum of leaf economics consisting of key chemical, structural and physiological properties. The spectrum runs from quick to slow return on investments of nutrients and dry mass in leaves, and operates largely independently of growth form, plant functional type or biome. Categories along the spectrum would, in general, describe leaf economic variation at the global scale better than plant functional types, because functional types overlap substantially in their leaf traits. Overall, modulation of leaf traits and trait relationships by climate is surprisingly modest, although some striking and significant patterns can be seen. Reliable quantification of the leaf economics spectrum and its interaction with climate will prove valuable for modelling nutrient fluxes and vegetation boundaries under changing land-use and climate.
|
| [68] |
Estimating chlorophyll content from hyperspectral vegetation indices: Modeling and validation [J].https://doi.org/10.1016/j.agrformet.2008.03.005 URL [本文引用: 1] 摘要
Leaf chlorophyll content, a good indicator of photosynthesis activity, mutations, stress and nutritional state, is of special significance to precision agriculture. Recent studies have demonstrated the feasibility of retrieval of chlorophyll content from hyperspectral vegetation indices composed by the reflectance of specific bands. In this paper, a set of vegetation indices belonged to three classes (normalized difference vegetation index (NDVI), modified simple ratio (MSR) index and the modified chlorophyll absorption ratio index (MCARI, TCARI) and the integrated forms (MCARI/OSAVI and TCARI/OSAVI)) were tested using the PROSPECT and SAIL models to explore their potentials in chlorophyll content estimation. Different bands combinations were also used to derive the modified vegetation indices. In the sensitivity study, four new formed indices (MSR[705,750], MCARI[705,750], TCARI/OSAVI[705,750] and MCARI/OSAVI[705,750]) were proved to have better linearity with chlorophyll content and resistant to leaf area index (LAI) variations by taking into account the effect of quick saturation at 670聽nm with relatively low chlorophyll content. Validation study was also conducted at canopy scale using the ground truth data in the growth duration of winter wheat (chlorophyll content and reflectance data). The results showed that the integrated indices TCARI/OSAVI[705,750] and MCARI/OSAVI[705,750] are most appropriate for chlorophyll estimation with high correlation coefficients R 2 of 0.8808 and 0.9406, respectively, because more disturbances such as shadow, soil reflectance and nonphotosynthetic materials are taken into account. The high correlation between the vegetation indices obtained in the developmental stages of wheat and Hyperion data ( R 2 of 0.6798 and 0.7618 for TCARI/OSAVI[705,750] and MCARI/OSAVI[705,750], respectively) indicated that these two integrated index can be used in practice to estimate the chlorophylls of different types of corns.
|
| [69] |
Predicting nitrogen and chlorophyll content and concentrations from reflectance spectra (400-2500 nm) at leaf and canopy scales [J].https://doi.org/10.1016/0034-4257(95)00135-N URL 摘要
An experiment was designed to determine whether chlorophyll and nitrogen concentrations could be predicted from reflectance () spectra of fresh bigleaf maple leaves in the laboratory, and, if so, whether the predictive spectral features could be correlated with chlorophyll and nitrogen concentration or content of simple canopies of maple seedlings. The best predictors for nitrogen and chlorophyll of fresh leaves appeared with first-difference transformations of log 1/, and the bands selected were similar to those found in other studies. Shortwave infrared bands were best predictors for nitrogen, visible bands best for chlorophyll. In the shortwave infrared region, however, the absolute differences in reflectance at critical bands was extremely small, and the bands of high correlation were narrow. High spectral and radiance resolution are required to resolve these differences accurately. The best shortwave infrared bands from the leaf scale were not good predictors of chemical content or concentration at the canopy scale; variability in canopy reflectance in the shortwave infrared region was at least an order of magnitude beyond that necessary to detect signals from chemicals. The variability in first-difference log 1/on the canopy scale was related to the arrangement of trees with respect to direct solar radiation, instrument noise, leaf fluttering, and small changes in atmospheric moisture.
|
| [70] |
Leaf chlorophyll content retrieval from airborne hyperspectral remote sensing imagery [J].https://doi.org/10.1016/j.rse.2008.04.005 URL [本文引用: 1] 摘要
ABSTRACT Hyperspectral remote sensing has great potential for accurate retrieval of forest biochemical parameters. In this paper, a hyperspectral remote sensing algorithm is developed to retrieve total leaf chlorophyll content for both open spruce and closed forests, and tested for open forest canopies. Ten black spruce (Picea mariana (Mill.)) stands near Sudbury, Ontario, Canada, were selected as study sites, where extensive field and laboratory measurements were carried out to collect forest structural parameters, needle and forest background optical properties, and needle biophysical parameters and biochemical contents chlorophyll a and b. Airborne hyperspectral remote sensing imagery was acquired, within one week of ground measurements, by the Compact Airborne Spectrographic Imager (CASI) in a hyperspectral mode, with 72 bands and half bandwidth 4.25–4.36 nm in the visible and near-infrared region and a 2 m spatial resolution. The geometrical–optical model 4-Scale and the modified leaf optical model PROSPECT were combined to estimate leaf chlorophyll content from the CASI imagery. Forest canopy reflectance was first estimated with the measured leaf reflectance and transmittance spectra, forest background reflectance, CASI acquisition parameters, and a set of stand parameters as inputs to 4-Scale. The estimated canopy reflectance agrees well with the CASI measured reflectance in the chlorophyll absorption sensitive regions, with discrepancies of 0.06%–1.07% and 0.36%–1.63%, respectively, in the average reflectances of the red and red-edge region. A look-up-table approach was developed to provide the probabilities of viewing the sunlit foliage and background, and to determine a spectral multiple scattering factor as functions of leaf area index, view zenith angle, and solar zenith angle. With the look-up tables, the 4-Scale model was inverted to estimate leaf reflectance spectra from hyperspectral remote sensing imagery. Good agreements were obtained between the inverted and measured leaf reflectance spectra across the visible and near-infrared region, with R2 = 0.89 to R2 = 0.97 and discrepancies of 0.02%–3.63% and 0.24%–7.88% in the average red and red-edge reflectances, respectively. Leaf chlorophyll content was estimated from the retrieved leaf reflectance spectra using the modified PROSPECT inversion model, with R2 = 0.47, RMSE = 4.34 渭g/cm2, and jackknifed RMSE of 5.69 渭g/cm2 for needle chlorophyll content ranging from 24.9 渭g/cm2 to 37.6 渭g/cm2. The estimates were also assessed at leaf and canopy scales using chlorophyll spectral indices TCARI/OSAVI and MTCI. An empirical relationship of simple ratio derived from the CASI imagery to the ground-measured leaf area index was developed (R2 = 0.88) to map leaf area index. Canopy chlorophyll content per unit ground surface area was then estimated, based on the spatial distributions of leaf chlorophyll content per unit leaf area and the leaf area index.
|

/
| 〈 |
|
〉 |
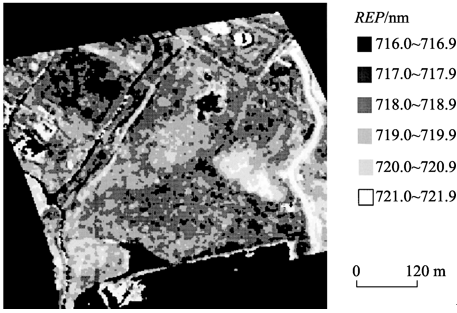
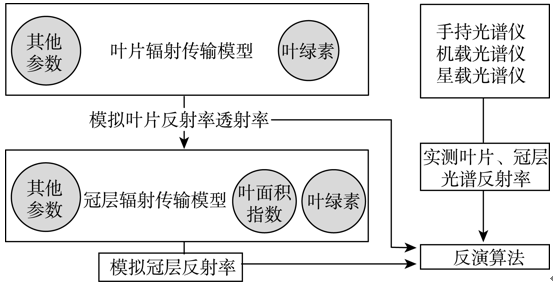