
中国资源型城市经济韧性的时空演化及障碍度分析
|
梁曼(1988— ),女,河南镇平人,博士,讲师,硕士生导师,主要研究方向为经济地理与区域发展。E-mail: lm2019@jxnu.edu.cn |
收稿日期: 2025-05-30
修回日期: 2025-11-02
网络出版日期: 2026-01-23
基金资助
国家自然科学基金项目(42201187)
国家社会科学基金项目(24BJL064)
河南省软科学研究项目(242400411056)
Spatiotemporal change and obstacle analysis of the economic resilience of resource-based cities in China
Received date: 2025-05-30
Revised date: 2025-11-02
Online published: 2026-01-23
Supported by
National Natural Science Foundation of China(42201187)
National Social Science Foundation of China(24BJL064)
Soft Science Research Program of Henan Province(242400411056)
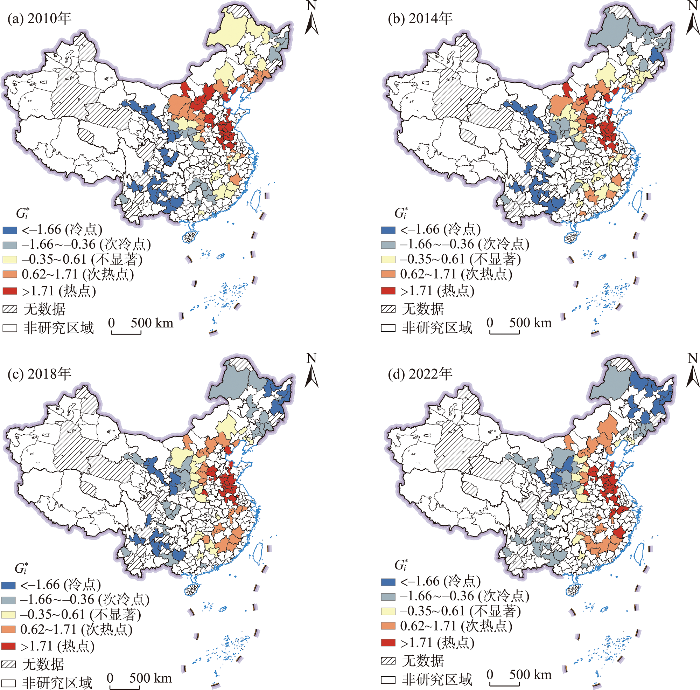
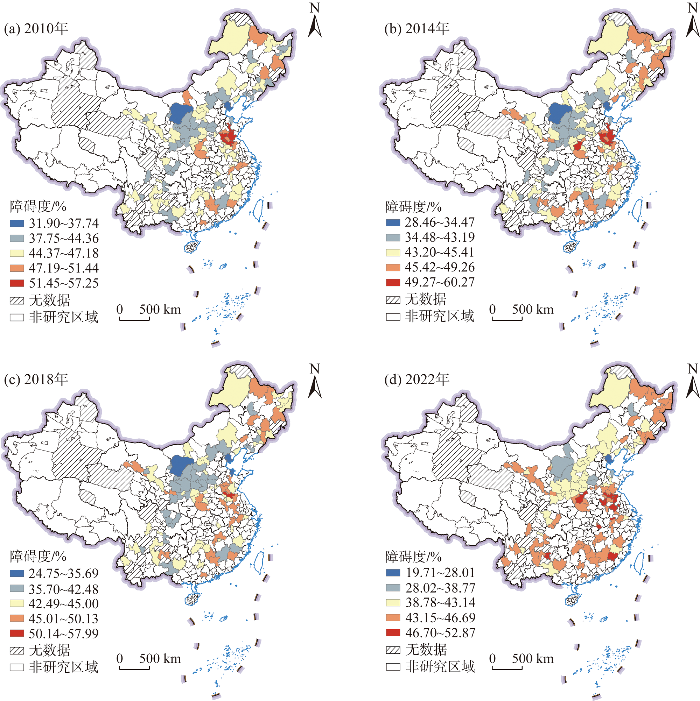
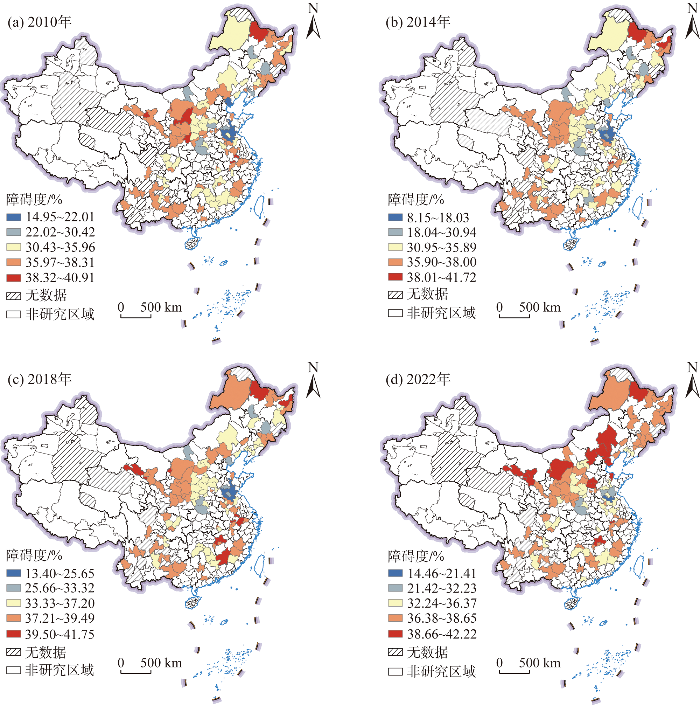
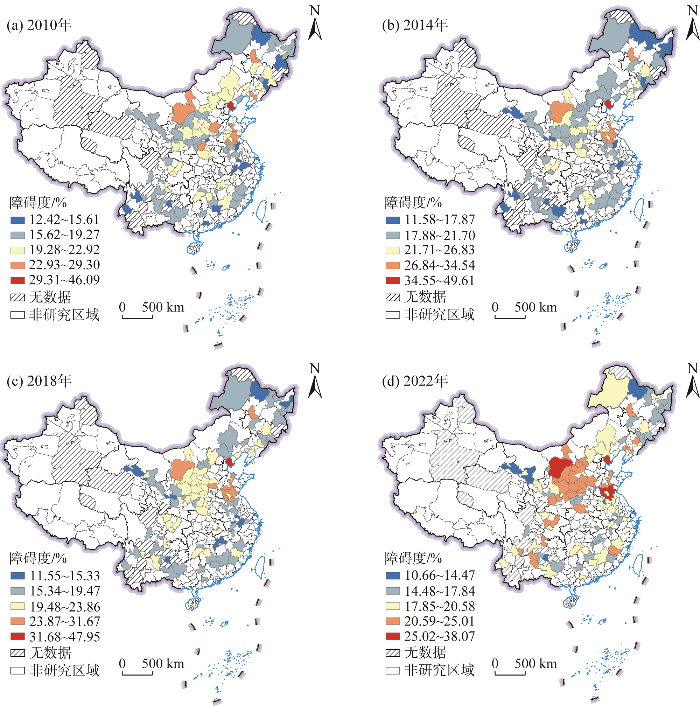
产业结构的单一性及自然资源的高度依赖性使得资源型城市在面对内外冲击与干扰时呈现异常的敏感与脆弱,科学测度资源型城市的经济韧性水平并识别障碍因素是提升其可持续发展能力的新思维、新途径。论文基于2010—2022年110个资源型城市相关数据,构建“抵抗与恢复能力—适应与调节能力—转型与发展能力”综合评价体系,运用熵值法、GIS空间分析、障碍度模型等方法定量分析中国资源型城市经济韧性的时序变化、空间格局及障碍因素,结果表明:① 资源型城市经济韧性水平实现了由0.0679至0.1249的稳步提升,呈现“再生型>成熟型>成长型>衰退型”的特征,但成长型城市的增速处于领先位置,存在“追赶效应”。② 资源型城市经济韧性水平具有显著空间分异特征,呈现“东部地区>中部地区>西部地区>东北地区”的趋势,东、中、西部地区不断上升而东北地区则出现升降反复的异常;热点区域分布于以徐州、济宁等为中心的黄淮海地区,冷点区域则由西南、西北地区向东北地区转移。③ 系统层方面,抵抗与恢复能力、适应与调节能力是资源型城市经济韧性提升的主要障碍因素;指标层方面,居民财富积累不足、需求拉动疲软、财政政策欠科学及产业结构刚性约束是制约经济韧性的重要因子。研究可为提升资源型城市经济韧性以及制定韧性发展政策提供科学参考。
梁曼 , 兰颜 , 李建新 , 文玉钊 , 冯兴华 . 中国资源型城市经济韧性的时空演化及障碍度分析[J]. 地理科学进展, 2026 , 45(1) : 77 -91 . DOI: 10.18306/dlkxjz.2026.01.006
Lack of diversity of industrial structure and the high dependence on natural resources make resource-based cities exceptionally sensitive and vulnerable to internal and external shocks and disturbances. Scientifically measuring the economic resilience level of resource-based cities and identifying obstacles is a new way to enhance their sustainable development capabilities. Based on the relevant data of 110 resource-based cities from 2010 to 2022, a comprehensive evaluation system of "resistance and resilience capacity-adaptation and regulation capacity-transformation and development capacity" was constructed. The entropy method, GIS spatial analysis, and obstacle degree model were used to quantitatively analyze the temporal changes, spatial patterns, and obstacle factors of China's resource-based cities' economic resilience. The results show that: 1) The economic resilience level of resource-based cities had improved from 0.0679 to 0.1249, and it presented the characteristics of regeneration type > maturity type > growth type > decline type, but the growth rate of the growth-type cities was in a leading position, and there was a catch-up effect. 2) The economic resilience level of resource-based cities showed significant spatial differentiation, with a trend of eastern region > central region > western region > northeastern region. The economic resilience level of the eastern, central, and western regions had been increasing year by year, while the northeastern region showed abnormal fluctuations. The hotspot areas were distributed in the Huang-Huai-Hai region centered on Xuzhou, Jining, and so on, while the cold spot areas had shifted from the southwestern and northwestern regions to the northeastern region. 3) At the system level, the ability to resist and recover, as well as the ability to adapt and regulate, were the main obstacles to improving the economic resilience of resource-based cities. At the indicator level, insufficient wealth accumulation among residents, weak demands, unhealthy fiscal policies, and rigid constraints from industrial structure were important factors that impaired economic resilience. This study provides a scientific reference for enhancing the economic resilience of resource-based cities and formulating relevant resilience development policies.
表1 资源型城市经济韧性评价指标体系Tab.1 Comprehensive evaluation indicator system of economic resilience in resource-based cities in China |
| 目标层 | 系统层 | 指标层 | 指标属性 | 指标权重 |
|---|---|---|---|---|
| 城市经济韧性 | A抵抗与恢复能力 | A1 人均地区生产总值(元) | 正向 | 0.0824 |
| A2 城镇居民可支配收入(元) | 正向 | 0.0675 | ||
| A3 城乡居民储蓄余额(元) | 正向 | 0.2713 | ||
| A4 城镇登记失业人数(人) | 负向 | 0.0035 | ||
| A5 进出口总额占GDP比重(%) | 负向 | 0.0016 | ||
| B适应与调节能力 | B1 地方财政收支比(%) | 正向 | 0.0614 | |
| B2 社会消费品零售总额(万元) | 正向 | 0.2571 | ||
| B3 第三产业增加值占GDP比重(%) | 正向 | 0.0290 | ||
| B4 年末金融机构存贷比(%) | 正向 | 0.0239 | ||
| B5 固定资产投资额(万元) | 正向 | 0.0026 | ||
| C转型与发展能力 | C1 专利授权数(件) | 正向 | 0.0030 | |
| C2 产业结构高级化 | 正向 | 0.0807 | ||
| C3 财政科学支出(万元) | 正向 | 0.1024 | ||
| C4 财政教育支出(万元) | 正向 | 0.0136 |
gj=1-ej
Vij=1-Xij
表2 2010—2020年中国资源型城市经济韧性水平Tab.2 Annual average economic resilience of resource-based cities in China during 2010-2022 |
| 总体韧性水平 | 抵抗与恢复韧性水平 | 适应与调节韧性水平 | 转型与发展韧性水平 | |
|---|---|---|---|---|
| 2010年 | 0.0679 | 0.0159 | 0.0309 | 0.0211 |
| 2014年 | 0.0883 | 0.0283 | 0.0365 | 0.0235 |
| 2018年 | 0.1066 | 0.0396 | 0.0394 | 0.0276 |
| 2022年 | 0.1249 | 0.0533 | 0.0412 | 0.0303 |
| 年均增长幅度/% | 5.20 | 10.58 | 2.43 | 3.07 |
表3 2010—2022年中国资源型城市经济韧性障碍及演变Tab.3 Obstacles and change of economic resilience of resource-based cities in China during 2010-2022 |
| 障碍因子 | 障碍度/% | ||||
|---|---|---|---|---|---|
| 2010年 | 2014年 | 2018年 | 2022年 | ||
| A抵抗与恢复能力 | 45.58 | 44.60 | 43.54 | 43.43 | |
| A1 进出口总额占GDP比重 | 0.06 | 0.05 | 0.03 | 0.03 | |
| A2 城镇登记失业人数 | 0.31 | 0.21 | 0.12 | 0.24 | |
| A3 城乡居民储蓄余额 | 29.80 | 28.87 | 28.36 | 28.34 | |
| A4 城镇居民可支配收入 | 5.73 | 6.32 | 6.24 | 5.91 | |
| A5 人均地区生产总值 | 9.70 | 9.15 | 8.78 | 8.91 | |
| B适应与调节能力 | 35.12 | 34.50 | 36.69 | 36.80 | |
| B1 固定资产投资额 | 0.27 | 0.25 | 0.19 | 0.15 | |
| B2 年末金融机构存贷比 | 2.36 | 1.92 | 2.62 | 2.60 | |
| B3 第三产业增加值占GDP比重 | 1.74 | 1.85 | 1.99 | 1.60 | |
| B4 社会消费品零售总额 | 26.03 | 26.25 | 26.73 | 27.50 | |
| B5 地方财政收支比 | 4.72 | 4.23 | 5.16 | 4.95 | |
| C转型与发展能力 | 19.30 | 20.91 | 19.78 | 19.77 | |
| C1 财政教育支出 | 0.84 | 0.60 | 0.78 | 0.88 | |
| C2 财政科学支出 | 9.66 | 11.82 | 10.85 | 10.85 | |
| C3 产业结构高级化 | 8.68 | 8.34 | 7.80 | 7.71 | |
| C4 专利授权数 | 0.12 | 0.16 | 0.35 | 0.33 | |
| [1] |
余建辉, 李佳洺, 张文忠. 中国资源型城市识别与综合类型划分[J]. 地理学报, 2018, 73(4): 677-687.
[
|
| [2] |
卢硕, 张文忠, 余建辉, 等. 资源型城市演化阶段识别及其发展特征[J]. 地理学报, 2020, 75(10): 2180-2191.
[
|
| [3] |
文琦, 侯凯元, 郑殿元, 等. 成长型资源城市产业转型能力评价与优化路径: 以榆林市为例[J]. 地理科学, 2022, 42(4): 682-691.
[
|
| [4] |
|
| [5] |
|
| [6] |
|
| [7] |
|
| [8] |
|
| [9] |
|
| [10] |
|
| [11] |
|
| [12] |
|
| [13] |
|
| [14] |
|
| [15] |
徐康宁, 韩剑. 中国区域经济的“资源诅咒”效应: 地区差距的另一种解释[J]. 经济学家, 2005(6): 96-102.
[
|
| [16] |
熊剑平, 刘承良, 张传琪, 等. 资源枯竭型城市产业发展评价与接续选择: 以湖北省大冶市为例[J]. 经济地理, 2009, 29(8): 1282-1287, 1306.
[
|
| [17] |
王文棋, 刘兆德, 赵虎. 中国资源型城市转型发展全景知识图谱: 演进脉络、热点追踪及未来展望[J]. 地理科学, 2024, 44(5): 785-795.
[
|
| [18] |
张文忠, 余建辉. 中国资源型城市转型发展的政策演变与效果分析[J]. 自然资源学报, 2023, 38(1): 22-38.
[
|
| [19] |
唐宇, 薛东前, 宋永永, 等. 黄土高原资源型城市经济规模—结构—效率耦合协调特征及影响因素[J]. 地理学报, 2025, 80(3): 793-810.
[
|
| [20] |
窦睿音, 焦贝贝, 张文洁, 等. 西部资源型城市绿色发展效率时空分异与驱动力[J]. 自然资源学报, 2023, 38(1): 238-254.
[
|
| [21] |
张梦朔, 张平宇, 李鹤. 资源型城市经济转型绩效特征与评价方法: 基于东北地区的实证研究[J]. 自然资源学报, 2021, 36(8): 2051-2064.
[
|
| [22] |
陈妍, 王士君, 梅林. 东北地区非资源型城市与资源型城市产业转型的对比研究[J]. 地理研究, 2021, 40(3): 808-820.
[
|
| [23] |
王晓楠, 孙威. 黄河流域资源型城市转型效率及其影响因素[J]. 地理科学进展, 2020, 39(10): 1643-1655.
[
|
| [24] |
徐英启, 程钰, 王晶晶. 中国资源型城市碳排放效率时空演变与绿色技术创新影响[J]. 地理研究, 2023, 42(3): 878-894.
[
|
| [25] |
王珏. 中国资源型城市绿色转型的动力源泉及其驱动因素[J]. 经济地理, 2024, 44(4): 75-83, 99.
[
|
| [26] |
郑洋, 程琳琳, 王义方, 等. 资源型城市空间冲突测度及其空间响应研究[J]. 地理科学进展, 2023, 42(2): 275-286.
[
|
| [27] |
朱媛媛, 罗源, 陈京, 等. 资源枯竭型城市产业转型及其经济韧性: 以湖北省大冶市为例[J]. 自然资源学报, 2023, 38(1): 73-90.
[
|
| [28] |
胡晓辉, 张文忠. 制度演化与区域经济弹性: 两个资源枯竭型城市的比较[J]. 地理研究, 2018, 37(7): 1308-1319.
[
|
| [29] |
黄梦涵, 张卫国. 中国四类资源型城市韧性水平比较与发展策略[J]. 经济地理, 2023, 43(1): 34-43.
[
|
| [30] |
唐宇, 宋永永, 薛东前, 等. 资源型城市经济韧性时空演变与障碍因素: 以山西省为例[J]. 干旱区资源与环境, 2022, 36(5): 53-61.
[
|
| [31] |
张学波, 付文硕, 马海涛. 京津冀地区经济韧性与产业结构演变的耦合关联[J]. 地理学报, 2023, 78(10): 2392-2411.
[
|
| [32] |
曹贤忠, 吕磊. 长三角数字技术创新网络时空演化特征及其经济韧性效应研究[J]. 地理科学进展, 2025, 44(1): 1-16.
[
|
| [33] |
李建新, 梁曼, 钟业喜. 长江经济带经济与环境协调发展的时空格局及问题区域识别[J]. 长江流域资源与环境, 2020, 29(12): 2584-2596.
[
|
| [34] |
|
| [35] |
孟广文, 张宁月, 齐宏纲, 等. 天津经济技术开发区转型发展与障碍度研究[J]. 地理学报, 2024, 79(8): 2042-2061.
[
|
/
| 〈 |
|
〉 |

