
城市科学视角下的中国建成区域位序—规模关系研究
|
邓小月(1999— ),女,贵州遵义人,博士生,主要研究方向为城市标度与城市治理。E-mail: dengxy@connect.hku.hk |
收稿日期: 2024-05-24
修回日期: 2024-07-21
网络出版日期: 2024-11-26
基金资助
国家自然科学基金项目(42171192)
Rank-size relationship of built-up patches in China from the perspective of urban science
Received date: 2024-05-24
Revised date: 2024-07-21
Online published: 2024-11-26
Supported by
National Natural Science Foundation of China(42171192)
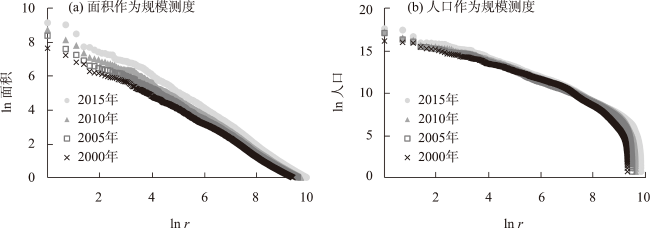
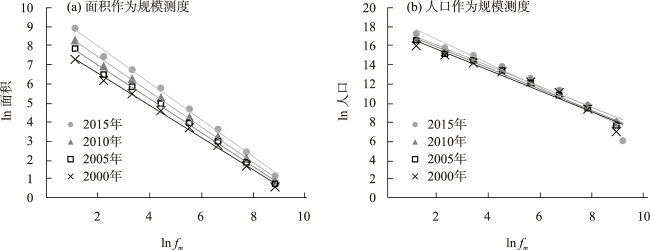
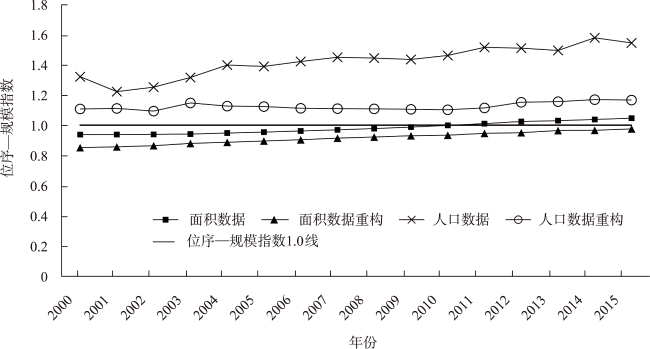
建成区用地是城市体系的重要组成部分。论文从城市科学的视角出发,将建成区域视为一种遵循一定自然规律的研究对象,分别使用传统的和等级重构的位序—规模分布模型分析其面积与人口规模分布,并且检验了建成区规模增长是否服从Gibrat定律。研究发现,建成区域的面积规模在两种模型下都服从位序—规模分布,而人口规模仅在重构的模型下才服从位序—规模分布。而使用两种规模测度的建成区域体系,都不适用Gibrat定律。结果表明,中国建成区内部建成行为与人口流动动力机制存在结构性差异,其中建成行为具有中心化管理的趋势,而人口流动具有去中心化特征,因此面积的扩张易于人口增长。在算法意义上,相比于传统的位序—规模表达,等级标度模型具有给数据降噪的功能,可以作为大样本量位序—规模分析时的优化算法;在理论上,等级标度模型从宏观结构上给位序—规模提供了一种解释,即位序—规模图式是一种宏观的、隐藏的秩序,需要在经验数据的重构中重新发现规律。
邓小月 , 何深静 , 陈彦光 . 城市科学视角下的中国建成区域位序—规模关系研究[J]. 地理科学进展, 2024 , 43(11) : 2147 -2156 . DOI: 10.18306/dlkxjz.2024.11.004
From the perspective of urban science, this study assumed that the development of built-up areas follows certain natural law. Using the conventional and reconstructed scaling expression of rank-size distribution models, this study analyzed built-up area and population size distributions, and examined whether the size of built-up areas follow the Gibrat's law. The conventional expression of rank-size distribution is from empirical patterns while the reconstructed one is mathematically derived from a hierarchical fractal system. Thus, the reconstructing process itself is to connect the empirical phenomenon to the hidden order, which is consistent with the perspective of urban science. Specifically, to match the area and population datasets, this study first applied city cluster algorithm to delineate all built-up areas in China, using the global impervious area data. Then the boundaries of built-up areas were used to aggregate population size from the LandScan world population product. The study found that the area size of built-up areas follows the rank-size distribution under both models, while the population size follows that only under the reconstructed model. Moreover, the Gibrat's law is not suitable for explaining the rank-size patterns of the built-up area system. The research results reveal the structural differences in the dynamic mechanism of urban development and population mobility within built-up area systems in China. Urban development shows a tendency of centralized management, and area expansion is easier/quicker than population growth. The potential contribution of this research is two-fold: first, the reconstructed scaling model can filter data noises algorithmically and thus can be used as an optimization algorithm for large sample size sequence-scale analysis; second, the reconstructed scaling model has a macroscopic structure that provides an explanation for rank-size distribution, that is, the rank-scale schema is a macroscopic pattern and hidden order, which needs to be rediscovered through reconstructing the empirical data.
Key words: urban science; Zipf's law; urban scaling law; fractal cities
表1 面积、人口规模测度下的位序—规模指数Tab.1 Zipf’s index estimated by area and population as size measurement respectively |
| 年份 | 面积规模 | 人口规模 | |||||
|---|---|---|---|---|---|---|---|
| Zipf指数 | 样本数量 | 校正后R2 | Zipf指数 | 样本数量 | 校正后R2 | ||
| 2000 | 0.9375 | 11897 | 0.9961 | 1.3213 | 2998 | 0.9533 | |
| 2001 | 0.9385 | 12479 | 0.9963 | 1.2221 | 3324 | 0.9847 | |
| 2002 | 0.9393 | 13130 | 0.9965 | 1.2520 | 4179 | 0.9846 | |
| 2003 | 0.9412 | 13558 | 0.9967 | 1.3156 | 4605 | 0.9864 | |
| 2004 | 0.9479 | 13934 | 0.9968 | 1.3981 | 6655 | 0.9862 | |
| 2005 | 0.9543 | 14322 | 0.9970 | 1.3895 | 7134 | 0.9869 | |
| 2006 | 0.9615 | 14686 | 0.9973 | 1.4216 | 8042 | 0.9809 | |
| 2007 | 0.9690 | 15074 | 0.9974 | 1.4497 | 8774 | 0.9791 | |
| 2008 | 0.9776 | 15494 | 0.9974 | 1.4445 | 8952 | 0.9793 | |
| 2009 | 0.9878 | 15840 | 0.9975 | 1.4355 | 9225 | 0.9805 | |
| 2010 | 0.9985 | 16218 | 0.9976 | 1.4618 | 9795 | 0.9796 | |
| 2011 | 1.0104 | 16714 | 0.9974 | 1.5154 | 11810 | 0.9789 | |
| 2012 | 1.0241 | 17304 | 0.9971 | 1.5103 | 11846 | 0.9830 | |
| 2013 | 1.0298 | 18076 | 0.9972 | 1.4945 | 12085 | 0.9861 | |
| 2014 | 1.0384 | 18876 | 0.9970 | 1.5783 | 12578 | 0.9836 | |
| 2015 | 1.0465 | 19969 | 0.9940 | 1.5449 | 13194 | 0.9836 | |
注:表中的样本数量,指的是参与最小二乘回归的数据量。由于使用最小二乘法时只选取了双对数线性区间内的数据,因此,该样本量小于总的斑块数量。 |
表2 斑块规模对其相对增长率影响的回归结果Tab.2 Regression results for the effects of patch sizes on relative growth rate |
| 时间 | 所有城市 | 前100位 | 前500位 | 前1000位 | 前5000位 |
|---|---|---|---|---|---|
| 2001—2005年 | -0.349*** (-18.38) | -0.339*** (-8.30) | -0.372*** (-5.24) | -0.374*** (-5.68) | -0.372*** (-18.07) |
| 2006—2010年 | -0.319*** (-7.53) | -0.380*** (-16.29) | -0.355*** (-12.66) | -0.317*** (-9.74) | -0.348*** (-7.19) |
| 2011—2015年 | -0.369*** (-13.55) | -0.717*** (-10.84) | -0.623*** (-7.36) | -0.585*** (-8.75) | -0.405*** (-14.91) |
注:表中的参数是模型(6)中参数β的估计结果,括号中数值为其t统计量;***表示P<0.01。 |
表3 使用等级标度重构模型所得位序—规模指数Tab.3 Zipf’s index estimated by using the reconstructed hierarchical scaling expression of rank-size distribution |
| 年份 | 模型1 | 模型2 | |||||||||||||
|---|---|---|---|---|---|---|---|---|---|---|---|---|---|---|---|
| 面积数据 | 人口数据 | 面积数据 | 人口数据 | ||||||||||||
| Zipf指数 | 校正后R2 | 样本数量 | Zipf指数 | 校正后R2 | 样本数量 | Zipf指数 | 校正后R2 | 样本数量 | Zipf指数 | 校正后R2 | 样本数量 | ||||
| 2000 | 0.8650 | 0.9962 | 12 | 1.1162 | 0.9623 | 13 | 0.8514 | 0.9961 | 8 | 1.1072 | 0.9579 | 8 | |||
| 2001 | 0.8696 | 0.9957 | 12 | 1.1216 | 0.9767 | 13 | 0.8566 | 0.9961 | 8 | 1.1111 | 0.9736 | 8 | |||
| 2002 | 0.8778 | 0.9958 | 12 | 1.1029 | 0.9812 | 13 | 0.8646 | 0.9963 | 8 | 1.0933 | 0.9776 | 8 | |||
| 2003 | 0.8918 | 0.9950 | 12 | 1.1585 | 0.9836 | 13 | 0.8792 | 0.9960 | 8 | 1.1478 | 0.9812 | 8 | |||
| 2004 | 0.8994 | 0.9947 | 12 | 1.1382 | 0.9890 | 13 | 0.8869 | 0.9958 | 8 | 1.1264 | 0.9868 | 8 | |||
| 2005 | 0.9080 | 0.9944 | 12 | 1.1353 | 0.9897 | 13 | 0.8950 | 0.9952 | 8 | 1.1235 | 0.9876 | 8 | |||
| 2006 | 0.9171 | 0.9954 | 12 | 1.1238 | 0.9891 | 13 | 0.9033 | 0.9959 | 8 | 1.1124 | 0.9866 | 8 | |||
| 2007 | 0.9276 | 0.9953 | 12 | 1.1218 | 0.9886 | 13 | 0.9140 | 0.9959 | 8 | 1.1101 | 0.9862 | 8 | |||
| 2008 | 0.9355 | 0.9950 | 12 | 1.1196 | 0.9890 | 13 | 0.9220 | 0.9958 | 8 | 1.1080 | 0.9869 | 8 | |||
| 2009 | 0.9431 | 0.9960 | 12 | 1.1168 | 0.9898 | 13 | 0.9297 | 0.9963 | 8 | 1.1051 | 0.9879 | 8 | |||
| 2010 | 0.9475 | 0.9960 | 12 | 1.1140 | 0.9891 | 13 | 0.9337 | 0.9961 | 8 | 1.1021 | 0.9871 | 8 | |||
| 2011 | 0.9663 | 0.9978 | 13 | 1.1275 | 0.9882 | 13 | 0.9456 | 0.9964 | 8 | 1.1144 | 0.9868 | 8 | |||
| 2012 | 0.9726 | 0.9976 | 13 | 1.1676 | 0.9909 | 13 | 0.9503 | 0.9961 | 8 | 1.1524 | 0.9892 | 8 | |||
| 2013 | 0.9871 | 0.9983 | 13 | 1.2256 | 0.9859 | 14 | 0.9649 | 0.9974 | 8 | 1.1556 | 0.9903 | 8 | |||
| 2014 | 0.9895 | 0.9978 | 13 | 1.2440 | 0.9833 | 14 | 0.9664 | 0.9968 | 8 | 1.1694 | 0.9877 | 8 | |||
| 2015 | 0.9973 | 0.9962 | 13 | 1.2330 | 0.9859 | 14 | 0.9752 | 0.9950 | 8 | 1.1664 | 0.9894 | 9 | |||
注:模型1采用2作为等级之间数量递增的倍数,模型2采用3作为等级之间数量递增的倍数,两者都空出了第一个等级,即本文重构的等级体系不存在最高等级的城市,最高仅有第二等级,在两个模型下分别有两个、三个城市;样本数量指参与回归的样本点数量,由于该模型对原始数据进行了重构,以等级关系进行拟合,所以样本点的数量大幅减少,但是包括的原始斑块数量却多于传统模型。 |
| [1] |
|
| [2] |
|
| [3] |
龚健雅, 许刚, 焦利民, 等. 城市标度律及应用[J]. 地理学报, 2021, 76(2): 251-260.
[
|
| [4] |
陈彦光. 城市地理研究中的单分形, 多分形和自仿射分形[J]. 地理科学进展, 2019, 38(1): 38-49.
[
|
| [5] |
|
| [6] |
陈彦光. 分形城市系统: 标度·对称·空间复杂性[M]. 北京: 科学出版社, 2008.
[
|
| [7] |
陈彦光. 城市异速标度研究的起源、困境和复兴[J]. 地理研究, 2013, 32(6): 1033-1045.
[
|
| [8] |
|
| [9] |
|
| [10] |
|
| [11] |
|
| [12] |
|
| [13] |
|
| [14] |
|
| [15] |
|
| [16] |
|
| [17] |
|
| [18] |
|
| [19] |
|
| [20] |
许学强, 周一星, 宁越敏. 城市地理学[M]. 2版. 北京: 高等教育出版社, 2009.
[
|
| [21] |
布莱恩·贝利. 比较城市化: 20世纪的不同道路[M]. 汪侠, 俞金国, 赵玉宗, 等译. 北京: 商务印书馆, 2017.
[
|
| [22] |
张飞, 孔伟. 我国土地城镇化的时空特征及机理研究[J]. 地域研究与开发, 2014, 33(5): 144-148.
[
|
| [23] |
孙斌栋, 王言言, 张志强, 等. 中国城市规模分布的形态和演化与城市增长模式: 基于Zipf定律与Gibrat定律的分析[J]. 地理科学进展, 2022, 41(3): 361-370.
[
|
| [24] |
|
| [25] |
|
| [26] |
|
| [27] |
|
| [28] |
|
| [29] |
|
| [30] |
|
| [31] |
|
| [32] |
自然资源部国土空间规划局. 城区范围确定规范[EB/OL]. 2020-10-12 [2024-03-05]. http://www.linzhou.gov.cn/upload/402881fa2194c26c012194c38dc80001/20201215/20201215153201929.pdf.
[Ministry of Natural Resources Land and Spatial Planning Bureau. Specifications for determining urban built-up area boundaries. 2020-10-12 [2024-03-05]. http://www.linzhou.gov.cn/upload/402881fa2194c26c012194c38dc80001/20201215/20201215153201929.pdf.]
|
| [33] |
|
| [34] |
谈明洪, 吕昌河. 以建成区面积表征的中国城市规模分布[J]. 地理学报, 2003, 58(2): 285-293.
[
|
| [35] |
|
| [36] |
|
| [37] |
|
| [38] |
约翰·H·霍兰. 隐秩序: 适应性造就复杂性[M]. 周晓牧, 韩晖, 译. 周晓牧, 韩晖, 译. 上海: 上海科技教育出版社, 2011.
[
|
| [39] |
|
| [40] |
林李月, 朱宇. 中国城市流动人口户籍迁移意愿的空间格局及影响因素: 基于 2012 年全国流动人口动态监测调查数据[J]. 地理学报, 2016, 71(10): 1696-1709.
[
|
/
| 〈 |
|
〉 |