
起讫点建成环境对轨道交通高峰时段网络客流的作用机制分析
|
庞磊(1993— ),男,山东寿光人,博士生,研究方向为城市交通地理、时空大数据分析。E-mail: pl2020@tju.edu.cn |
收稿日期: 2024-01-05
修回日期: 2024-03-28
网络出版日期: 2024-09-25
基金资助
国家自然科学基金项目(52278070)
Mechanism of impact of the built environment of urban rail transit origin and destination stations on network ridership during peak hours
Received date: 2024-01-05
Revised date: 2024-03-28
Online published: 2024-09-25
Supported by
National Natural Science Foundation of China(52278070)
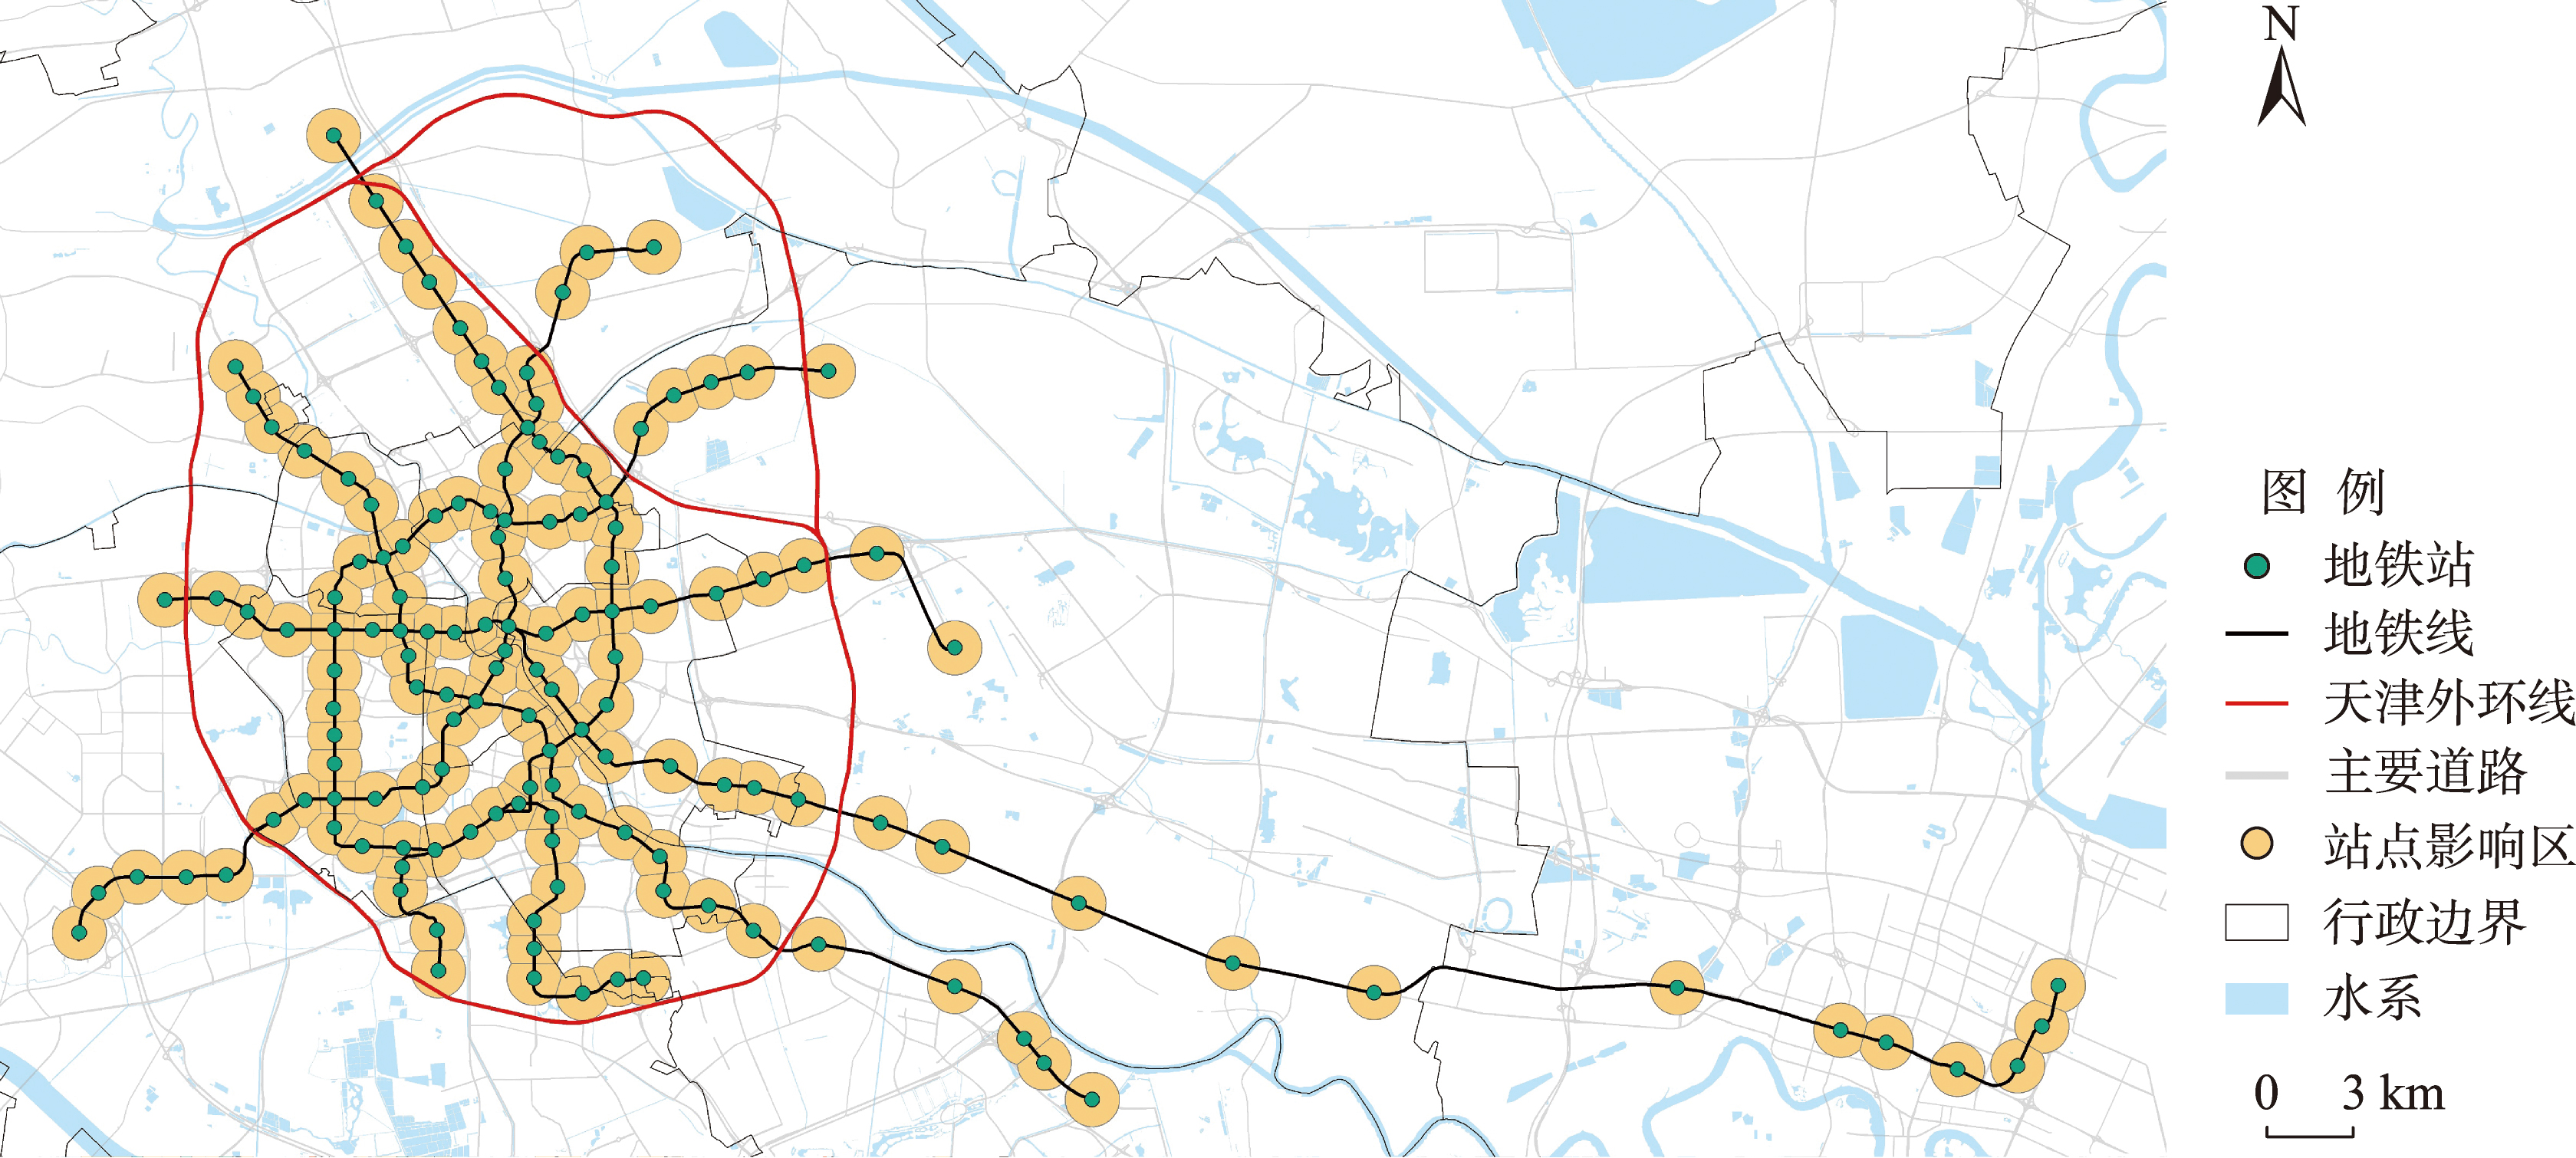
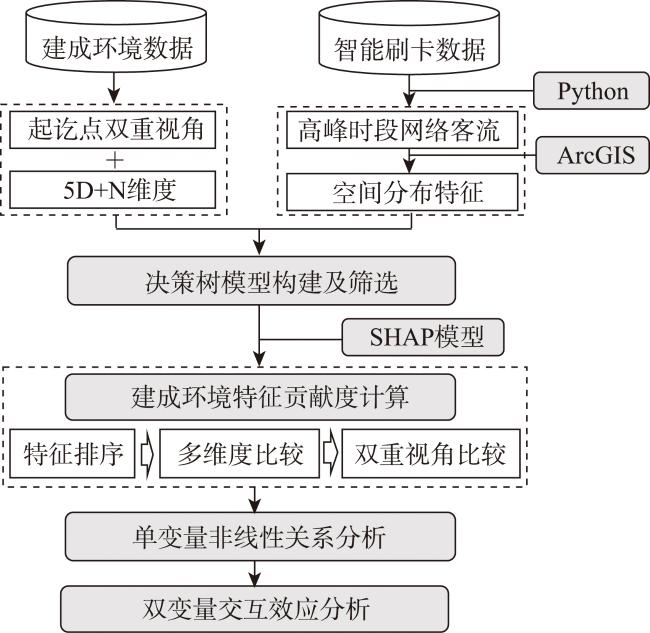
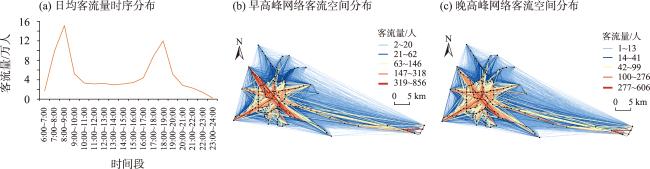
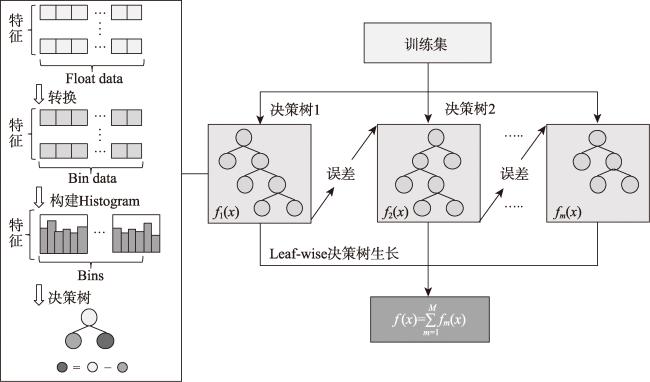
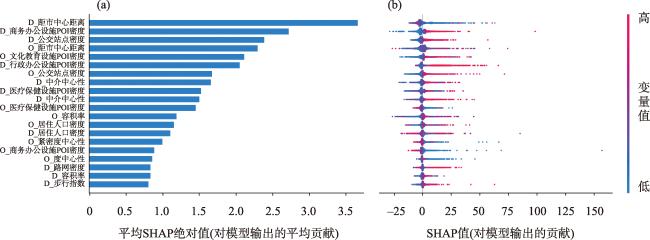
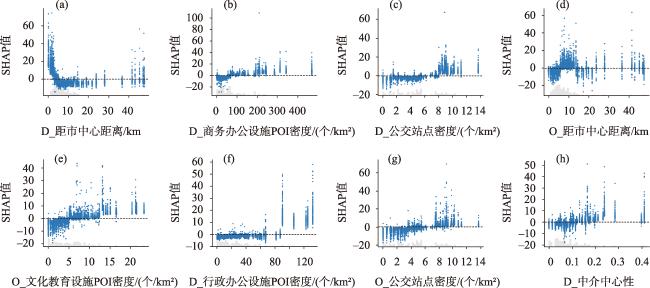
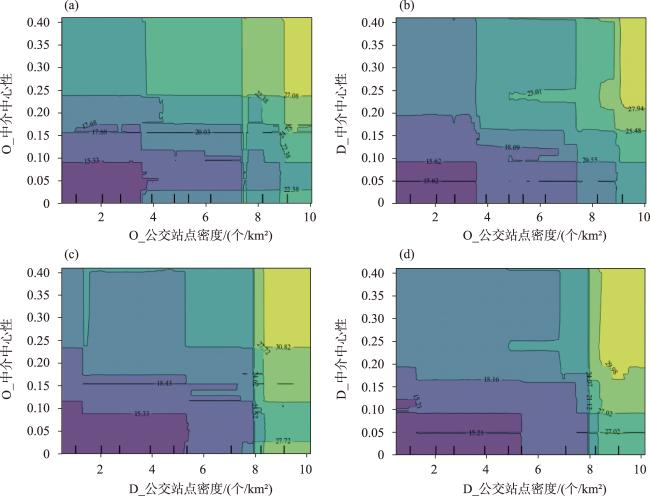
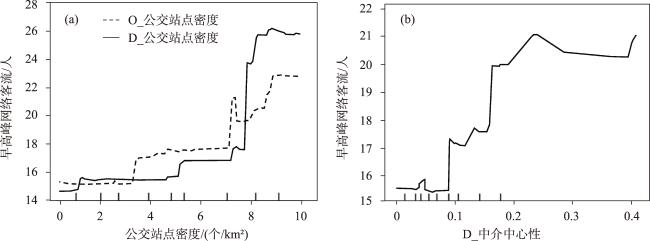
建成环境与轨道交通客流之间联系密切。然而既有研究主要致力于探究建成环境对轨道交通站点客流的影响,对网络客流的影响分析较少。与站点客流不同,网络客流的矢量性受起讫点建成环境的双重作用。论文基于多源地理空间数据构建“5D+N”维度的建成环境指标体系,采用可解释轻量级梯度提升机机器学习模型(LightGBM-SHAP)从特征贡献度、单变量非线性关系、双变量交互效应三个方面解析起讫点建成环境对高峰时段网络客流的影响。针对天津的案例研究表明:① 对早高峰网络客流重要度排序前5位的建成环境因素综合贡献达到13.22,其中讫点距市中心距离贡献度最大,从起讫点双重视角来看,讫点建成环境贡献度(20.86)大于起点建成环境贡献度(18.30);② 建成环境因素与早高峰网络客流的非线性关系差异显著,存在非线性正相关、非线性负相关等多种关系,阈值效应也存在单端阈值、多段阈值等多种情况;③ 对于早高峰网络客流,起点或讫点公交站点密度分别与讫点中介中心性有显著交互作用,公交站点密度在两者交互效应中处于主导地位。研究结果对引导站域建成环境更新及提升轨道交通客流效能提供了精准有效的策略指引。
庞磊 , 任利剑 , 姜宇逍 , 运迎霞 . 起讫点建成环境对轨道交通高峰时段网络客流的作用机制分析[J]. 地理科学进展, 2024 , 43(9) : 1785 -1797 . DOI: 10.18306/dlkxjz.2024.09.008
There exists a significant link between the built environment and rail transit ridership. However, the existing studies are mainly devoted to investigating the impact of the built environment on ridership at rail transit stations, and there are fewer analyses on the impact of network ridership. Unlike station ridership, the vectoral nature of network ridership is subject to the dual effects of the built environment at the origin and destination. In this study, we constructed a built environment indicator system with "5D+N" dimensions based on multi-source geospatial data, and used the LightGBM-SHAP model to analyze the impact of the built environment of the origin and destination stations on network ridership during peak hours from three aspects: the contribution of different characteristics, univariate nonlinear relationship, and bivariate interaction effect. The case study of Tianjin showed that: 1) The combined contribution of the top five built environment factors to the importance of network ridership in morning peak reached 13.22, among which the distance of the destination from the city center contributed the most, and the contribution of the built environment of the destination (20.86) was greater than the contribution of the built environment of the starting point (18.30). 2) The nonlinear relationship between built environment factors and morning peak network ridership varied significantly, with nonlinear positive correlation, nonlinear negative correlation, and so on, and the threshold effect also existed in a variety of cases, such as single-end threshold and multi-segment threshold. 3) For morning peak network ridership, origin or destination bus stop density significantly interacts with destination betweenness centrality, respectively, with bus stop density dominating the interaction effect. The results of the study provide a precise and effective strategy to guide the renewal of the built environment of the station area and to enhance the effectiveness of rail transit ridership.
表1 数据来源Tab.1 Data Sources |
| 数据名称 | 时间 | 数据来源 |
|---|---|---|
| 天津轨道交通智能刷卡数据 | 2020年(12月14—18日,周一到周五) | 天津市市政工程院交通规划研究中心 |
| 天津轨道交通站点线网数据 | 2020年 | 百度地图平台与天津轨道交通网站(http://www.tjgdjt.com) |
| 手机信令数据 | 2020年 | 中国联通 |
| 天津POI数据 | 2020年 | 通过百度地图API爬取 |
| 天津市道路网数据 | 2020年 | 通过Open Street Map采集 |
| 天津市公交站点数据 | 2020年 | 通过高德地图API爬取 |
| 交通等时圈数据 | 2020年 | 通过Mapbox Isochrone API获取(https://docs.mapbox.com/) |
| 天津市建筑外轮廓数据 | 2020年 | 通过百度地图API爬取 |
表2 变量定义Tab.2 Definition of the variables |
| 维度 | 指标 | 定义 | 平均值 | VIF | |||
|---|---|---|---|---|---|---|---|
| 起点 | 讫点 | 起点 | 讫点 | ||||
| 多样性 | POI混合度 | 表示POI类型的丰富性和复杂性 | 0.85 | 0.85 | 1.80 | 1.79 | |
| 密度 | 居住人口密度 | 站点影响区内夜间手机信令数量与站点影响区面积之比(万人/km²) | 2.14 | 2.16 | 2.26 | 2.30 | |
| 容积率 | 站点影响区内总建筑面积与其面积之比 | 1.21 | 1.22 | 5.82 | 5.44 | ||
| 设计 | 路网密度 | 站点影响区内道路网长度与其面积之比(km/km²) | 6.80 | 6.81 | 2.57 | 2.73 | |
| 步行指数 | 站点10 min骑行等时圈面积(km²) | 0.85 | 0.86 | 2.29 | 2.36 | ||
| 目的地 可达性 | 距市中心距离 | 各站点距离市中心的距离(本文以商业中心营口道为市中心,km) | 8.38 | 8.46 | 2.74 | 2.81 | |
| 行政办公设施POI密度 | 站点影响区内办公设施数量与其面积之比(个/km²) | 27.65 | 28.74 | 6.34 | 6.65 | ||
| 商业服务设施POI密度 | 站点影响区内餐饮、购物等商业服务设施数量与其面积之比(个/km²) | 92.78 | 95.33 | 4.62 | 4.67 | ||
| 商务办公设施POI密度 | 站点影响区内金融、企业等商务办公设施数量与其面积之比(个/km²) | 76.81 | 81.04 | 3.91 | 4.03 | ||
| 医疗保健设施POI密度 | 站点影响区内医疗保健设施数量与其面积之比(个/km²) | 21.62 | 21.30 | 4.55 | 4.69 | ||
| 文化教育设施POI密度 | 站点影响区内文化教育设施数量与其面积之比(个/km²) | 6.21 | 6.11 | 4.56 | 4.79 | ||
| 公交 邻近性 | 公交站点密度 | 站点影响区内公交站点数量与其面积之比(个/km²) | 4.92 | 4.96 | 2.49 | 2.50 | |
| 站点属 性特征 | 站点出入口个数 | 站点已开通运营的出入口数量(个) | 3.04 | 3.10 | 1.60 | 1.52 | |
| 度中心性 | 与节点相连接的邻近节点数(个) | 2.16 | 2.15 | 2.42 | 2.34 | ||
| 中介中心性 | 度量某节点出现在网络最短路径上的频率,表征节点作为中介的效率 | 0.09 | 0.09 | 3.61 | 3..66 | ||
| 接近中心性 | 从起始节点i到网络中其他所有节点的路径长度平均值的倒数,数值越大,成为中心点的可能性也越大 | 0.09 | 0.09 | 6.64 | 7.11 | ||
表4 不同决策树模型最优参数配置及评估指标结果Tab.4 Optimal parameter configuration and evaluation index results of different decision tree models |
| 模型类型 | 最大决策树数量 | 学习率 | 最大树深 | 测试集评估指标 | |||
|---|---|---|---|---|---|---|---|
| MAE | MSE | RMSE | R² | ||||
| GBDT | 2000 | 0.02 | 7 | 9.67 | 453.56 | 21.28 | 0.59 |
| XGBoost | 2000 | 0.05 | 7 | 9.64 | 447.86 | 21.16 | 0.60 |
| LightGBM | 2000 | 0.02 | 10 | 9.47 | 430.48 | 20.74 | 0.63 |
表5 起讫点建成环境对早高峰网络客流的贡献度Tab.5 Contribution of the built environment of the origin and destination stations to commuter network ridership |
| 维度 | 起点 | 讫点 | 贡献度 | |||||||
|---|---|---|---|---|---|---|---|---|---|---|
| 指标 | 平均绝对 SHAP值 | 排序 | 指标 | 平均绝对 SHAP值 | 排序 | 总计 | 平均值 | |||
| 多样性 | O_POI混合度 | 0.59 | 26 | D_POI混合度 | 0.52 | 28 | 1.11 | 0.56 | ||
| 密度 | O_居住人口密度 | 1.16 | 13 | D_居住人口密度 | 1.11 | 14 | 5.01 | 1.25 | ||
| O_容积率 | 1.91 | 12 | D_容积率 | 0.83 | 19 | |||||
| 设计 | O_路网密度 | 0.73 | 22 | D_路网密度 | 0.84 | 18 | 3.12 | 0.78 | ||
| O_步行指数 | 0.74 | 21 | D_步行指数 | 0.81 | 20 | |||||
| 目的地可达性 | O_距市中心距离 | 2.30 | 4 | D_距市中心距离 | 3.68 | 1 | 19.12 | 1.60 | ||
| O_行政办公设施POI密度 | 0.47 | 29 | D_行政办公设施POI密度 | 2.05 | 6 | |||||
| O_商业设施POI密度 | 0.56 | 27 | D_商业设施POI密度 | 0.63 | 25 | |||||
| O_商务办公设施POI密度 | 0.89 | 16 | D_商务办公设施POI密度 | 2.73 | 2 | |||||
| O_医疗保健设施POI密度 | 1.45 | 11 | D_医疗保健设施POI密度 | 1.53 | 9 | |||||
| O_文化教育设施POI密度 | 2.12 | 5 | D_文化教育设施POI密度 | 0.71 | 23 | |||||
| 公交邻近性 | O_公交站点密度 | 1.82 | 7 | D_公交站点密度 | 2.39 | 3 | 4.21 | 2.11 | ||
| 站点属性特征 | O_出入口数量 | 0.20 | 32 | D_出入口数量 | 0.43 | 30 | 6.59 | 0.82 | ||
| O_度中心性 | 0.86 | 17 | D_度中心性 | 0.30 | 31 | |||||
| O_中介中心性 | 1.50 | 10 | D_中介中心性 | 1.66 | 8 | |||||
| O_紧密度中心性 | 1.00 | 15 | D_紧密度中心性 | 0.64 | 24 | |||||
| [1] |
刘翔, 陈小鸿, 田茗舒. 成长性视角下建成环境对轨道交通站点客流影响分析[J]. 交通运输系统工程与信息, 2023, 23(2): 121-127.
[
|
| [2] |
张铭航, 韦锦, 范伟莉, 等. 城市轨道交通网络OD间路径旅行时间可靠性研究[J]. 城市交通, 2023, 21(2): 109-117, 72.
[
|
| [3] |
李峰清, 张欣, 赵民. 城市规划中的“通勤”概念辨析及“通勤阈值”界定探讨[J]. 城市规划, 2023, 47(6): 13-19.
[
|
| [4] |
柴彦威, 李彦熙, 李春江. 时空间行为规划: 核心问题与规划手段[J]. 城市规划, 2022, 46(12): 7-15.
[
|
| [5] |
张月朋, 王德. 上海市早高峰出行问题源头区识别[J]. 城市规划, 2021, 45(7): 83-90.
[
|
| [6] |
|
| [7] |
高德辉, 许奇, 陈培文, 等. 城市轨道交通客流与精细尺度建成环境的空间特征分析[J]. 交通运输系统工程与信息, 2021, 21(6): 25-32.
[
|
| [8] |
|
| [9] |
|
| [10] |
|
| [11] |
|
| [12] |
罗雪瑶, 张文佳, 柴彦威. 15分钟生活圈的建成环境阈值效应研究[J]. 地理研究, 2022, 41(8): 2155-2170.
[
|
| [13] |
|
| [14] |
|
| [15] |
|
| [16] |
彭诗尧, 陈绍宽, 许奇, 等. 基于POI的土地利用与轨道交通客流的空间特征[J]. 地理学报, 2021, 76(2): 459-470.
[
|
| [17] |
庞磊, 任利剑, 运迎霞. 建成环境对轨道交通站点客流量与通勤乘车率影响的差异化分析[J]. 交通运输系统工程与信息, 2023, 23(6): 206-214.
[
|
| [18] |
杨红, 申犁帆, 胡议文, 等. 老年人地铁出行时空特征及与建成环境非线性关系: 以武汉市为例[J]. 地理科学进展, 2023, 42(3): 491-504.
[
|
| [19] |
汪成刚, 王波, 王琪智, 等. 城市活力与建成环境的非线性关系和阈值效应研究: 以广州市中心城区为例[J]. 地理科学进展, 2023, 42(1): 79-88.
[
|
| [20] |
张文佳, 李春江, 罗雪瑶, 等. 机器学习与社区生活圈规划: 应用框架与议题[J]. 上海城市规划, 2021(4): 59-65.
[
|
| [21] |
崔叙, 喻冰洁, 杨林川, 等. 城市轨道交通出行的时空特征及影响因素非线性机制: 基于梯度提升决策树的成都实证[J]. 经济地理, 2021, 41(7): 61-72.
[
|
| [22] |
|
| [23] |
李培坤, 陈旭梅, 鲁文博, 等. 基于XGBoost-SHAP的地铁建成环境与站点出行距离的非线性关系研究[J]. 铁道科学与工程学报, 2024, 21(4): 1624-1633.
[
|
| [24] |
夏正伟, 张烨. 从“5D”到“5D+N”: 英文文献中TOD效能的影响因素研究[J]. 国际城市规划, 2019, 34(5): 109-116.
[
|
| [25] |
庞磊, 任利剑, 张哲浩, 等. 基于乘降客流特征的轨道交通站点分类及客流量影响因素分析[J]. 交通运输系统工程与信息, 2023, 23(4): 184-193.
[
|
| [26] |
|
| [27] |
马壮林, 杨兴, 胡大伟, 等. 城市轨道交通车站客流特征影响程度分析[J]. 清华大学学报(自然科学版), 2023, 63(9): 1428-1439.
[
|
| [28] |
|
| [29] |
|
| [30] |
李心雨, 闫浩文, 王卓, 等. 街景图像与机器学习相结合的道路环境安全感知评价与影响因素分析[J]. 地球信息科学学报, 2023, 25(4): 852-865.
[
|
| [31] |
王梓蒙, 刘艳芳, 罗璇, 等. 基于多源数据的城市活力与建成环境非线性关系研究: 以双休日武汉市主城区为例[J]. 地理科学进展, 2023, 42(4): 716-729.
[
|
| [32] |
吴莞姝, 马子迎, 郭金函, 等. 建成环境对街道活力的非线性效应: 基于XGBoost模型的多源大数据分析[J]. 中国园林, 2022, 38(12): 82-87.
[
|
| [33] |
许奇, 李雯茜, 陈越, 等. 建成环境对城市轨道交通起讫点客流的非线性影响及阈值效应[J]. 交通运输系统工程与信息, 2023, 23(4): 290-297.
[
|
| [34] |
冉江宇, 付凌峰, 阚长城, 等. 基于通勤大数据的城市职住分离度研究: 《2020年全国主要城市通勤监测报告》核心指标分析[J]. 城市交通, 2020, 18(5): 10-17.
[
|
| [35] |
|
| [36] |
曹哲静. 城市商业中心与交通中心的叠合与分异: 基于复杂网络分析的东京轨道交通网络与城市形态耦合研究[J]. 国际城市规划, 2020, 35(3): 42-53.
[
|
/
| 〈 |
|
〉 |