
长三角区域经济差距演变与政策效应分析——基于长三角扩容视角
|
郭艺(1993— ),男,陕西淳化人,博士生,主要研究方向为经济地理与区域发展模式。E-mail: guoyi_24@163.com |
收稿日期: 2024-01-03
修回日期: 2024-04-03
网络出版日期: 2024-09-25
基金资助
国家自然科学基金重点项目(42130510)
教育部人文社科重点基地重大项目(22JJD790017)
Changes of economic development disparities in the Yangtze River Delta and policy effect analysis from the perspective of Yangtze River Delta integration expansion
Received date: 2024-01-03
Revised date: 2024-04-03
Online published: 2024-09-25
Supported by
Key Program of National Natural Science Foundation of China(42130510)
Major Program of Humanities and Social Sciences of Ministry of Education, China(22JJD790017)
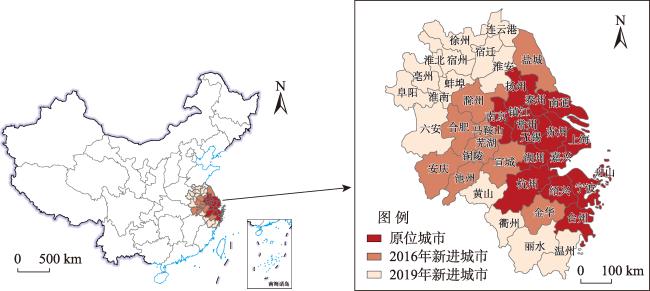
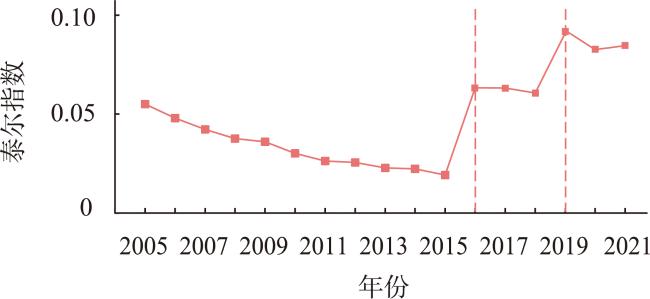
区域发展差距是经济地理学永恒的研究主题。论文以高质量一体化发展示范区的长三角作为研究对象,在刻画长三角一体化空间范围扩展过程中区域内经济差距动态演进的基础上,利用双重差分法、中介效应模型和空间杜宾模型等方法实证检验长三角一体化政策实施对区域内经济差距的影响及其作用机制。 结果表明:① 长三角一体化空间范围扩大造成了区域内经济差距加剧,但随着长三角一体化政策的推进,区域内经济发展不平衡问题得到了有效改善,并呈现经济差距缩小的长期演变趋势;② 从地理区位视角来看,长三角一体化政策对规划范围内地理区位偏远、经济基础薄弱地区的发展起到了重要的推动作用;③ 从边界视角来看,长三角一体化政策产生了明显的边界效应,降低了长三角周边有着类似的地理位置但不在长三角一体化规划范围内城市的战略、交通地位,对其发展产生了不利影响;④ 机制分析表明,长三角一体化政策实施主要通过交易成本效应、技术溢出效应和产业优化效应等途径缩小了区域内经济发展差距。在建设全国高质量发展样板区、打造世界级城市群等议题的背景下,研究能够为进一步完善长三角一体化推进框架、探索区域高质量一体化发展模式提供经验证据。

郭艺 , 曾刚 , 陈鹏鑫 , 万媛媛 . 长三角区域经济差距演变与政策效应分析——基于长三角扩容视角[J]. 地理科学进展, 2024 , 43(9) : 1681 -1695 . DOI: 10.18306/dlkxjz.2024.09.001
Regional development disparity is an eternal research topic of economic geography. Taking the Yangtze River Delta, a high-quality integrated development demonstration area, as the research object, this study examined the dynamic change of regional economic development disparities during the expansion of the spatial scope of Yangtze River Delta integration, and further used the difference-in-differences method, mediation effect model, and spatial Durbin model to empirically test the impact of the implementation of the Yangtze River Delta integration policy on regional economic development disparities and the mechanism of impact. The main conclusions are as follows: 1) The expansion of the spatial scope of Yangtze River Delta integration has caused an increase in the economic development disparity within the region. However, with the continuous promotion of Yangtze River Delta integration, the imbalance of economic development within the region has been effectively improved, and it showed a long-term trend of narrowing. 2) From the perspective of geographic locations, the Yangtze River Delta integration policy has played an important role in promoting the development of remote and economically weak areas within the planning scope. 3) From the regional boundary perspective, the Yangtze River Delta integration policy has had a significant border effect, reducing the strategic and transportation positions of cities with similar geographic locations around the Yangtze River Delta that are not within the scope of the integration plan, and having a negative impact on their development. 4) Mechanism analysis showed that the implementation of the Yangtze River Delta integration policy has narrowed the regional economic development disparity mainly by transaction cost effect, technology spillover effect, and industrial optimization effect. Under the background of building a national high-quality development model area and a world-class urban agglomeration, this study provides a theoretical support and empirical evidence for further improving the framework of Yangtze River Delta integration, and exploring replicable regional high-quality integrated development models.
表1 2010—2021年长三角区域经济发展差距的分解Tab.1 Decomposition of economic development disparity in the Yangtze River Delta region during 2010-2021 |
| 年份 | 总体差距 | 区域间差距 | 区域内差距 | 贡献率/% | |||||
|---|---|---|---|---|---|---|---|---|---|
| 总体 | 原位城市 | 2016年新进城市 | 2019年新进城市 | 区域间 | 区域内 | ||||
| 2010 | 0.0302 | — | 0.0302 | 0.0302 | — | — | — | — | |
| 2011 | 0.0264 | — | 0.0264 | 0.0264 | — | — | — | — | |
| 2012 | 0.0257 | — | 0.0257 | 0.0257 | — | — | — | — | |
| 2013 | 0.0230 | — | 0.0230 | 0.0230 | — | — | — | — | |
| 2014 | 0.0224 | — | 0.0224 | 0.0224 | — | — | — | — | |
| 2015 | 0.0193 | — | 0.0193 | 0.0193 | — | — | — | — | |
| 2016 | 0.0634 | 0.0394 | 0.0239 | 0.0181 | 0.0413 | — | 62.24 | 37.76 | |
| 2017 | 0.0632 | 0.0396 | 0.0237 | 0.0177 | 0.0415 | — | 62.58 | 37.42 | |
| 2018 | 0.0607 | 0.0377 | 0.0231 | 0.0164 | 0.0426 | — | 62.00 | 38.00 | |
| 2019 | 0.0924 | 0.0682 | 0.0242 | 0.0149 | 0.0258 | 0.0459 | 73.83 | 26.17 | |
| 2020 | 0.0827 | 0.0591 | 0.0236 | 0.0170 | 0.0224 | 0.0405 | 71.44 | 28.56 | |
| 2021 | 0.0847 | 0.0603 | 0.0244 | 0.0170 | 0.0223 | 0.0441 | 71.19 | 28.81 | |
表2 马尔科夫转移矩阵Tab.2 Traditional Markov transfer matrix |
| t时期 | n | t+1时期 | ||||
|---|---|---|---|---|---|---|
| HH | BH | BB | BL | LL | ||
| HH | 91 | 0.8681 | 0.1319 | 0 | 0 | 0 |
| BH | 202 | 0.0050 | 0.9158 | 0.0792 | 0 | 0 |
| BB | 107 | 0 | 0.0467 | 0.8598 | 0.0935 | 0 |
| BL | 127 | 0 | 0 | 0.0157 | 0.9134 | 0.0709 |
| LL | 113 | 0 | 0 | 0.0088 | 0.0088 | 0.9823 |
表3 长三角区域内经济差距类型的演变趋势预测Tab.3 Trend of change prediction for economic development disparity classes in the Yangtze River Delta region |
| 状态类型 | HH | BH | BB | BL | LL |
|---|---|---|---|---|---|
| 初始状态 | 0.3000 | 0.3500 | 0.1000 | 0.1750 | 0.0750 |
| 终极状态 | 0.0021 | 0.0549 | 0.0930 | 0.1699 | 0.6802 |
表4 基准回归结果Tab.4 Benchmark regression results |
| 变量 | 模型1 | 模型2 | 模型3 | 模型4 |
|---|---|---|---|---|
| policy | -0.610*** | -0.700*** | -0.250*** | -0.335*** |
| (0.091) | (0.064) | (0.063) | (0.053) | |
| 控制变量 | 否 | 否 | 否 | 是 |
| 年份固定效应 | 否 | 否 | 是 | 是 |
| 城市固定效应 | 否 | 是 | 是 | 是 |
| 样本量 | 2533 | 2533 | 2533 | 2533 |
| R2 | 0.017 | 0.845 | 0.880 | 0.921 |
注:*、**和***分别表示通过10%、5%和1%的显著性水平检验,括号内数值为稳健性标准误。下同。 |
表5 平行趋势检验Tab.5 Parallel trend test |
| 变量 | 回归结果 |
|---|---|
| pre_3 | -0.124(-1.64) |
| pre_2 | -0.115(-1.53) |
| pre_1 | -0.112(-1.48) |
| post_1 | -0.250***(-3.30) |
| post_2 | -0.263***(-3.46) |
| post_3 | -0.248*** (-2.61) |
| post_4 | -0.190** (-1.99) |
| post_5 | -0.161**(-1.69) |
| 控制变量 | 是 |
| 年份固定效应 | 是 |
| 城市固定效应 | 是 |
| 样本量 | 2533 |
| R2 | 0.921 |
表6 稳健性检验Tab.6 Robustness test |
| 变量 | 更换因变量 | PSM-DID | 增加控制变量 | 缩短样本区间 | 排除异常值 | ||
|---|---|---|---|---|---|---|---|
| dgdp | lgdp | ||||||
| policy | -3.360*** | -1.593*** | -0.367*** | -0.333*** | -0.160*** | -0.362*** | |
| (0.452) | (0.238) | (0.054) | (0.050) | (0.049) | (0.045) | ||
| 控制变量 | 是 | 是 | 是 | 是 | 是 | 是 | |
| 年份固定效应 | 是 | 是 | 是 | 是 | 是 | 是 | |
| 城市固定效应 | 是 | 是 | 是 | 是 | 是 | 是 | |
| 样本量 | 2533 | 2533 | 2199 | 2533 | 1937 | 2533 | |
| R2 | 0.978 | 0.912 | 0.922 | 0.925 | 0.947 | 0.932 | |
表7 交易成本效应检验Tab.7 Transaction cost effect test |
| 变量 | fac (模型5) | gap (模型6) | inf (模型7) | gap (模型8) | mob (模型9) | gap (模型10) | fina (模型11) | gap (模型12) |
|---|---|---|---|---|---|---|---|---|
| policy | 0.128*** | -0.335*** | 0.060*** | -0.315*** | 0.208*** | -0.324*** | 0.072*** | -0.261*** |
| (0.017) | (0.053) | (0.022) | (0.051) | (0.056) | (0.054) | (0.022) | (0.045) | |
| fac | -0.231** | |||||||
| (0.107) | ||||||||
| inf | -0.236*** | |||||||
| (0.049) | ||||||||
| mob | -0.053** | |||||||
| (0.026) | ||||||||
| fina | -0.706*** | |||||||
| (0.062) | ||||||||
| 控制变量 | 是 | 是 | 是 | 是 | 是 | 是 | 是 | 是 |
| 年份固定效应 | 是 | 是 | 是 | 是 | 是 | 是 | 是 | 是 |
| 城市固定效应 | 是 | 是 | 是 | 是 | 是 | 是 | 是 | 是 |
| 样本量 | 2533 | 2533 | 2533 | 2533 | 2533 | 2533 | 2533 | 2533 |
| R2 | 0.954 | 0.921 | 0.902 | 0.922 | 0.964 | 0.922 | 0.977 | 0.926 |
表8 技术溢出效应和产业优化效应Tab.8 Technology spillover effect and industrial optimization effect test |
| 变量 | patau (模型13) | gap (模型14) | apatau (模型15) | gap (模型16) | isu (模型17) | gap (模型18) | seu (模型19) | gap (模型20) |
|---|---|---|---|---|---|---|---|---|
| policy | 0.470*** | -0.246*** | 0.430*** | -0.239*** | 0.027*** | -0.329*** | 0.010*** | -0.210*** |
| (0.051) | (0.049) | (0.052) | (0.049) | (0.003) | (0.061) | (0.004) | (0.076) | |
| patau | -0.111*** | |||||||
| (0.189) | ||||||||
| apatau | -0.137*** | |||||||
| (0.019) | ||||||||
| isu | -0.640** | |||||||
| (0.266) | ||||||||
| seu | -1.491*** | |||||||
| (0.347) | ||||||||
| 控制变量 | 是 | 是 | 是 | 是 | 是 | 是 | 是 | 是 |
| 年份固定效应 | 是 | 是 | 是 | 是 | 是 | 是 | 是 | 是 |
| 城市固定效应 | 是 | 是 | 是 | 是 | 是 | 是 | 是 | 是 |
| 样本量 | 2533 | 2533 | 2533 | 2533 | 2533 | 2533 | 2235 | 2235 |
| R2 | 0.947 | 0.922 | 0.931 | 0.923 | 0.964 | 0.922 | 0.864 | 0.926 |
表9 空间溢出效应检验Tab.9 Spatial spillover effect test |
| 变量 | 地理距离权重矩阵(W1) | 经济距离权重矩阵(W2) |
|---|---|---|
| policy | -0.264*** | -0.336*** |
| (0.136) | (0.100) | |
| Wpolicy | 0.235 | 1.453 |
| (1.605) | (2.405) | |
| ρ | 3.356*** | -0.103 |
| (0.322) | (0.047) | |
| 控制变量 | 是 | 是 |
| 年份固定效应 | 是 | 是 |
| 城市固定效应 | 是 | 是 |
| 样本量 | 2533 | 2533 |
| R2 | 0.125 | 0.328 |
表10 有效边界检验Tab.10 Effective boundary test |
| 变量 | 资源型城市 (模型21) | 老工业城市 (模型22) | 规划边界内城市 (模型23) | 规划边界外城市 | |||||
|---|---|---|---|---|---|---|---|---|---|
| (模型24) | (模型25) | (模型26) | |||||||
| policy | -0.381*** | -0.372*** | -0.845*** | 0.195 | -0.039 | -0.047 | |||
| (0.098) | (0.085) | (0.114) | (0.154) | (0.039) | (0.039) | ||||
| 控制变量 | 是 | 是 | 是 | 是 | 是 | 是 | |||
| 年份固定效应 | 是 | 是 | 是 | 是 | 是 | 是 | |||
| 城市固定效应 | 是 | 是 | 是 | 是 | 是 | 是 | |||
| 样本数量 | 1173 | 782 | 2074 | 1853 | 1853 | 1853 | |||
| R2 | 0.916 | 0.932 | 0.929 | 0.936 | 0.988 | 0.980 | |||
| [1] |
王秋玉, 曾刚, 苏灿, 等. 经济地理学视角下长三角区域一体化研究进展[J]. 经济地理, 2022, 42(2): 52-63.
[
|
| [2] |
陈雯, 兰明昊, 孙伟, 等. 长三角一体化高质量发展: 内涵、现状及对策[J]. 自然资源学报, 2022, 37(6): 1403-1412.
[
|
| [3] |
孙久文. 新时代长三角高质量一体化发展的战略构想[J]. 人民论坛, 2021, 30(11): 60-63.
[
|
| [4] |
李国平. 着力打造长三角多中心网络化空间结构[J]. 人民论坛·学术前沿, 2019(4): 20-26.
[
|
| [5] |
樊杰, 赵浩, 郭锐. 我国区域发展差距变化的新趋势与应对策略[J]. 经济地理, 2022, 42(1): 1-11.
[
|
| [6] |
陆大道, 刘卫东. 论我国区域发展与区域政策的地学基础[J]. 地理科学, 2000, 20(6): 487-493.
[
|
| [7] |
|
| [8] |
|
| [9] |
刘华军, 彭莹, 裴延峰, 等. 全要素生产率是否已经成为中国地区经济差距的决定力量?[J]. 财经研究, 2018, 44(6): 50-63.
[
|
| [10] |
钟章奇, 陆扬, 刘志雄. 城市群规划政策的实施能否缩小非中心城市与中心城市间的经济差距? 来自中国283个城市的证据[J]. 地理研究, 2023, 42(4): 1050-1069.
[
|
| [11] |
杨宁宁, 罗小龙, 田冬, 等. 从核心到边缘的逆向演替: 以安徽蚌埠的城市变迁为例[J]. 地理科学, 2023, 43(5): 786-795.
[
|
| [12] |
安树伟, 李瑞鹏. 城市群核心城市带动外围地区经济增长了吗? 以京津冀和长三角城市群为例[J]. 中国软科学, 2022(9): 85-96.
[
|
| [13] |
刘乃全, 吴友. 长三角扩容能促进区域经济共同增长吗[J]. 中国工业经济, 2017(6): 79-97.
[
|
| [14] |
张跃, 刘莉, 黄帅金. 区域一体化促进了城市群经济高质量发展吗? 基于长三角城市经济协调会的准自然实验[J]. 科学学研究, 2021, 39(1): 63-72.
[
|
| [15] |
张学良, 李培鑫, 李丽霞. 政府合作、市场整合与城市群经济绩效: 基于长三角城市经济协调会的实证检验[J]. 经济学(季刊), 2017, 16(4): 1563-1582.
[
|
| [16] |
杨建坤, 曾龙, 陈淑云. 地方政府间合作有利于提高企业全要素生产率吗: 来自长三角城市群的经验证据[J]. 经济学报, 2023, 10(4): 252-283.
[
|
| [17] |
闫东升, 孙伟, 李平星, 等. 长三角一体化区域扩容的城市创新发展效应研究[J]. 地理研究, 2022, 41(9): 2568-2586.
[
|
| [18] |
郭艺, 曹贤忠, 魏文栋, 等. 长三角区域一体化对城市碳排放的影响研究[J]. 地理研究, 2022, 41(1): 181-192.
[
|
| [19] |
郑军, 郭宇欣, 唐亮. 区域一体化合作能否助推产业结构升级? 基于长三角城市经济协调会的准自然实验[J]. 中国软科学, 2021(8): 75-85.
[
|
| [20] |
强永昌, 杨航英. 长三角区域一体化扩容对企业出口影响的准自然实验研究[J]. 世界经济研究, 2020(6): 44-56, 136.
[
|
| [21] |
刘爽, 王震, 陈晨. 空间视角下的长三角区域一体化发展研究述评: 政策目标、现实挑战及规划干预[J]. 城乡规划, 2020(1): 58-69.
[
|
| [22] |
陈雯, 孙伟, 刘崇刚, 等. 长三角区域一体化与高质量发展[J]. 经济地理, 2021, 41(10): 127-134.
[
|
| [23] |
许泽宁, 陈子韬, 甄茂成. 区域一体化政策对城市高学历人才分布的影响与作用机制: 以长三角地区为例[J]. 地理研究, 2022, 41(6): 1540-1553.
[
|
| [24] |
王业强, 郭叶波, 赵勇, 等. 科技创新驱动区域协调发展: 理论基础与中国实践[J]. 中国软科学, 2017(11): 86-100.
[
|
| [25] |
安俞静, 袁丰, 孙伟, 等. 长三角科技创新平台布局时空演变及其影响因素[J]. 地理科学, 2023, 43(12): 2173-2182.
[
|
| [26] |
方锦程, 刘颖, 高昊宇, 等. 公共数据开放能否促进区域协调发展? 来自政府数据平台上线的准自然实验[J]. 管理世界, 2023, 39(9): 124-142.
[
|
| [27] |
李伟, 贺灿飞. 中国区域产业演化路径: 基于技术关联性与技术复杂性的研究[J]. 地理科学进展, 2021, 40(4): 620-634.
[
|
| [28] |
贺灿飞, 齐放, 盛涵天. 风险资本、政府引导基金与区域产业演化[J]. 区域经济评论, 2024(1): 13-21.
[
|
| [29] |
赵海峰, 张颖. 区域一体化对产业结构升级的影响: 来自长三角扩容的经验证据[J]. 软科学, 2020, 34(12): 81-86, 103.
[
|
| [30] |
王少剑, 高爽, 黄永源, 等. 基于超效率SBM模型的中国城市碳排放绩效时空演变格局及预测[J]. 地理学报, 2020, 75(6): 1316-1330.
[
|
| [31] |
庄德林, 刘雨晨, 王帅. 高铁通车对中国城市创业投资网络的影响: 基于跨城市创业投资事件的实证研究[J]. 地理科学进展, 2021, 40(10): 1626-1638.
[
|
| [32] |
郭峰, 熊云军, 石庆玲, 等. 数字经济与行政边界地区经济发展再考察: 来自卫星灯光数据的证据[J]. 管理世界, 2023, 39(4): 16-33.
[
|
| [33] |
周灿, 曾刚, 宓泽锋, 等. 区域创新网络模式研究: 以长三角城市群为例[J]. 地理科学进展, 2017, 36(7): 795-805.
[
|
| [34] |
|
| [35] |
余泳泽, 潘妍. 中国经济高速增长与服务业结构升级滞后并存之谜: 基于地方经济增长目标约束视角的解释[J]. 经济研究, 2019, 54(3): 150-165.
[
|
| [36] |
陈佑淋, 余珮珩, 王磊, 等. 区界重组对城市形态多中心与区域均衡发展的影响[J]. 地理科学进展, 2023, 42(11): 2084-2098.
[
|
| [37] |
马诗萍, 张文忠, 李绪茂. 特殊类型地区发展政策的国际经验[J]. 国际城市规划, 2020(7): 1-11.
[
|
| [38] |
陈航航, 贺灿飞, 毛熙彦. 区域一体化研究综述: 尺度、联系与边界[J]. 热带地理, 2018, 38(1): 1-12.
[
|
/
| 〈 |
|
〉 |