
三江源地区湖塘变化及其与多年冻土联系
|
汤芸淇(2000— ),女,江苏南京人,硕士生,主要从事遥感图像处理、城市与区域经济研究。E-mail: tyqucas1010@163.com |
收稿日期: 2023-10-27
修回日期: 2024-03-18
网络出版日期: 2024-07-23
基金资助
江苏省自然科学基金项目(BK20200828)
第二次青藏高原综合科学考察研究项目(2019QZKK0201)
国家自然科学基金项目(42376254)
Changes of lakes and ponds in the Three Rivers Source Region and their links to permafrost
Received date: 2023-10-27
Revised date: 2024-03-18
Online published: 2024-07-23
Supported by
Natural Science Foundation of Jiangsu Province(BK20200828)
The Second Tibetan Plateau Scientific Expedition and Research Program(2019QZKK0201)
National Natural Science Foundation of China(42376254)
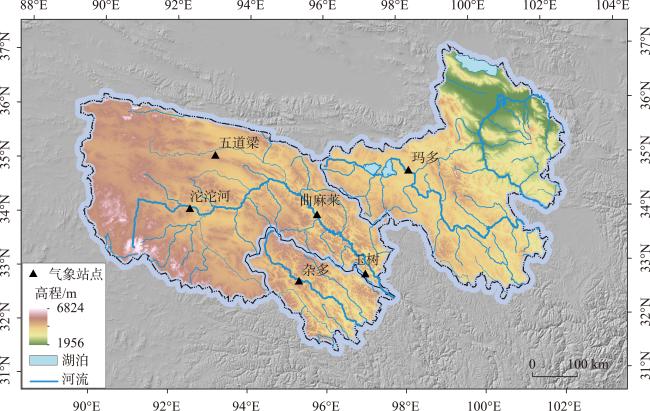
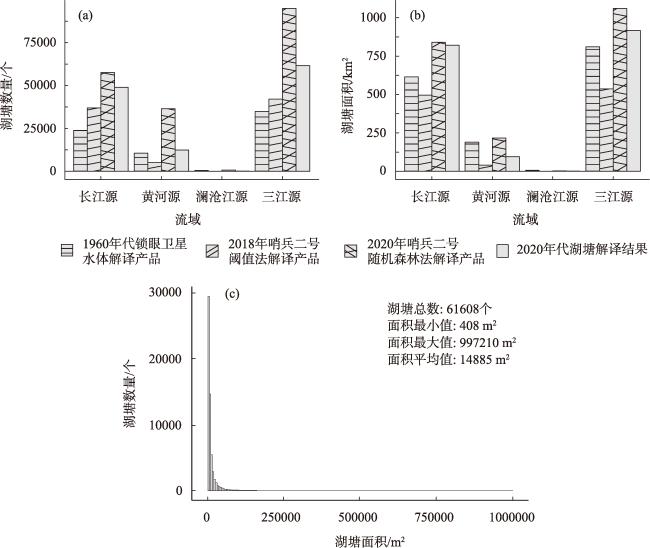
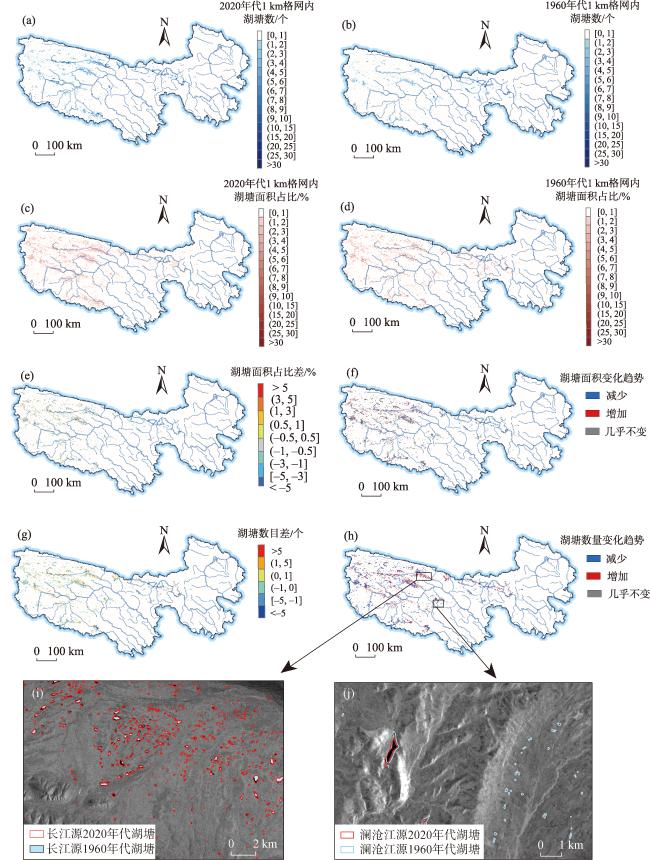
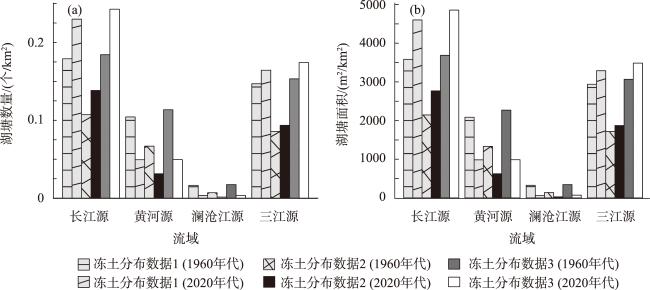
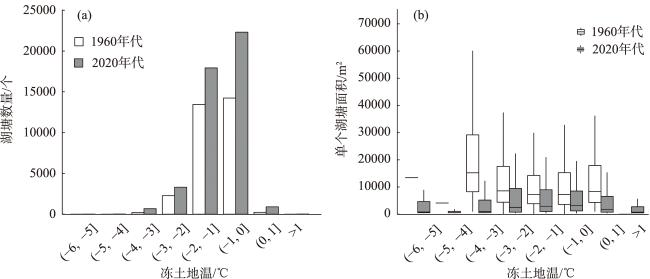
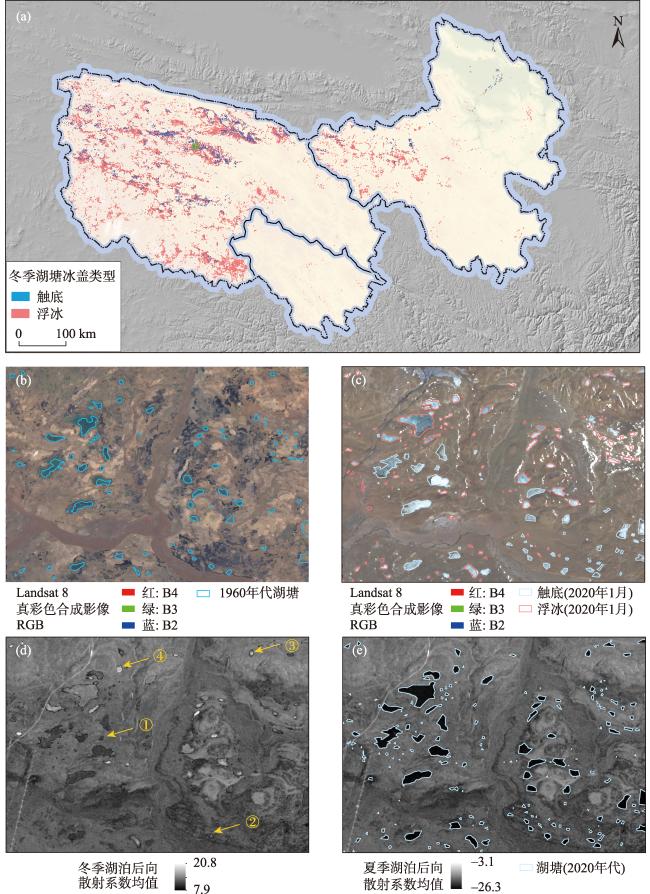
近年来,青藏高原湖泊的快速扩张引起广泛关注,已有不少研究系统分析了大于1 km2的大型湖泊的变化动态,但对于面积较小的由于多年冻土退化形成的热融湖塘,其在大范围流域尺度上的分布及变化研究尚不多见。论文基于光学和雷达影像,系统分析了三江源区内湖塘(< 1 km2)分布及其变化,以及与多年冻土之间的联系,并且首次揭示了湖塘底部融区的分布情况。结果表明:① 三江源区2020年代(2020—2022年)的湖塘面积达917.03 km2,湖塘总数为61608个。其中长江源区湖塘数量最多,达到48987个,黄河源区12459个,澜沧江源区最少。② 相较于1960年代,2020年代三江源区域面积小于1 km2湖塘数量增加了76%,面积增加了13%。长江源区湖塘扩张明显,黄河源区、澜沧江源区的部分湖塘萎缩。1960年代的湖塘有53%在2020年代依然存在。③ 三江源区80.9%的湖塘底部冬季存在融区,其中长江源有78.2%,黄河源有90.8%,澜沧江源有98.7%。在多年冻土区,有一半底部有融区的湖塘在1960年代就已存在,新增湖塘底部冬季较少存在融区,目前浮冰湖塘范围要远大于触底冰湖塘范围,可能会进一步加速多年冻土融化。研究结果可为分析多年冻土退化状态以及多年冻土退化与热融湖塘发育之间的联系提供基础,为高原地区热融湖塘碳排放研究提供基础数据。
汤芸淇 , 汪凌霄 , 赵林 , 李艳 , 李智斌 , 刘世博 , 邹德富 , 王紫珊 , 刘童 , 丁嘉怡 , 赵建婷 . 三江源地区湖塘变化及其与多年冻土联系[J]. 地理科学进展, 2024 , 43(7) : 1441 -1455 . DOI: 10.18306/dlkxjz.2024.07.013
In recent years, the rapid expansion of lakes on the Tibetan Plateau has attracted widespread attention, and a number of studies have systematically analyzed the dynamics of changes in large lakes with areas greater than 1 km2. However, the distribution and changes of smaller lakes and ponds formed due to permafrost degradation at the watershed scale have not yet been clarified. In this study, using optical and radar images, we systematically investigated the distribution and changes of lakes and ponds (< 1 km2) in the Three Rivers Source Region and their relationship with permafrost degradation, and for the first time examined the distribution of taliks at the bottom of the lakes and ponds. The results show that: 1) The total area of lakes and ponds in the Three Rivers Source Region in the 2020s (2020-2022) amounted to 917.03 km2, and the total number of lakes and ponds was 61608. The Yangtze River source area had the highest number of lakes and ponds, reaching 48987, followed by the Yellow River source area with 12459, and the Lancang River source area had the smallest number of lakes and ponds. 2) Compared with the 1960s, the number of lakes and ponds smaller than 1 km2 in the Three Rivers Source Region increased by 76% in the 2020s, and the total area increased by 13%. Although the expansion of lakes and ponds in the Yangtze River source area was obvious, some lakes and ponds in the Yellow River source area and the Lancang River source area experienced shrinkage. Of the lakes and ponds observed in the 1960s, 53% still existed in the 2020s. 3) Of the lakes and ponds in the Three Rivers Source Region, 80.9% have taliks at their bottoms in winter, including 78.2% in the Yangtze River source area, 90.8% in the Yellow River source area, and 98.7% in the Lancang River source area. In the permafrost zone, half of the lakes and ponds with taliks at their bottoms existed in the 1960s, and fewer new lakes and ponds have taliks at their bottoms in winter. Currently, the extent of floating-ice lakes and ponds is much larger than the extent of grounded-ice lakes and ponds, which may further accelerate the thawing of the underlying permafrost. The findings of this study can provide a basis for analyzing the state of permafrost degradation and contribute to understanding the links between permafrost degradation and the development of thermokarst lakes and ponds, as well as serve as basic data for the study of carbon emissions from thermokarst lakes and ponds in the plateau region.
表1 用于湖塘提取的数据使用情况Tab.1 Data sources for the identification of lakes and ponds |
| 研究时期 | 使用数据 | 数据用途 | 使用波段/属性 | 使用时段 | 空间分辨率 |
|---|---|---|---|---|---|
| 2020年代 | Landsat 8 | 影像分类 | B3(绿) B5(近红外) | 2020-01-01至 2022-12-31 | 30 m |
| Sentinel-2 | 影像分类 | B3(绿) B8(近红外) | 2020-01-01至 2022-12-31 | 10 m格网 (重采样到30 m) | |
| 全球水体数据 | 训练集与测试集 | 最大水体范围 | 1984—2022年 | 30 m | |
| Sentinel-1 | 辅助分类 | VV | 2020—2022年6—8月 | 10 m格网 (重采样到30 m) | |
| 1960年代 | 锁眼卫星解译产品 | 对比分析 | 湖泊 | 1960年代 | 矢量数据 |
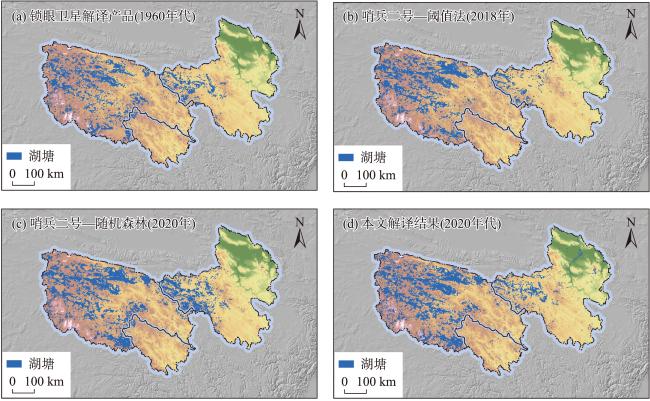
图3 4种解译产品的湖塘分布情况(< 1 km2)Fig.3 Distribution of lakes and ponds by the four products interpreted from remote sensing data (< 1 km2) |
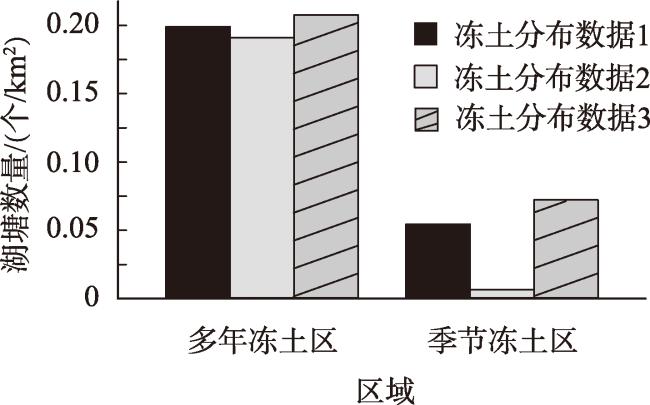
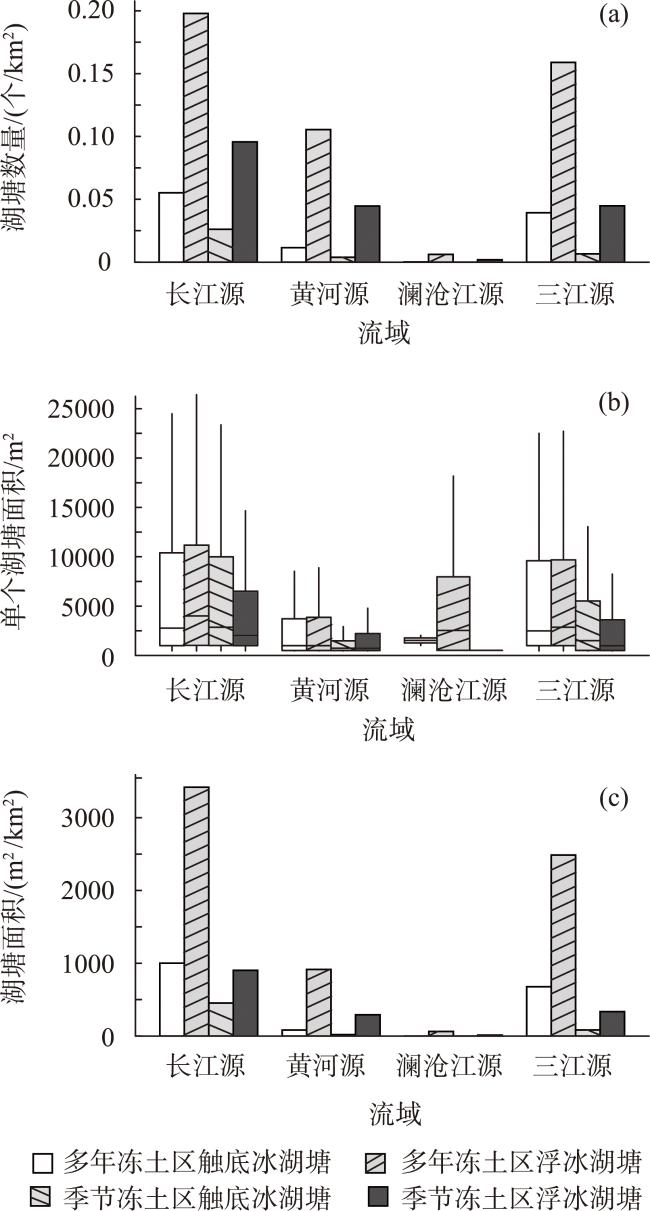
图6 多年冻土区与季节冻土区单位面积上湖塘数量对比Fig.6 Lake and pond density comparison between permafrost and seasonal frozen soil zones |
图11 不同多年冻土地温和多年冻土厚度下触底冰湖塘与浮冰湖塘数量分布情况Fig.11 Distribution of grounded-ice and floating-ice lakes and ponds under various permafrost ground temperatures and thicknesses |
表3 多年冻土区不同冻土地温和厚度下浮冰湖塘与触底冰湖塘数量比Tab.3 Ratio of the number of floating-ice and grounded-ice lakes and ponds under different permafrost ground temperatures and permafrost thicknesses |
| 使用数据 | 数据范围 | 数量比 |
|---|---|---|
| 冻土地温 | (-4, -3] ℃ | 12.0 |
| (-3, -2] ℃ | 5.3 | |
| (-2, -1] ℃ | 4.6 | |
| (-1, 0] ℃ | 4.0 | |
| (0, 1] ℃ | 5.9 | |
| >1 ℃ | 9.4 | |
| 冻土厚度 | (150, 215] m | 37.7 |
| (100, 150] m | 6.8 | |
| (80, 100] m | 8.7 | |
| (50, 80] m | 4.9 | |
| [25, 50] m | 4.4 | |
| <25 m | 3.3 |
| [1] |
陈春阳, 陶泽兴, 王焕炯, 等. 三江源地区草地生态系统服务价值评估[J]. 地理科学进展, 2012, 31(7): 978-984.
[
|
| [2] |
孟宪红, 陈昊, 李照国, 等. 三江源区气候变化及其环境影响研究综述[J]. 高原气象, 2020, 39(6): 1133-1143.
[
|
| [3] |
于伯华, 吕昌河, 吕婷婷, 等. 青藏高原植被覆盖变化的地域分异特征[J]. 地理科学进展, 2009, 28(3): 391-397.
[
|
| [4] |
丁俊霞, 陈克龙. 三江源生物多样性保护重要性研究[J]. 青海草业, 2020, 29(1): 20-26.
[
|
| [5] |
牛亚菲. 青藏高原生态环境问题研究[J]. 地理科学进展, 1999, 18(2): 163-171.
[
|
| [6] |
|
| [7] |
牛富俊, 王玮, 林战举, 等. 青藏高原多年冻土区热喀斯特湖环境及水文学效应研究[J]. 地球科学进展, 2018, 33(4): 335-342.
[
|
| [8] |
金岩丽, 徐茂林, 高帅, 等. 2001—2018年三江源地表水动态变化及驱动力分析[J]. 遥感技术与应用, 2021, 36(5): 1147-1154.
[
|
| [9] |
|
| [10] |
|
| [11] |
|
| [12] |
张国庆. 青藏高原湖泊变化遥感监测及其对气候变化的响应研究进展[J]. 地理科学进展, 2018, 37(2): 214-223.
[
|
| [13] |
|
| [14] |
陈瑞达. 青藏高原北麓河流域热融湖塘提取与时空演变分析[D]. 北京: 中国地质大学(北京), 2020.
[
|
| [15] |
|
| [16] |
王慧妮. 基于遥感的青藏高原热融湖塘时空演化监测与趋势分析: 以青藏铁路红梁河至风火山沿线为例[D]. 西安: 长安大学, 2013.
[
|
| [17] |
罗京, 牛富俊, 林战举, 等. 1969—2010年青藏高原北麓河盆地热喀斯特湖塘演化过程[J]. 科学通报, 2015, 60(9): 556-564.
[
|
| [18] |
|
| [19] |
|
| [20] |
|
| [21] |
|
| [22] |
|
| [23] |
罗斯琼, 李红梅, 马迪, 等. 三江源冻土—植被相互作用及气候效应研究现状及展望[J]. 高原气象, 2022, 41(2): 255-267.
[
|
| [24] |
|
| [25] |
牟翠翠. 热喀斯特改变多年冻土区景观和地表过程[J]. 自然杂志, 2020, 42(5): 386-392.
[
|
| [26] |
|
| [27] |
|
| [28] |
|
| [29] |
|
| [30] |
|
| [31] |
|
| [32] |
|
| [33] |
|
| [34] |
|
| [35] |
|
| [36] |
|
| [37] |
|
| [38] |
全国地理信息资源目录服务系统. 三江源1∶100万行政边界数据(2017)[DB]. 北京: 国家青藏高原科学数据中心, 2018.
[National Catalogue Service for Geographic Information. Administrative boundaries data at 1∶1000000 in the Sanjiangyuan region (2017). Beijing, China: National Tibetan Plateau / Third Pole Environment Data Center. 2018.]
|
| [39] |
宋辞, 裴韬, 周成虎. 1960年以来青藏高原气温变化研究进展[J]. 地理科学进展, 2012, 31(11): 1503-1509.
[
|
| [40] |
张人禾, 苏凤阁, 江志红, 等. 青藏高原21世纪气候和环境变化预估研究进展[J]. 科学通报, 2015, 60(32): 3036-3047.
[
|
| [41] |
|
| [42] |
[
|
| [43] |
[
|
| [44] |
|
| [45] |
龙笛, 李雪莹, 李兴东, 等. 遥感反演2000—2020年青藏高原水储量变化及其驱动机制[J]. 水科学进展, 2022, 33(3): 375-389.
[
|
| [46] |
|
| [47] |
陈旭. 青藏高原热融湖塘分布及其区域变化特征[D] 兰州: 兰州大学, 2021.
[
|
| [48] |
|
| [49] |
|
| [50] |
|
| [51] |
|
| [52] |
|
| [53] |
|
| [54] |
|
| [55] |
[
|
| [56] |
|
| [57] |
程国栋, 赵林, 李韧, 等. 青藏高原多年冻土特征、变化及影响[J]. 科学通报, 2019, 64(27): 2783-2795.
[
|
| [58] |
冉有华, 李新, 程国栋, 等. 2005—2015年青藏高原多年冻土稳定性制图[J]. 中国科学: 地球科学, 2021, 51(2): 183-200.
[
|
| [59] |
|
| [60] |
|
| [61] |
|
/
| 〈 |
|
〉 |
