
基于三维生态足迹的长江经济带生态安全动态评价
|
徐秋怡(2000— ),女,云南蒙自人,硕士生,主要研究方向为生态环境与区域可持续发展。E-mail: xuqiuyi111@163.com |
收稿日期: 2023-09-11
修回日期: 2024-02-23
网络出版日期: 2024-06-21
基金资助
国家自然科学基金项目(41901145)
中央高校基本科研业务费专项资金项目(SWU2209225)
Dynamic assessment of ecological security in the Yangtze River Economic Belt based on three-dimensional ecological footprint
Received date: 2023-09-11
Revised date: 2024-02-23
Online published: 2024-06-21
Supported by
National Natural Science Foundation of China(41901145)
the Fundamental Research Funds for the Central Universities(SWU2209225)
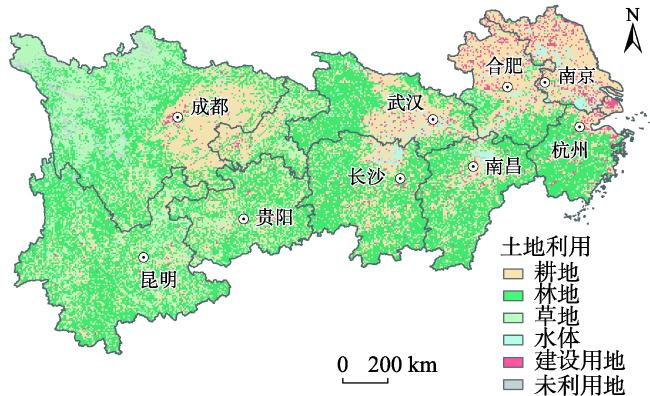
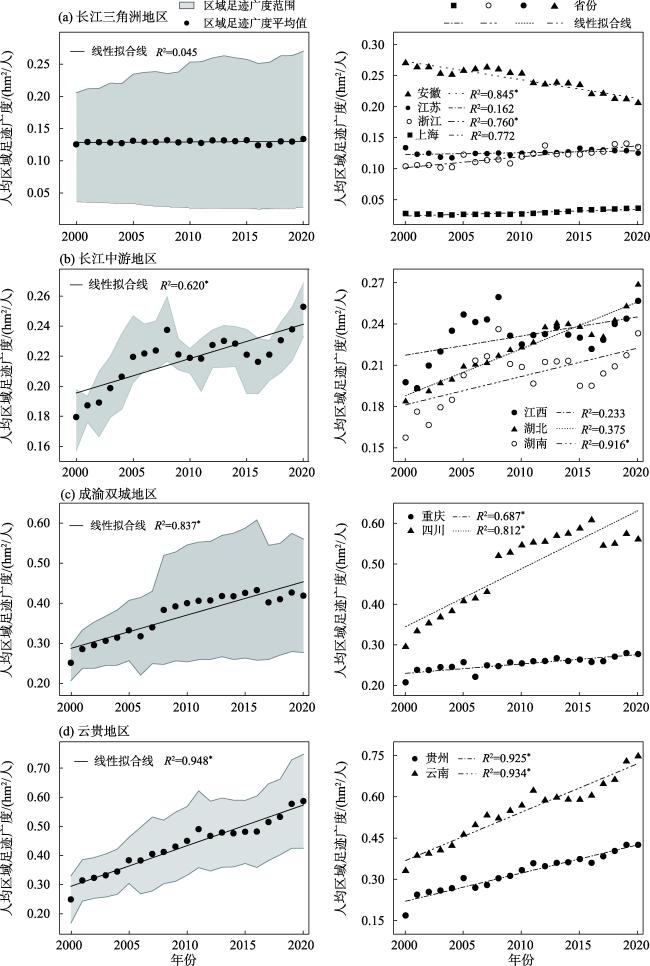
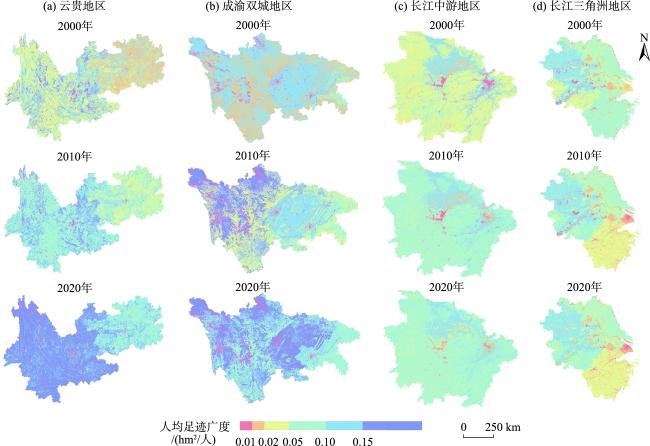
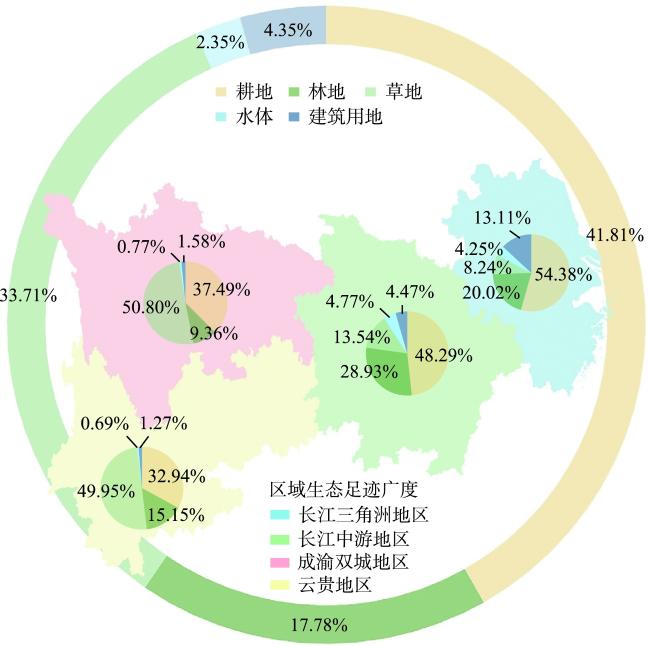
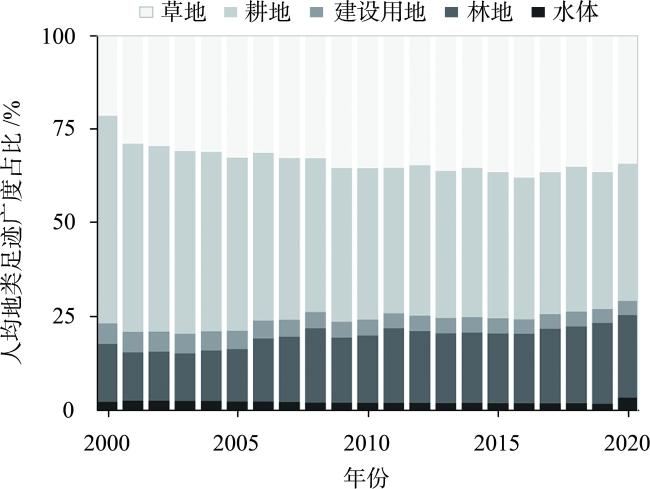
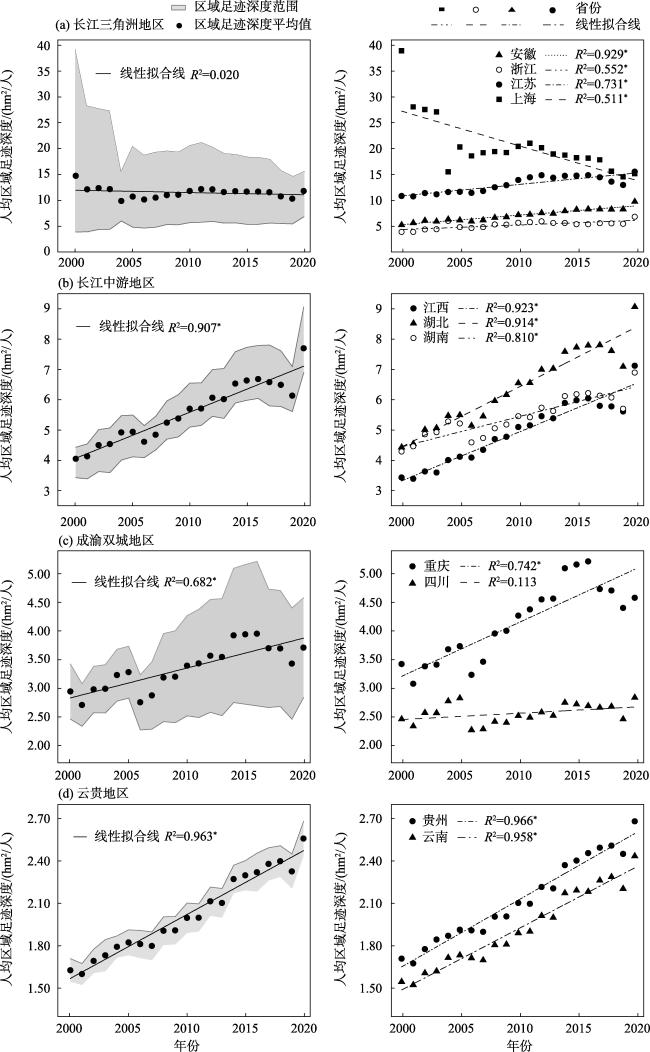
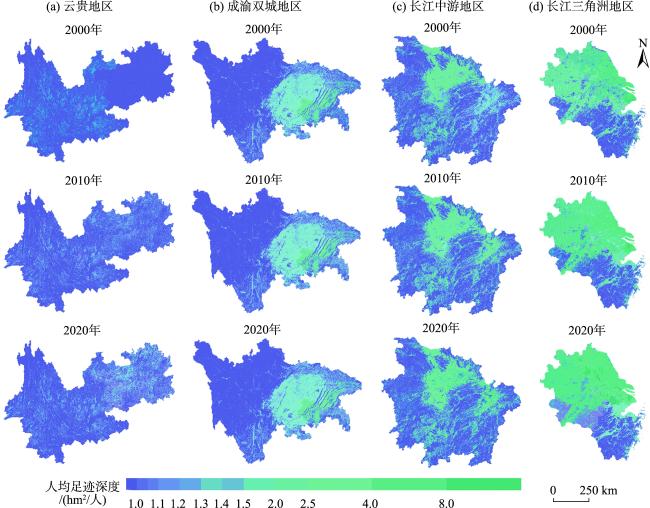
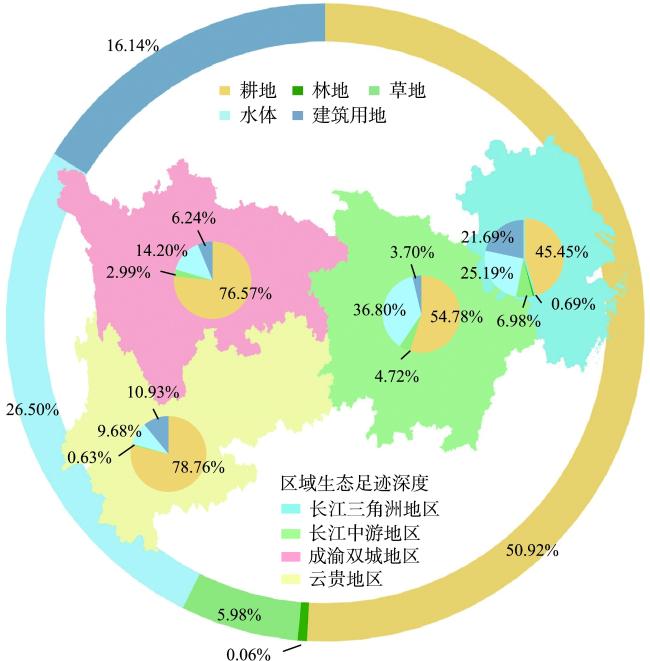
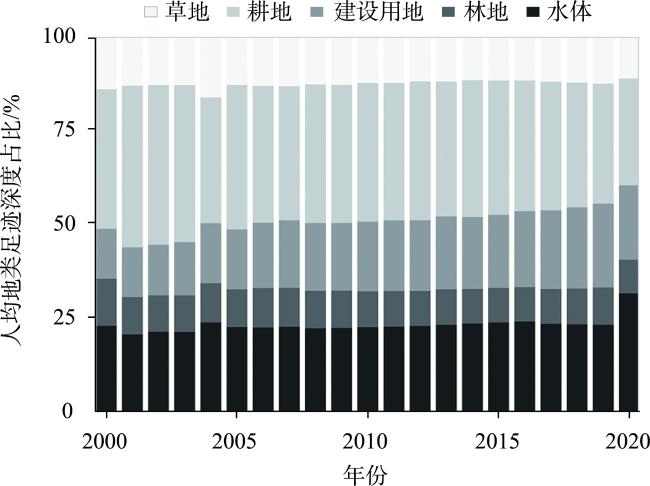
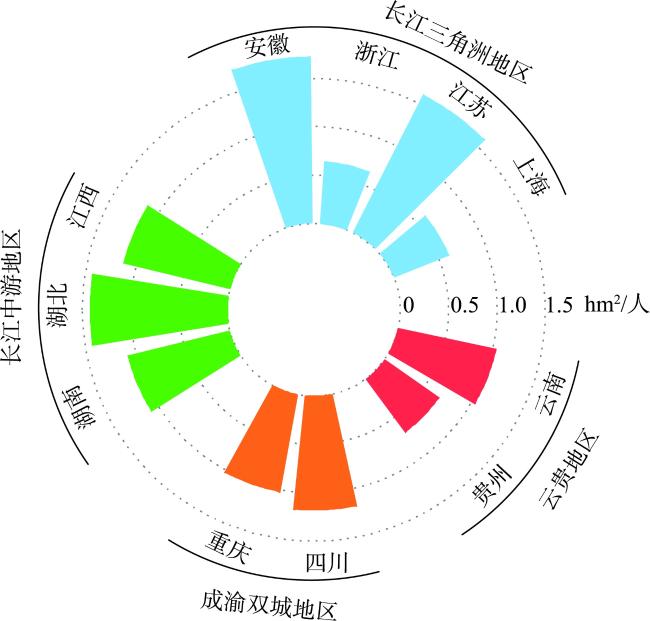
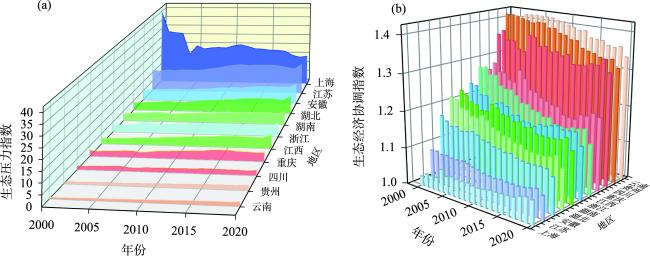
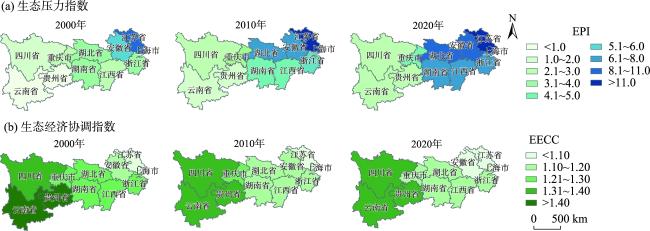
长江经济带是新时代中国重大战略发展区域之一,其生态建设对长江流域的社会经济发展和生态屏障建设起着重要作用,开展生态安全动态评价十分重要。论文选取多源数据,采用改进的三维生态足迹模型,模拟2000—2020年长江经济带的足迹深度、足迹广度以及三维生态足迹,而后进一步构建生态压力指数、生态经济协调指数、流量资本占用率和存量资本流量利用比等指标量化生态安全变化,最后利用偏最小二乘回归分析法研究了三维生态足迹的驱动要素。结果表明:① 在时间上,研究期间长江经济带足迹广度呈上升趋势但整体利用水平不高,足迹深度较大且表现出明显上升趋势(长江三角洲除外),通过消耗资本存量来满足自然资源需求;在空间上,地类足迹广度呈“西高东低”格局,足迹深度则相反;在地类组分构成上,足迹广度、足迹深度各地类占比不平衡,耕地对足迹广度、足迹深度的贡献率最大,林地生态可持续性较好。② 长江经济带各地区生态安全状况差异较大。长江三角洲地区过度消耗存量资本,生态安全形势严峻。长江中游、成渝双城地区生态环境相对安全,但生态环境与经济发展可能存在逐渐失衡的趋势。云贵地区自然禀赋优越,生态安全状况较好。③ 驱动力分析表明,能源消耗、经济发展、城市扩张是导致区域生态资本占用增加的重要因素,而科技水平、生态建设在目前阶段对自然资源利用的影响程度较小。研究为长江经济带各地区生态 环境保护与经济、城市建设协调发展提供了理论依据和实践指引,可为长江经济带整体发展规划提供参考,助力区域社会、经济与生态环境的协调发展。
徐秋怡 , 颜凤芹 , 丁智 , 汤旭光 , 姚丽 . 基于三维生态足迹的长江经济带生态安全动态评价[J]. 地理科学进展, 2024 , 43(6) : 1184 -1202 . DOI: 10.18306/dlkxjz.2024.06.011
The Yangtze River Economic Belt (YREB) is one of the key strategic development regions in China in the new era. Its ecological construction plays a pivotal role in the socioeconomic development and ecological barrier construction of the Yangtze River Basin, therefore it is very important to carry out dynamic ecological security assessment. This study used an improved three-dimensional footprint model to calculate the footprint depth, footprint size, and 3D ecological footprint of the YREB from 2000 to 2020, and constructed the ecological pressure index, ecological and economic coordination coefficient, occupancy rate of capital flows, and use ratio of stock-flows to quantify the ecological security changes. Finally, partial least squares regression was used to analyze the driving factors of the 3D ecological footprint, in order to understand the ecological security status of the YREB in the process of rapid urbanization, and to promote the coordinated development of the region. The results show that: 1) Temporally, the footprint size of the YREB showed an increasing trend during the study period, but the overall utilization level was not high. The footprint depth was large and showed an obvious increasing trend (except for the Yangtze River Delta), which met the demand for natural resources by consuming capital stock. Spatially, the land use type footprint size was high in the west and low in the east, while the footprint depth was the opposite. In terms of land use type contribution, the proportion of land use types in the footprint size and footprint depth was unbalanced. The contribution rate of cultivated land to the footprint size and depth was the largest, and the ecological sustainability of woodland was better than other land use types. 2) The natural and socioeconomic environments in different regions in the YREB are very different, and their ecological security situation also differs. The Yangtze River Delta area overconsumes the stock and the ecological pressure is huge. In the middle reaches of the Yangtze River and the Chengdu-Chongqing area, the ecological environment is relatively secure, but there is a trend of imbalance between the ecological environment and economic development. The upper reaches of the Yangtze River have excellent natural endowment and high ecological security. 3) Driving factor analysis showed that energy consumption, economic development, and urban expansion play a positive role in driving the three-dimensional ecological footprint, while science and technology development level and ecological construction have little impact on the utilization of natural resources at present. It is necessary to increase the investment in science and technology development, optimize the industrial structure, and promote the positive interaction between ecological environment protection and economic development.
表1 生态足迹模型核算体系Tab.1 Ecological footprint accounting system |
| 账户类型 | 土地利用类型 | 消费项目 |
|---|---|---|
| 生物资源账户 | 耕地 | 粮食、油料、棉花、麻类、烟叶、蔬菜、猪肉、瓜果类、糖类、禽蛋、禽肉 |
| 林地 | 水果、茶叶、木材、油茶籽 | |
| 草地 | 牛肉、羊肉、羊毛、羊绒、奶类 | |
| 水体 | 水产品 | |
| 化石能源账户 | 化石能源用地 | 原煤、焦炭、原油、柴油、汽油、燃料油、煤油、天然气 |
| 建设用地 | 电力 |
表2 生态压力指数等级划分Tab.2 Ecological pressure index classes |
| 生态压力指数EPI | <0.50 | 0.50~0.80 | 0.81~1.00 | 1.01~1.50 | 1.51~2.00 | >2.00 |
|---|---|---|---|---|---|---|
| 生态安全程度 | 很安全 | 较安全 | 轻度不安全 | 中度不安全 | 高度不安全 | 严重不安全 |
表3 三维生态足迹驱动因素Tab.3 Three-dimensional ecological footprint driving factors |
| 目标层 | 指标层 | 相应变量 | 单位 | 权重 |
|---|---|---|---|---|
| 城市发展 | 人口 | X1 | 万人 | 0.232 |
| 城市人口密度 | X2 | 人/km2 | 0.249 | |
| 城镇率 | X3 | % | 0.255 | |
| 公路里程 | X4 | 万km | 0.264 | |
| 经济发展 | GDP | X5 | 亿元 | 0.243 |
| 第一产业增加值 | X6 | 亿元 | 0.285 | |
| 第二产业增加值 | X7 | 亿元 | 0.243 | |
| 第三产业增加值 | X8 | 亿元 | 0.229 | |
| 社会消费 | 城市居民年度人均消费 | X9 | 元 | 0.524 |
| 农村居民年度人均消费 | X10 | 元 | 0.476 | |
| 对外贸易 | 出口总额 | X11 | 1000万美元 | 0.522 |
| 进口总额 | X12 | 1000万美元 | 0.478 | |
| 能源消耗 | 能源消费总量 | X13 | 万tce | 0.271 |
| 煤炭 | X14 | 万tce | 0.264 | |
| 石油 | X15 | 万tce | 0.235 | |
| 电力 | X16 | 万tce | 0.230 | |
| 生态环境 | 森林面积 | X17 | 万hm2 | 0.198 |
| 城市绿地 | X18 | 万hm2 | 0.200 | |
| 当年造林面积 | X19 | hm2 | 0.193 | |
| 水土流失治理面积 | X20 | 1000 hm2 | 0.221 | |
| 生活垃圾无害化能力 | X21 | t/d | 0.189 | |
| 科技水平 | 专利申请授权量 | X22 | 件 | 0.321 |
| 农业机械动力 | X23 | 万kWh | 0.679 | |
| 环境污染 | 废水排放 | X24 | 亿t | 0.342 |
| 二氧化硫 | X25 | 万t | 0.346 | |
| 固体粉尘 | X26 | 万t | 0.312 |
注:驱动指标数据来源于2000—2020年研究区域内各省市统计年鉴,2000—2005年的城镇率数据来自文献[45]。 |
表4 偏最小二乘回归模型结果Tab.4 Results of the partial least squares regression |
| 地区 | 常数项 | X1 | X2 | X3 | X4 | X5 | X6 | X7 | X8 | X9 | X10 | X11 | X12 | ||||||||||||||||
|---|---|---|---|---|---|---|---|---|---|---|---|---|---|---|---|---|---|---|---|---|---|---|---|---|---|---|---|---|---|
| 长江三角洲 地区 | 系数 | 1.922 | 0.059** | 0.050** | -0.043 | 0.147*** | 0.012 | 0.131*** | -0.001 | 0.010 | -0.067*** | -0.067*** | -0.126*** | -0.058* | |||||||||||||||
| VIP | 1.246 | 0.725 | 1.039 | 1.415 | 0.675 | 1.314 | 0.746 | 0.596 | 0.827 | 0.827 | 0.758 | 0.669 | |||||||||||||||||
| 长江中游地区 | 系数 | 3.484 | -0.058** | 0.017 | 0.092*** | 0.067*** | 0.045*** | -0.035 | 0.054*** | -0.043* | 0.015* | 0.015* | 0.060*** | 0.089*** | |||||||||||||||
| VIP | 0.518 | 0.491 | 1.215 | 1.084 | 1.103 | 0.846 | 1.127 | 0.921 | 1.060 | 1.060 | 1.062 | 1.212 | |||||||||||||||||
| 成渝双城地区 | 系数 | 4.253 | -0.215* | -0.279* | 0.275*** | 0.002 | 0 | 0.023 | 0.179*** | -0.141* | 0.125 | 0.125 | 0.156 | -0.131 | |||||||||||||||
| VIP | 0.664 | 1.113 | 0.851 | 1.076 | 1.094 | 1.023 | 1.145 | 1.078 | 1.051 | 1.051 | 1.059 | 1.073 | |||||||||||||||||
| 云贵地区 | 系数 | 2.482 | 0.091*** | 0.040*** | 0.024*** | 0.068*** | 0.048*** | 0.048*** | 0.048*** | 0.047*** | 0.028*** | 0.028*** | 0.071*** | 0.086*** | |||||||||||||||
| VIP | 0.938 | 0.674 | 1.020 | 1.097 | 1.122 | 1.118 | 1.131 | 1.111 | 1.041 | 1.041 | 1.103 | 1.124 | |||||||||||||||||
| 地区 | X13 | X14 | X15 | X16 | X17 | X18 | X19 | X20 | X21 | X22 | X23 | X24 | X25 | X26 | |||||||||||||||
| 长江三角 洲地区 | 系数 | -0.030** | 0.073*** | -0.035* | -0.039*** | -0.163*** | 0.034** | 0.100*** | -0.124*** | -0.057*** | -0.004 | 0.211*** | 0.200*** | -0.053 | 0.223*** | ||||||||||||||
| VIP | 0.765 | 1.220 | 0.628 | 0.740 | 0.941 | 0.775 | 0.935 | 0.867 | 0.710 | 0.657 | 1.672 | 1.544 | 0.686 | 1.626 | |||||||||||||||
| 长江中游 地区 | 系数 | 0.061*** | 0.063* | 0.068*** | 0.071*** | -0.121*** | 0.121*** | -0.081** | 0.163*** | 0.049* | 0.071 | -0.029 | -0.016 | -0.005 | 0.080*** | ||||||||||||||
| VIP | 0.983 | 0.891 | 1.067 | 1.169 | 0.875 | 1.287 | 0.985 | 1.342 | 1.035 | 1.087 | 0.822 | 0.602 | 0.668 | 0.861 | |||||||||||||||
| 成渝双城 地区 | 系数 | 0.188*** | 0.446*** | 0.225*** | 0.033 | -0.120 | -0.019 | 0.056 | -0.001 | -0.167 | 0.146 | 0.165** | 0.209 | 0.034 | -0.039 | ||||||||||||||
| VIP | 1.055 | 1.213 | 1.072 | 1.065 | 0.652 | 1.045 | 0.722 | 0.940 | 1.065 | 1.095 | 0.985 | 0.848 | 0.775 | 0.911 | |||||||||||||||
| 云贵地区 | 系数 | 0.043*** | -0.030* | 0.031*** | 0.043*** | 0.089*** | -0.005 | 0.027 | 0.057*** | 0.032** | 0.018 | 0.056*** | 0.050** | -0.048*** | 0.063*** | ||||||||||||||
| VIP | 1.052 | 0.455 | 1.052 | 1.097 | 0.917 | 0.809 | 0.506 | 1.157 | 0.982 | 0.905 | 1.077 | 1.062 | 0.841 | 1.122 | |||||||||||||||
注:*、**、***分别表示系数在10%、5%、1%水平上显著;VIP为变量投影重要性。 |
| [1] |
|
| [2] |
徐小鹰, 田焮焮. 长三角城市群科技创新、经济增长与生态环境的时空耦合及趋势预测[J]. 长江流域资源与环境, 2023, 32(4): 706-720.
[
|
| [3] |
张国俊, 王珏晗, 吴坤津, 等. 中国三大城市群经济与环境协调度时空特征及影响因素[J]. 地理研究, 2020, 39(2): 272-288.
[
|
| [4] |
马丽, 金凤君, 刘毅. 中国经济与环境污染耦合度格局及工业结构解析[J]. 地理学报, 2012, 67(10): 1299-1307.
[
|
| [5] |
王长征, 刘毅. 经济与环境协调研究进展[J]. 地理科学进展, 2002, 21(1): 58-65.
[
|
| [6] |
|
| [7] |
|
| [8] |
|
| [9] |
|
| [10] |
|
| [11] |
王涛, 邵田田, 李登辉, 等. 基于净初级生产力生态足迹的河南省生态安全诊断[J]. 遥感信息, 2020, 35(4): 133-140.
[
|
| [12] |
陆大道. 长江大保护与长江经济带的可持续发展: 关于落实习总书记重要指示, 实现长江经济带可持续发展的认识与建议[J]. 地理学报, 2018, 73(10): 1829-1836.
[
|
| [13] |
杨荣金, 孙美莹, 张乐, 等. 长江经济带生态环境保护的若干战略问题[J]. 环境科学研究, 2020, 33(8): 1795-1804.
[
|
| [14] |
陈星, 周成虎. 生态安全: 国内外研究综述[J]. 地理科学进展, 2005, 24(6): 8-20.
[
|
| [15] |
肖笃宁, 陈文波, 郭福良. 论生态安全的基本概念和研究内容[J]. 应用生态学报, 2002, 13(3): 354-358.
[
|
| [16] |
程钰, 尹建中, 王建事. 黄河三角洲地区自然资本动态演变与影响因素研究[J]. 中国人口·资源与环境, 2019, 29(4): 127-136.
[
|
| [17] |
林文豪, 温兆飞, 吴胜军, 等. 成渝地区双城经济圈生态安全格局识别及改善对策[J]. 生态学报, 2023, 43(3): 973-985.
[
|
| [18] |
马世五, 谢德体, 张孝成, 等. 三峡库区生态敏感区土地生态安全预警测度与时空演变: 以重庆市万州区为例[J]. 生态学报, 2017, 37(24): 8227-8240.
[
|
| [19] |
王争磊, 刘海龙, 丁娅楠, 等. 山西省生态安全时空演变特征及影响因素[J]. 生态学报, 2022, 42(18): 7470-7483.
[
|
| [20] |
赵宾华, 黄金华, 李占斌, 等. 基于AHP-熵值法组合赋权的甘肃省城市生态用水安全综合评价及影响因素分析[J]. 水土保持通报, 2023, 43(1): 167-173, 213.
[
|
| [21] |
王丽娜, 李爽, 吴迪, 等. 景感生态学: 生态安全研究与实践的重要途径[J]. 生态学报, 2020, 40(22): 8028-8033.
[
|
| [22] |
鲁钰, 赵银娣, 董霁红. 西北地区三维生态足迹生态安全评价及驱动力分析[J]. 生态学报, 2022, 42(4): 1354-1367.
[
|
| [23] |
|
| [24] |
|
| [25] |
|
| [26] |
|
| [27] |
|
| [28] |
|
| [29] |
|
| [30] |
方恺. 生态足迹深度和广度: 构建三维模型的新指标[J]. 生态学报, 2013, 33(1): 267-274.
[
|
| [31] |
方恺, Heijungs R. 自然资本核算的生态足迹三维模型研究进展[J]. 地理科学进展, 2012, 31(12): 1700-1707.
[
|
| [32] |
张亚丽, 胡希军, 尹伟特, 等. 环长株潭次级城市群生态足迹变化与经济脱钩研究[J]. 生态科学, 2023, 42(2): 26-34.
[
|
| [33] |
|
| [34] |
方恺. 基于改进生态足迹三维模型的自然资本利用特征分析: 选取11个国家为数据源[J]. 生态学报, 2015, 35(11): 3766-3777.
[
|
| [35] |
|
| [36] |
董建红, 张志斌, 张怀林, 等. 生态脆弱区自然资本可持续利用及驱动机制: 以宁夏为例[J]. 中国人口·资源与环境, 2021, 31(2): 162-173.
[
|
| [37] |
杜悦悦, 彭建, 高阳, 等. 基于三维生态足迹的京津冀城市群自然资本可持续利用分析[J]. 地理科学进展, 2016, 35(10): 1186-1196.
[
|
| [38] |
张星星, 曾辉. 珠江三角洲城市群三维生态足迹动态变化及驱动力分析[J]. 环境科学学报, 2017, 37(2): 771-778.
[
|
| [39] |
胡美娟, 周年兴, 李在军, 等. 南京市三维生态足迹测算及驱动因子[J]. 地理与地理信息科学, 2015, 31(1): 91-95.
[
|
| [40] |
刘伟. 长江经济带区域经济差异分析[J]. 长江流域资源与环境, 2006, 15(2): 131-135.
[
|
| [41] |
金贵, 邓祥征, 赵晓东, 等. 2005—2014年长江经济带城市土地利用效率时空格局特征[J]. 地理学报, 2018, 73(7): 1242-1252.
[
|
| [42] |
方创琳, 周成虎, 王振波. 长江经济带城市群可持续发展战略问题与分级梯度发展重点[J]. 地理科学进展, 2015, 34(11): 1398-1408.
[
|
| [43] |
|
| [44] |
|
| [45] |
林坚. 2000年以来人口城镇化水平变动省际差异分析: 基于统计数据的校正和修补[J]. 城市规划, 2010, 34(3): 48-56.
[
|
| [46] |
|
| [47] |
|
| [48] |
杨一旸, 卢宏玮, 梁东哲, 等. 基于三维生态足迹模型的长江中游城市群平衡性分析与生态补偿研究[J]. 生态学报, 2020, 40(24): 9011-9022.
[
|
| [49] |
方晓娟, 陶强强, 马招弟. 长江经济带自然资本可持续性利用分析: 基于三维生态足迹模型[J]. 环境生态学, 2021, 3(5): 32-37.
[
|
| [50] |
陈义忠, 乔友凤, 郝灿, 等. 长江中游城市群生态足迹指标与社会经济发展的适配性[J]. 资源科学, 2022, 44(10): 2137-2152.
[
|
| [51] |
官冬杰, 姜亚楠, 严聆云, 等. 基于生态足迹视角的长江流域生态补偿额度测算[J]. 生态学报, 2022, 42(20): 8169-8183.
[
|
| [52] |
柳清瑞, 唐璐. 城镇化对能源消费的推拉效应及其影响因素: 基于门槛效应模型的实证检验[J]. 资源科学, 2022, 44(5): 1022-1035.
[
|
/
| 〈 |
|
〉 |