
CMIP6组合情景下中国未来人口空间均衡分布研究
|
何湘琦(1998— ),女,浙江东阳人,硕士生,研究方向为人口地理。E-mail: 13516929148@163.com |
收稿日期: 2023-10-17
修回日期: 2024-02-22
网络出版日期: 2024-06-21
基金资助
国家社会科学基金重大项目(18ZDA132)
Future population spatial equilibrium distribution of China under CMIP6 scenarios
Received date: 2023-10-17
Revised date: 2024-02-22
Online published: 2024-06-21
Supported by
Major Program of National Social Science Foundation of China(18ZDA132)
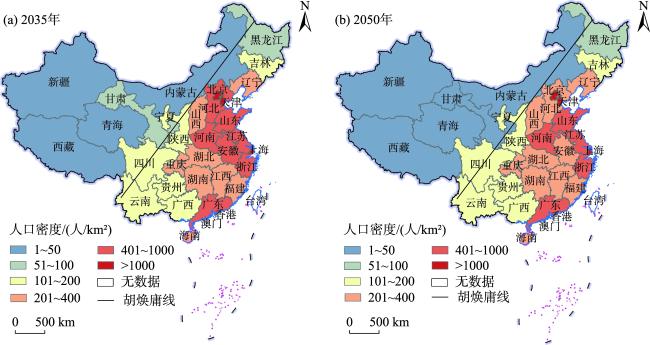
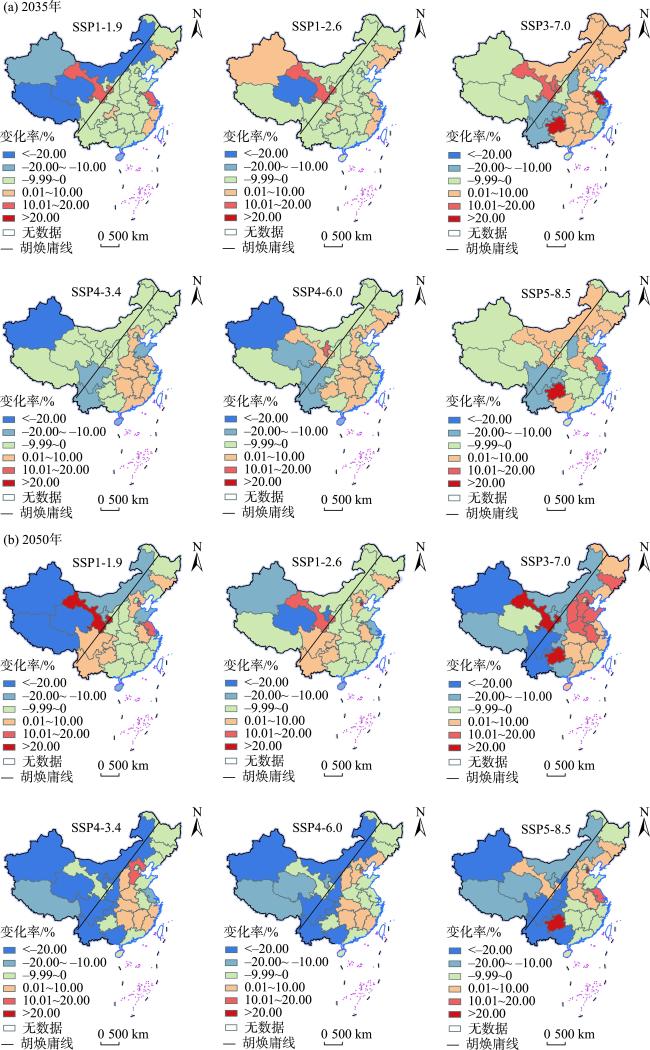
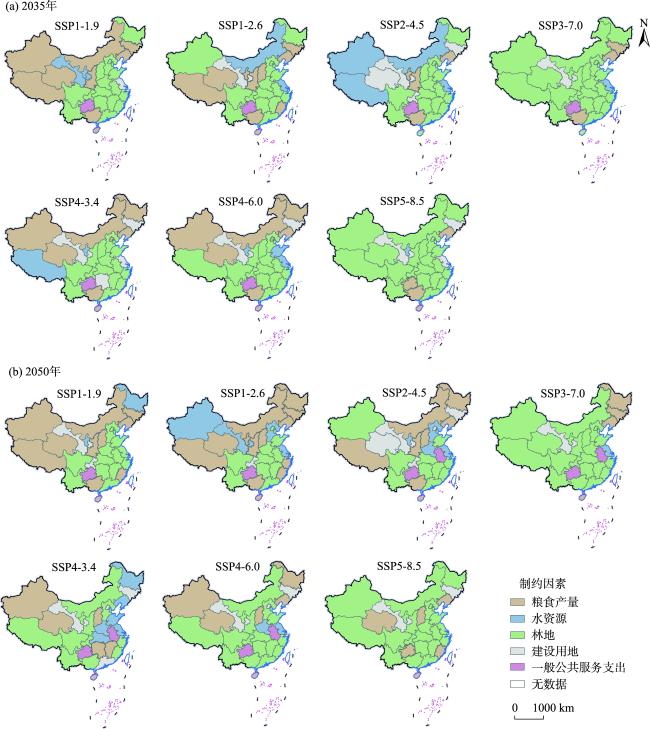
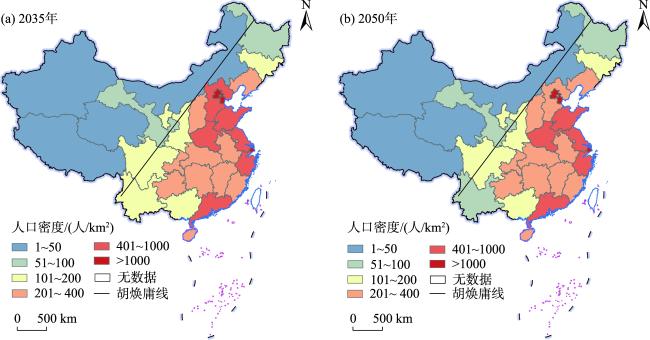
人口空间均衡作为人口均衡在空间上的表现,对实现区域高质量发展具有重要意义,而作为当前全球面临的重大挑战,气候变化及其应对的政策路径将深刻影响未来世界的社会、经济和环境,进而改变中国的人口空间均衡分布格局。论文基于CMIP6中7个典型情景,将气候变化视角纳入人口空间均衡分布研究,基于“可能—满意度”模型提出了“等可能—满意度”的人口空间均衡概念,构建了多区域计算模型。在模型的基础上,论文对气候变化及应对气候变化的社会经济发展路径下,2035年和2050年中国分省人口空间均衡分布格局及其影响因素进行研究,结果显示:① 达到人口空间均衡时,可能—满意度最高的情景是SSP1-1.9和SSP1-2.6,表明可持续发展路径最符合中国高质量发展的需求;最低的是SSP3-7.0,表明激烈的区域竞争将以低质量发展为代价。② 受单因素制约时,相较于2020年真实的人口分布,SSP2-4.5情景2035年和2050年在人口空间均衡状态下东部地区和西部地区人口占比下降,中部地区和东北地区人口占比相对上升。与SSP2-4.5相比,其他情景的均衡人口分布呈现东升西降的趋势,此时粮食、林地和水资源等自然资源是形塑人口空间均衡分布格局的核心。③ 而在多因素综合模式下,SSP2-4.5情景在2035年和2050年达到均衡状态时,中西部地区资源优势被削弱,人口较2020年有所下降。相对单因素制约状态,多因素模式下整体的均衡人口分布格局进一步向东倾斜。其余情景人口分布相较于SSP2-4.5变化较小。④ 在所有情景下,胡焕庸线两侧的人口占比均不会发生大幅度变化,表明未来的气候变化及应对气候变化的社会经济发展路径并不影响胡焕庸线对中国人口地理的基本分界意义。研究结果可为中国未来积极应对气候变化、实现区域协调的高质量发展提供政策依据。
何湘琦 , 顾高翔 , 黄心妍 . CMIP6组合情景下中国未来人口空间均衡分布研究[J]. 地理科学进展, 2024 , 43(6) : 1167 -1183 . DOI: 10.18306/dlkxjz.2024.06.010
As a spatial representation of population equilibrium, population spatial equilibrium is of great significance to the realization of high-quality development goal. As a major challenge in the world, climate change and the policy pathways to deal with it will profoundly affect the society, economy and environment of the world in the future, and then change the pattern of population spatial equilibrium distribution in China. This study examined the impact of climate change on population spatial equilibrium distribution based on seven typical scenarios in the CMIP6. The concept of "equal possibility-satisfiability" population spatial equilibrium distribution was proposed according to the possibility-satisfiability model, and a multi-region computational model was developed. Based on this model, this study explored the spatial equilibrium distribution pattern of China's population by province in 2035 and 2050 and its constraints under the pathways of climate change and social and economic development in response to climate change. The results show that scenarios with the highest possibility-satisfiability values are SSP1-1.9 and SSP1-2.6, indicating that sustainable development best serves the needs of high-quality population development of China in the future. Conversely, the lowest possibility-satisfiability value is found under SSP3-7.0, suggesting that human development may not be sustainable in the face of the twin challenges of economic growth and climate change, and the fierce inter-regional competition will reduce the quality of development. With the single-factor constraint, in reaching spatial equilibrium distribution of population under SSP2-4.5, compared with the provincial population distribution of China in 2020, the equilibrium population proportions in the northeastern and central provinces increase the most, with relative decrease in the eastern and western provinces. The equilibrium population distributions under the other scenarios demonstrate an increasing trend in the east and a decreasing trend in the west when compared with SSP2-4.5. Notably, natural resources such as grain, forestland, and water resources play a central role in shaping population spatial equilibrium distribution. In contrast, using the multi-factor model, the equilibrium population distributions of the central and western provinces are projected to decrease compared to 2020 due to their decreased natural resource advantages while factors can be substituted by others. The gross equilibrium population distribution further inclines toward the southeast coast. The equilibrium population distributions under the other scenarios are similar to that under SSP2-4.5. Importantly, all scenarios suggest that when population spatial equilibrium distribution is achieved, the population spatial distribution pattern of China delineated by the Hu Line remains unchanged. This indicates that future climate change and the pathways of social and economic development in response to climate change will not alter the significance of the Hu Line for China's population geography. This study can provide policy basis for China to actively respond to climate change in the future and achieve high-quality regional coordinated development.
表1 可能—满意度指标体系Tab. 1 Possibility-satisfiability indicator system |
| 指标类型 | 可能性指标 | 满意性指标 |
|---|---|---|
| 自然 资源 | 粮食产量(t) | 人均粮食产量(kg/人) |
| 水资源(m3) | 人均水资源占有量(m3/人) | |
| 林地(hm2) | 人均林地占有量(hm2/人) | |
| 建设用地(hm2) | 人均建设用地占有量(hm2/人) | |
| 社会经济资源 | GDP(元) | 人均GDP(元/人) |
| 可支配收入(元) | 人均可支配收入(元/人) | |
| 一般公共服务支出(元) | 人均公共服务支出(元/人) |
表2 各指标可能度和满意度上下限取值方法Tab.2 Methods for assigning values of the upper and lower limits of the P-S indicators |
| 指标 | 可能性指标 | 满意性指标 | |||
|---|---|---|---|---|---|
| 上限 | 下限 | 上限 | 下限 | ||
| 粮食产量 | 通过CMIP6数据中气温和降水变化率计算农业生产潜力变化后的最大值 | 通过CMIP6数据中气温和降水变化率计算农业生产潜力变化后的最小值 | 根据各省粮食产量禀赋设定目标 | 2020年人均粮食产量 | |
| 水资源 | 通过CMIP6数据中降水变化率最大值得出 | 通过CMIP6数据中降水变化率最小值计算得出 | 根据各省水资源禀赋设定目标 | 2020年人均水资源占有量 | |
| 林地 | SSP预测数据中的最大值 | SSP预测数据中的最小值 | 根据OECD国家设定目标 | 2020年人均林地面积 | |
| 建设用地 | SSP预测数据中的最大值 | SSP预测数据中的最小值 | 根据OECD国家设定目标 | 2020年人均建设用地面积 | |
| GDP | SSP预测数据中的最大值 | SSP预测数据中的最小值 | 根据中国自主设定的2035年和2050年目标设定 | 2020年人均GDP | |
| 可支配收入 | SSP预测数据中的最大值 | SSP预测数据中的最小值 | 根据OECD国家设定目标 | 2020年人均可支配收入 | |
| 一般公共服务支出 | SSP预测数据中的最大值 | SSP预测数据中的最小值 | 根据OECD国家设定目标 | 2020年人均公共服务支出 | |
表3 CMIP6中13个全球气候模式的基本信息Tab.3 Basic information of 13 CMIP6 models |
| 模式名称 | 国家 | 大气模式分辨率 |
|---|---|---|
| ACCESS-CM2 | 澳大利亚 | 1.9°×1.3° |
| ACCESS-ESM1-5 | 澳大利亚 | 1.9°×1.3° |
| AWI-CM-1-1-MR | 澳大利亚 | 1.9°×1.3° |
| BCC-CSM2-MR | 中国 | 1.1°×1.1° |
| CanESM5 | 加拿大 | 2.8°×2.8° |
| EC-Earth3 | 英国 | 0.7°×0.7° |
| EC-Earth3-Veg | 英国 | 0.7°×0.7° |
| FGOALS-g3 | 中国 | 2.0°×2.3° |
| GFDL-ESM4 | 美国 | 1.0°×1.0° |
| INM-CM4-8 | 俄罗斯 | 2.0°×1.5° |
| INM-CM5-0 | 俄罗斯 | 2.0°×1.5° |
| MPI-ESM1-2-HR | 德国 | 0.9°×0.9° |
| MPI-ESM1-2-LR | 德国 | 1.9°×1.9° |
表4 SSP情景下2035年和2050年中国人口总量以及生育、死亡假设Tab.4 Population, fertility, and death assumptions of China in 2035 and 2050 under different SSP scenarios |
| 情景 | 2035年 | 2050年 | |||||
|---|---|---|---|---|---|---|---|
| 总人口/亿人 | 总和生育率 | 平均预期寿命/岁 | 总人口/亿人 | 总和生育率 | 平均预期寿命/岁 | ||
| SSP1 | 13.390 | 1.06 | 83.5 | 12.245 | 1.01 | 89.2 | |
| SSP2 | 13.653 | 1.40 | 80.1 | 12.631 | 1.40 | 84.2 | |
| SSP3 | 13.888 | 1.78 | 79.1 | 13.075 | 1.93 | 80.8 | |
| SSP4 | 13.234 | 1.12 | 81.3 | 11.835 | 1.09 | 84.9 | |
| SSP5 | 13.387 | 1.06 | 83.5 | 12.245 | 1.01 | 89.2 | |
表5 7种情景下人口达到空间均衡分布的可能—满意度(P-S)值Tab.5 P-S values in reaching spatial equilibrium distribution of population under seven scenarios |
| 情景 | 单因素制约 | 多因素综合模式 | |||
|---|---|---|---|---|---|
| 2035年 | 2050年 | 2035年 | 2050年 | ||
| SSP1-1.9 | 0.241 | 0.382 | 0.624 | 0.719 | |
| SSP1-2.6 | 0.259 | 0.364 | 0.595 | 0.691 | |
| SSP2-4.5 | 0.144 | 0.249 | 0.446 | 0.506 | |
| SSP3-7.0 | 0.026 | 0.083 | 0.330 | 0.318 | |
| SSP4-3.4 | 0.184 | 0.273 | 0.473 | 0.539 | |
| SSP4-6.0 | 0.131 | 0.266 | 0.462 | 0.543 | |
| SSP5-8.5 | 0.128 | 0.242 | 0.653 | 0.775 | |
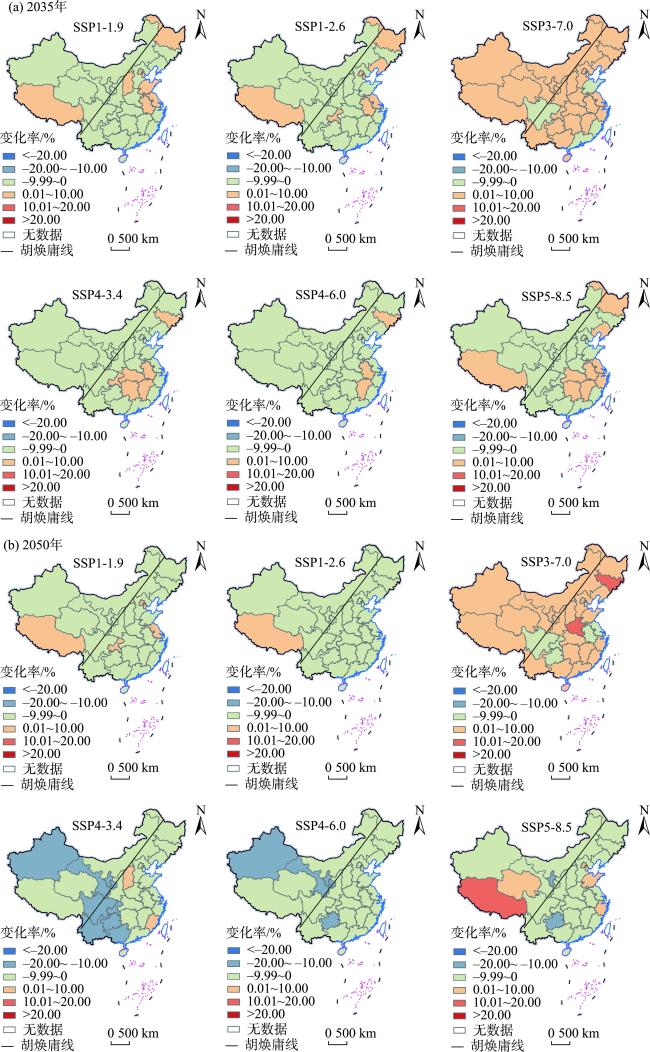
图2 单因素制约下各情景相较于SSP2-4.5的分省均衡人口变化率Fig.2 Changes in provincial equilibrium population distribution under different scenarios with single-factor constraint compared to SSP2-4.5 |
表6 多因素综合模式下各省份指标权重Tab.6 Indicator weights of each province with multi-factor constraints |
| 地区 | 粮食产量 | 水资源 | 林地 | 建设用地 | GDP | 可支配收入 | 一般公共服务支出 |
|---|---|---|---|---|---|---|---|
| 安徽 | 0.102 | 0.133 | 0.143 | 0.121 | 0.214 | 0.162 | 0.124 |
| 北京 | 0.169 | 0.092 | 0.147 | 0.189 | 0.109 | 0.102 | 0.190 |
| 福建 | 0.129 | 0.166 | 0.086 | 0.093 | 0.206 | 0.160 | 0.161 |
| 甘肃 | 0.120 | 0.161 | 0.178 | 0.109 | 0.156 | 0.142 | 0.134 |
| 广东 | 0.093 | 0.090 | 0.130 | 0.213 | 0.138 | 0.145 | 0.191 |
| 广西 | 0.099 | 0.112 | 0.210 | 0.121 | 0.180 | 0.152 | 0.126 |
| 贵州 | 0.065 | 0.075 | 0.218 | 0.129 | 0.224 | 0.161 | 0.127 |
| 海南 | 0.106 | 0.117 | 0.181 | 0.137 | 0.182 | 0.142 | 0.136 |
| 河北 | 0.100 | 0.118 | 0.203 | 0.123 | 0.144 | 0.148 | 0.165 |
| 河南 | 0.083 | 0.100 | 0.210 | 0.120 | 0.181 | 0.156 | 0.150 |
| 黑龙江 | 0.101 | 0.104 | 0.274 | 0.157 | 0.120 | 0.104 | 0.141 |
| 湖北 | 0.156 | 0.114 | 0.176 | 0.109 | 0.180 | 0.136 | 0.129 |
| 湖南 | 0.136 | 0.072 | 0.131 | 0.127 | 0.209 | 0.173 | 0.153 |
| 吉林 | 0.111 | 0.162 | 0.241 | 0.147 | 0.132 | 0.099 | 0.107 |
| 江苏 | 0.075 | 0.127 | 0.140 | 0.113 | 0.209 | 0.184 | 0.151 |
| 江西 | 0.064 | 0.157 | 0.104 | 0.126 | 0.201 | 0.167 | 0.181 |
| 辽宁 | 0.110 | 0.151 | 0.180 | 0.143 | 0.154 | 0.134 | 0.128 |
| 内蒙古 | 0.156 | 0.142 | 0.098 | 0.172 | 0.164 | 0.146 | 0.121 |
| 宁夏 | 0.078 | 0.172 | 0.162 | 0.116 | 0.175 | 0.153 | 0.146 |
| 青海 | 0.067 | 0.153 | 0.117 | 0.114 | 0.197 | 0.173 | 0.179 |
| 山东 | 0.134 | 0.115 | 0.176 | 0.108 | 0.162 | 0.151 | 0.154 |
| 山西 | 0.082 | 0.170 | 0.208 | 0.126 | 0.123 | 0.116 | 0.174 |
| 陕西 | 0.099 | 0.150 | 0.104 | 0.159 | 0.204 | 0.164 | 0.121 |
| 上海 | 0.118 | 0.101 | 0.211 | 0.068 | 0.137 | 0.144 | 0.220 |
| 四川 | 0.067 | 0.074 | 0.137 | 0.137 | 0.222 | 0.173 | 0.190 |
| 天津 | 0.160 | 0.096 | 0.205 | 0.093 | 0.134 | 0.143 | 0.169 |
| 西藏 | 0.071 | 0.109 | 0.218 | 0.107 | 0.176 | 0.201 | 0.118 |
| 新疆 | 0.113 | 0.101 | 0.212 | 0.108 | 0.170 | 0.150 | 0.146 |
| 云南 | 0.111 | 0.111 | 0.137 | 0.119 | 0.196 | 0.145 | 0.181 |
| 浙江 | 0.118 | 0.130 | 0.098 | 0.089 | 0.165 | 0.178 | 0.223 |
| 重庆 | 0.095 | 0.110 | 0.153 | 0.142 | 0.211 | 0.169 | 0.120 |
表7 单因素制约下胡焕庸线西侧均衡人口及占比Tab.7 Equilibrium population distribution on the western side of the Hu Line and its proportion with single factor constraints |
| 年份 | 指标 | SSP1-1.9 | SSP1-2.6 | SSP2-4.5 | SSP3-7.0 | SSP4-3.4 | SSP4-6.0 | SSP5-8.5 |
|---|---|---|---|---|---|---|---|---|
| 2035 | 人口/万人 | 8423 | 9348 | 9283 | 9678 | 8224 | 8656 | 9056 |
| 占比/% | 6.29 | 6.98 | 6.80 | 6.97 | 6.21 | 6.54 | 6.76 | |
| 2050 | 人口/万人 | 7076 | 7779 | 8465 | 7664 | 6068 | 6865 | 7005 |
| 占比/% | 5.78 | 6.35 | 6.70 | 5.86 | 5.13 | 5.80 | 5.72 |
表8 多因素综合模式下胡焕庸线西侧均衡人口及占比Tab.8 Equilibrium population distribution on the western side of the Hu Line and its proportion with multi-factor constraints |
| 年份 | 指标 | SSP1-1.9 | SSP1-2.6 | SSP2-4.5 | SSP3-7.0 | SSP4-3.4 | SSP4-6.0 | SSP5-8.5 |
|---|---|---|---|---|---|---|---|---|
| 2035 | 人口/万人 | 8634 | 8850 | 9081 | 9343 | 8593 | 8625 | 8607 |
| 占比/% | 6.45 | 6.61 | 6.65 | 6.73 | 6.49 | 6.52 | 6.43 | |
| 2050 | 人口/万人 | 8100 | 8331 | 8509 | 8879 | 7627 | 7629 | 7950 |
| 占比/% | 6.61 | 6.80 | 6.74 | 6.79 | 6.44 | 6.45 | 6.49 |
| [1] |
原新, 刘旭阳. 促进人口均衡发展的长周期思考[J]. 学海, 2021(4): 38-46.
[
|
| [2] |
于学军, 翟振武, 杨凡, 等. 为什么要建设“人口均衡型社会”?[J]. 人口研究, 2010, 34(3): 40-52.
[
|
| [3] |
田一聪, 田明, 李鹏, 等. 西藏自治区城镇化与生态系统服务协调发展研究[J]. 地理科学进展, 2023, 42(10): 1947-1960.
[
|
| [4] |
|
| [5] |
|
| [6] |
|
| [7] |
曹志杰, 陈绍军. 气候风险视域下气候移民的迁移机理、现状与对策[J]. 中国人口·资源与环境, 2012, 22(11): 45-50.
[
|
| [8] |
贾占华, 谷国锋. 东北地区人口分布的时空演变特征及影响因素[J]. 经济地理, 2016, 36(12): 60-68.
[
|
| [9] |
彭希哲, 刘宇辉. 生态足迹与区域生态适度人口: 以西部12省市为例[J]. 市场与人口分析, 2004(4): 9-15, 28.
[
|
| [10] |
王德, 朱玮, 叶晖. 1985—2000年我国人口迁移对区域经济差异的均衡作用研究[J]. 人口与经济, 2003(6): 1-9.
[
|
| [11] |
蒋子龙, 樊杰, 陈东. 2001—2010年中国人口与经济的空间集聚与均衡特征分析[J]. 经济地理, 2014, 34(5): 9-13, 82.
[
|
| [12] |
尹虹潘, 刘渝琳, 刘姝伶. 经济分布基准下的中国人口分布均衡测度研究: 基于Matlab空间模拟的估算[J]. 中国人口科学, 2014(5): 11-23, 126.
[
|
| [13] |
胡斯威, 王永生, 曹智. 乡村人地系统耦合研究进展与展望[J]. 地理科学进展, 2023, 42(12): 2439-2452.
[
|
| [14] |
程晨, 丁金宏, 顾高翔, 等. 长三角地区人口空间均衡模型建构及应用[J]. 地理学报, 2024, 79(2): 390-401.
[
|
| [15] |
王浣尘. 采用可能度和满意度的多目标决策方法[J]. 系统工程理论与实践, 1982(1): 14-22.
[
|
| [16] |
王颖, 黄进, 赵娟莹. 多目标决策视角下中国适度人口规模预测[J]. 人口学刊, 2011(4): 21-29.
[
|
| [17] |
童玉芬, 王静文, 梁钊. 资源环境约束下的中国适度人口研究[J]. 人口研究, 2016, 40(2): 3-11.
[
|
| [18] |
王勇, 解延京, 刘荣, 等. 北上广深城市人口预测及其资源配置[J]. 地理学报, 2021, 76(2): 352-366.
[
|
| [19] |
|
| [20] |
|
| [21] |
|
| [22] |
钟章奇, 王铮, 夏海斌, 等. 全球气候变化下中国农业生产潜力的空间演变[J]. 自然资源学报, 2015, 30(12): 2018-2032.
[
|
| [23] |
李亚婷, 潘少奇, 苗长虹. 中国县域人均粮食占有量的时空格局: 基于户籍人口和常住人口的对比分析[J]. 地理学报, 2014, 69(12): 1753-1766.
[
|
| [24] |
周迪, 周丰年, 钟绍军. 我国人均水资源量分布的俱乐部趋同研究: 基于扩展的马尔科夫链模型[J]. 干旱区地理, 2018, 41(4): 867-873.
[
|
| [25] |
|
| [26] |
|
| [27] |
|
| [28] |
杨绚, 汤绪, 陈葆德, 等. 利用CMIP5多模式集合模拟气候变化对中国小麦产量的影响[J]. 中国农业科学, 2014, 47(15): 3009-3024.
[
|
| [29] |
梁鑫源, 金晓斌, 孙瑞, 等. 多情景粮食安全底线约束下的中国耕地保护弹性空间[J]. 地理学报, 2022, 77(3): 697-713.
[
|
| [30] |
李满春, 杜聪, 姜朋辉, 等. 土地系统演变与气候变化耦合的中国未来水稻潜在产量模拟研究[J]. 中国科学: 地球科学, 2023, 53(8): 1795-1807.
[
|
| [31] |
丁小江, 钟方雷, 毛锦凰, 等. 共享社会经济路径下中国各省城市化水平预测[J]. 气候变化研究进展, 2018, 14(4): 392-401.
[
|
| [32] |
吴卓, 戴尔阜, 葛全胜, 等. 土地利用和气候变化对森林地上生物量的影响模拟: 以江西省泰和县为例[J]. 地理学报, 2017, 72(9): 1539-1554.
[
|
/
| 〈 |
|
〉 |