
交通一体化驱动下可达性对生产性服务业空间格局演化的作用机理——以长三角地区为例
|
蒋海兵(1978— ),男,江苏建湖县人,博士,教授,主要从事城市和区域发展研究。E-mail: haibingjiang1@163.com |
收稿日期: 2023-07-15
修回日期: 2024-02-21
网络出版日期: 2024-04-25
基金资助
国家自然科学基金项目(42271191)
江苏高校哲学社会科学研究重大项目(2021SJZDA024)
江苏高校“青蓝工程”中青年学术带头人资助项目
Mechanism of influence of accessibility on the evolution of the spatial pattern of producer services driven by transportation integration: A case study of the Yangtze River Delta region, China
Received date: 2023-07-15
Revised date: 2024-02-21
Online published: 2024-04-25
Supported by
National Natural Science Foundation of China(42271191)
Major Project of Philosophy and Social Science Research in Jiangsu University(2021SJZDA024)
"Qing Lan Project" Young and Middle-aged Academic Leader in Jiangsu University
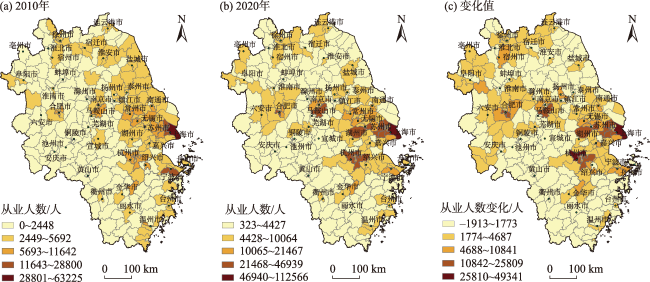
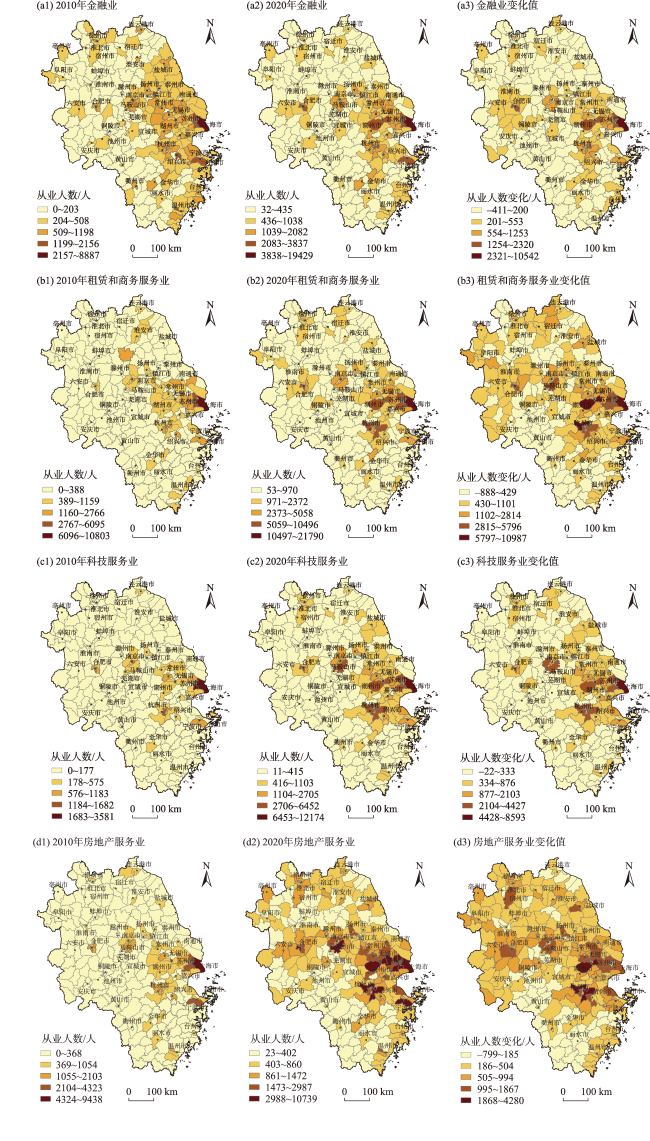
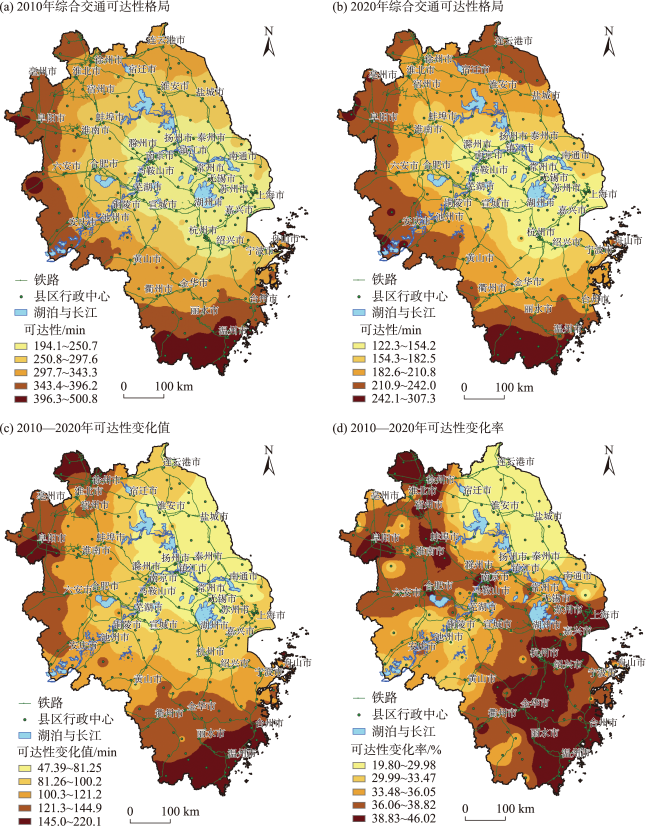
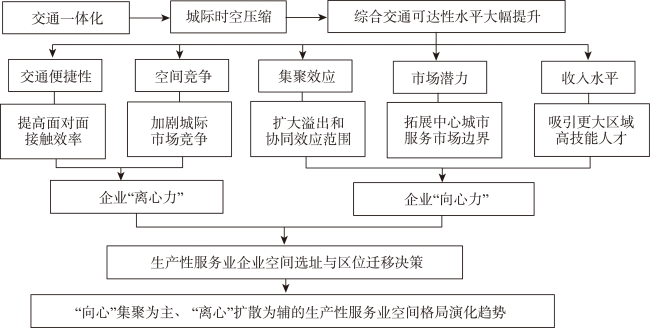
前瞻性地探讨交通一体化驱动下可达性对产业空间演化的作用规律,将为产业选址布局和功能定位及其相关政策体系制订等工作提供参考依据。论文以长三角地区生产性服务业为例,构建可达性空间模型测算县区可达性值,运用空间杜宾模型测度可达性对产业空间格局的作用强度及其变化趋势,揭示交通一体化驱动下可达性对生产性服务业空间演变的作用机理。结果显示:① 2010年和2020年全部和分行业生产性服务业高值区和高增长区呈现出等级分布和中心城市邻近分布。② 在交通一体化驱动下,长三角地区外围地区城市和核心城市可达性水平大幅度提高,可达性格局呈现东西扁平化的“核心—外围”结构,它对生产性服务业空间格局产生直接作用和间接作用。在直接作用中,综合交通可达性对生产性服务业空间格局的作用加强,高铁可达性对生产性服务业发展格局影响显著;在间接作用中,可达性通过空间集聚、空间竞争和市场潜力等因素对生产性服务业空间格局产生重要影响。③ 邻近县区空间集聚效应和空间竞争因素对本地生产性服务业空间格局的正负向作用增强。市场潜力是生产性服务业企业选址布局的主导因素,县区只有在具备足够市场潜力的基础上,高水平可达性才能在吸引生产性服务业企业落地上起到关键作用。④ 可达性不但具有推动生产性服务业企业扩散的“离心力”,也包含促进企业集聚的“向心力”,二者共同影响生产性服务业企业空间选址与区位迁移决策。据此,面对区域交通一体化水平的日趋提升,各地可以根据不同行业对可达性的敏感程度和区位偏好差异,因地制宜地规划布局交通枢纽地区生产性服务业产业集群。
蒋海兵 , 张文忠 , 余建辉 , 商硕 , 邹丽丽 . 交通一体化驱动下可达性对生产性服务业空间格局演化的作用机理——以长三角地区为例[J]. 地理科学进展, 2024 , 43(4) : 657 -673 . DOI: 10.18306/dlkxjz.2024.04.003
Prospectively exploring the role of accessibility on the evolution of industrial space driven by transportation integration will provide a reference for industrial site selection, functional positioning, and the formulation of related policy systems. Taking the producer service industry in the Yangtze River Delta region as an example, this study constructed a spatial accessibility model to measure county accessibility values, and used GIS spatial analysis and spatial Durbin model to measure the intensity of the impact of accessibility on industrial spatial patterns and trends of change, which can reveal the mechanism of accessibility's effect on the spatial evolution of producer services driven by transportation integration. The results indicate that: 1) In 2010 and 2020, the high-value areas and high-growth areas of producer services in all and sub-sectors showed hierarchical distribution and distribution near central cities. 2) Driven by transportation integration, the accessibility level of cities in peripheral areas and core cities in the Yangtze River Delta region has been greatly improved. The accessibility pattern presents a flat core-periphery structure from east to west, which has direct effects and indirect effects on the spatial pattern of the producer service industry. Among the direct effects, comprehensive transportation accessibility has a stronger effect on the spatial pattern of producer services, and high-speed rail accessibility has a significant impact on the development pattern of producer services. In the indirect effects, accessibility has an important impact on the spatial pattern of producer services through factors such as spatial agglomeration, spatial competition, and market potential. 3) The positive and negative effects of spatial agglomeration and spatial competition factors in neighboring counties on the spatial pattern of local producer service industries have increased. Market potential is the dominant factor in the location selection of producer service enterprises. Only when counties and districts have sufficient market potential can high-level accessibility play a key role in attracting producer service enterprises. 4) Accessibility not only has the "centrifugal force" that promotes the proliferation of producer service industry enterprises, but also has the "centripetal force" that promotes the agglomeration of producer service industry enterprises. The two jointly affect the spatial location choices and relocation decisions of enterprises. Thus, faced with the increasing level of regional transportation integration, various regions can plan and locate producer service industrial clusters in transportation hub areas according to local conditions based on the sensitivity of different industries to accessibility and their location preferences.
表1 空间杜宾模型变量选择Tab.1 Spatial Durbin model variable selection |
| 变量类型 | 变量 | 变量符号 | 变量含义 | 指标性质 |
|---|---|---|---|---|
| 自变量 | 加权平均旅行时间(min) | Acc | 综合交通可达性 | 负向 |
| 县区中心到最近高铁站的最短时间距(min) | Acc_gt | 高铁可达性 | 负向 | |
| 社会消费品零售总额(亿元) | Cons | 消费者市场潜力 | 正向 | |
| 工业增加值(亿元) | Indu | 生产者市场潜力 | 正向 | |
| 城镇单位就业人员平均工资(元) | Sala | 劳动力成本 | 正向 | |
| 全部和分行业生产性服务业从业人数空间滞后项(人) | W_p | 空间集聚效应 | 正向 | |
| 社会消费品零售总额空间滞后项(亿元) | W_con | 产业空间竞争 | 负向 | |
| 工业增加值空间滞后项(亿元) | W_ind | 产业空间竞争 | 负向 | |
| 城镇就业人员平均工资空间滞后项(元) | W_sal | 产业空间竞争 | 负向 | |
| 加权平均旅行时间空间滞后项(min) | W_acc | 产业空间竞争 | 负向 | |
| 因变量 | 全部生产性服务业从业人数(人) | Prod | 全部生产性服务业发展规模 | |
| 金融业从业人数(人) | Fina | 金融业发展规模 | ||
| 租赁和商务服务业从业人数(人) | Buss | 租赁和商务服务业发展规模 | ||
| 科技服务业从业人数(人) | Rese | 科技服务业发展规模 | ||
| 房地产服务业从业人数(人) | Real | 房地产服务业发展规模 | ||
| 信息服务业从业人数(人) | Info | 信息服务业发展规模 | ||
| 交通运输服务业从业人数(人) | Trans | 交通运输服务业发展规模 | ||
表2 长三角地区生产性服务业空间集聚与均衡水平对比分析Tab.2 Comparative analysis of spatial agglomeration and equilibrium level of producer services in the Yangtze River Delta region |
| 行业类型 | 全局Moran's I | MHHI | ||
|---|---|---|---|---|
| 2010年 | 2020年 | 2010年 | 2020年 | |
| 全部生产性服务业 | 0.474 | 0.403 | 0.0057 | 0.0058 |
| 金融业 | 0.365 | 0.281 | 0.0063 | 0.0072 |
| 租赁与商务服务业 | 0.532 | 0.470 | 0.0074 | 0.0059 |
| 科技服务业 | 0.555 | 0.456 | 0.0079 | 0.0066 |
| 房地产业 | 0.495 | 0.446 | 0.0071 | 0.0052 |
| 信息服务业 | ─ | 0.395 | ─ | 0.0080 |
| 交通运输服务业 | ─ | 0.317 | ─ | 0.0049 |
注:─表示数据缺失。 |
图1 长三角地区县区全部生产性服务业空间格局及其变化分析Fig.1 Analysis of the spatial pattern and changes of all producer service industries in counties and districts of the Yangtze River Delta region |
表3 2010年与2020年长三角地区综合交通可达性及其变化分析Tab.3 Analysis of comprehensive transportation accessibility and its changes in the Yangtze River Delta region in 2010 and 2020 |
| 评价指标 | 2010年 | 2020年 | 变化率/% | |||||||
|---|---|---|---|---|---|---|---|---|---|---|
| 最小值/min | 平均值/min | 最大值/min | 变异系数 | 最小值/min | 平均值/min | 最大值/min | 变异系数 | 平均值 | 变异系数 | |
| 加权平均旅行时间 | 194.12 | 285.95 | 500.83 | 0.23 | 122.15 | 181.67 | 307 | 0.22 | 36 | 3 |
| 城市对时间距离 | ─ | 289.27 | 805.1 | 0.47 | ─ | 190.94 | 480 | 0.42 | 34 | 9 |
表4 综合交通可达性对生产性服务业作用强度的空间杜宾模型分析(非标准化系数)Tab.4 Spatial Durbin model analysis of the impact of comprehensive transportation accessibility on the spatial pattern of producer services(unstandardized coefficients) |
| 变量 | ln Prod | ln Fina | ln Buss | ln Rese | ln Real | ln Info | ln Trans | |||||
|---|---|---|---|---|---|---|---|---|---|---|---|---|
| 2010年 | 2020年 | 2010年 | 2020年 | 2010年 | 2020年 | 2010年 | 2020年 | 2010年 | 2020年 | 2020年 | 2020年 | |
| ln Indu | 0.157*** | 0.114*** | 0.042 | 0.008 | 0.112** | 0.072** | 0.076 | 0.101*** | 0.146*** | 0.096*** | 0.058* | 0.209*** |
| ln Sala | 0.106 | -0.013 | 0.178 | 0.297* | 0.438 | 0.085 | 0.936* | 0.610*** | 0.660 | 0.448** | 0.202 | -0.561*** |
| ln Cons | 0.570*** | 0.753*** | 0.727*** | 0.855*** | 0.738*** | 0.798*** | 0.809*** | 0.835*** | 0.717*** | 0.746*** | 0.900*** | 0.630*** |
| ln Acc | -0.533 | -0.987*** | -0.219 | -0.705** | -0.895 | -1.157*** | -0.834 | -1.149*** | -2.104** | -0.876** | -1.869*** | -0.346 |
| ln W_ind | -0.183*** | -0.115** | -0.215*** | -0.026 | -0.232** | -0.089 | -0.259* | -0.070 | -0.243** | -0.059 | -0.177*** | -0.116** |
| ln W_sal | -0.471* | -0.061 | 0.277 | 0.135 | -0.236 | -0.088 | -0.689 | -0.524** | -0.579 | -0.633*** | -0.200 | 0.343 |
| ln W_con | -0.122 | -0.360*** | 0.022 | -0.356*** | -0.016 | -0.321*** | -0.230 | -0.426*** | -0.133 | -0.341*** | -0.403*** | -0.361*** |
| ln W_acc | 0.424 | 0.816*** | 0.064 | 0.636* | 0.630 | 0.930** | -0.013 | 0.769* | 1.409 | 0.419 | 1.504*** | 0.443 |
| ln W_p | 0.565*** | 0.580*** | 0.150 | 0.376*** | 0.421*** | 0.535*** | 0.497*** | 0.578*** | 0.489*** | 0.535*** | 0.592*** | 0.590*** |
| 常数项 | 5.795*** | 3.049* | -1.422 | -3.174 | -0.049 | 1.776 | 2.607 | 1.052 | 3.632 | 4.883** | 2.201 | 2.891 |
| 调整后R2 | 0.790 | 0.862 | 0.739 | 0.838 | 0.737 | 0.824 | 0.616 | 0.830 | 0.689 | 0.813 | 0.833 | 0.772 |
| 观测数 | 310 | 305 | 310 | 305 | 310 | 305 | 310 | 305 | 310 | 305 | 305 | 305 |
注:*、**、***分别代表通过10%、5%和1%的显著性水平检验。下同。 |
表5 综合交通可达性对生产性服务业作用强度的空间杜宾模型分析(标准化系数)Tab.5 Spatial Durbin model analysis of the impact of comprehensive transportation accessibility on the spatial pattern of producer services (standardized coefficients) |
| 变量 | ln Prod | ln Fina | ln Buss | ln Rese | ln Real | ln Info | ln Trans | |||||||||||
|---|---|---|---|---|---|---|---|---|---|---|---|---|---|---|---|---|---|---|
| 2010年 | 2020年 | 2010年 | 2020年 | 2010年 | 2020年 | 2010年 | 2020年 | 2010年 | 2020年 | 2020年 | 2020年 | |||||||
| ln Indu | 0.208*** | 0.144*** | 0.050 | 0.010 | 0.102** | 0.083** | 0.059 | 0.098*** | 0.127*** | 0.114*** | 0.059* | 0.303*** | ||||||
| ln Sala | 0.036 | -0.005 | 0.055 | 0.096* | 0.103 | 0.026 | 0.189* | 0.158*** | 0.149 | 0.141** | 0.054 | -0.216*** | ||||||
| ln Cons | 0.662*** | 0.732*** | 0.758*** | 0.795*** | 0.588*** | 0.708*** | 0.549*** | 0.623*** | 0.547*** | 0.680*** | 0.700*** | 0.699*** | ||||||
| ln Acc | -0.132 | -0.229*** | -0.049 | -0.156** | -0.152 | -0.245*** | -0.121 | -0.205*** | -0.342** | -0.190** | -0.347*** | -0.092 | ||||||
| ln W_ind | -0.194*** | -0.114** | -0.205*** | -0.024 | -0.169** | -0.081 | -0.162* | -0.053 | -0.169** | -0.054 | -0.140*** | -0.131** | ||||||
| ln W_sal | -0.151* | -0.019 | 0.080 | 0.040 | -0.052 | -0.025 | -0.130 | -0.124** | -0.122 | -0.183*** | -0.049 | 0.121 | ||||||
| ln W_con | -0.115 | -0.288*** | 0.019 | -0.272*** | -0.011 | -0.234*** | -0.127 | -0.262*** | -0.082 | -0.255*** | -0.258*** | -0.330*** | ||||||
| ln W_acc | 0.098 | 0.178*** | 0.013 | 0.132* | 0.100 | 0.185** | -0.002 | 0.129* | 0.214 | 0.086 | 0.262*** | 0.110 | ||||||
| ln W_p | 0.473*** | 0.509*** | 0.122 | 0.328*** | 0.349*** | 0.461*** | 0.396*** | 0.506*** | 0.382*** | 0.444*** | 0.540*** | 0.501*** | ||||||
| 调整后R2 | 0.790 | 0.862 | 0.739 | 0.838 | 0.737 | 0.824 | 0.838 | 0.830 | 0.737 | 0.813 | 0.833 | 0.772 | ||||||
| 观测数 | 310 | 305 | 310 | 305 | 310 | 305 | 310 | 305 | 310 | 305 | 305 | 305 | ||||||
表6 高铁可达性对生产性服务业作用强度的空间杜宾模型分析(非标准化系数)Tab.6 Spatial Durbin model analysis of the impact of high-speed rail accessibility on the spatial pattern of producer services (unstandardized coefficients) |
| 变量 | ln Prod | ln Buss | ln Fina | ln Rese | ln Real | ln Info | ln Trans |
|---|---|---|---|---|---|---|---|
| ln Indus | 0.119*** | 0.076*** | 0.015*** | 0.112*** | 0.106*** | 0.068** | 0.210*** |
| ln Sala | 0.129 | 0.261 | 0.371** | 0.788*** | 0.569*** | 0.482** | -0.524*** |
| ln Cons | 0.755*** | 0.803*** | 0.847*** | 0.833*** | 0.733*** | 0.905*** | 0.631*** |
| ln Acc_gt | -0.065** | -0.067** | -0.082*** | -0.064* | -0.089*** | -0.118*** | -0.033 |
| ln W_ind | -0.081* | -0.047 | -0.008 | -0.003 | 0.001 | -0.107* | -0.122** |
| ln W_sal | -0.179 | -0.223 | 0.068 | -0.674*** | -0.683*** | -0.420* | 0.285 |
| ln W_con | -0.394*** | -0.365*** | -0.368*** | -0.501*** | -0.408*** | -0.484*** | -0.366*** |
| ln W_acc_gt | 0.005 | 0.016 | 0.013 | -0.089 | -0.007 | 0.023 | 0.026 |
| ln W_p | 0.578*** | 0.540*** | 0.366*** | 0.584*** | 0.577*** | 0.606*** | 0.589*** |
| 常数项 | 2.034** | 0.207 | -3.390*** | -0.85 | 1.78 | -0.199 | 3.675*** |
| 调整后R2 | 0.859 | 0.820 | 0.840 | 0.833 | 0.811 | 0.825 | 0.772 |
| 观测数 | 305 | 305 | 305 | 305 | 305 | 305 | 305 |
表7 2020年高铁可达性对生产性服务业作用强度的空间杜宾模型分析(标准化系数)Tab.7 Spatial Durbin model analysis of the impact of high-speed rail accessibility on the spatial pattern of producer services (standardized coefficients) |
| 变量 | ln Prod | ln Buss | ln Fina | ln Rese | ln Real | ln Info | ln Trans |
|---|---|---|---|---|---|---|---|
| ln Indu | 0.151*** | 0.089*** | 0.018*** | 0.109*** | 0.126*** | 0.069** | 0.305*** |
| ln Sala | 0.043 | 0.080 | 0.120** | 0.204*** | 0.180*** | 0.130** | -0.202*** |
| ln Cons | 0.735*** | 0.712*** | 0.788*** | 0.622*** | 0.668*** | 0.704*** | 0.701*** |
| ln Acc_gt | -0.061** | -0.057** | -0.073*** | -0.045* | -0.078*** | -0.088*** | -0.035 |
| ln W_ind | -0.080* | -0.042 | -0.008 | -0.002 | 0.001 | -0.085* | -0.138** |
| ln W_sal | -0.055 | -0.063 | 0.020 | -0.160*** | -0.197*** | -0.104* | 0.101 |
| ln W_con | -0.315*** | -0.266*** | -0.282*** | -0.308*** | -0.306*** | -0.309*** | -0.335*** |
| ln W_acc_gt | 0.003 | 0.009 | 0.008 | -0.043 | -0.004 | 0.012 | 0.019 |
| ln W_p | 0.507*** | 0.466*** | 0.319*** | 0.511*** | 0.480*** | 0.553*** | 0.500*** |
| 调整后R2 | 0.859 | 0.820 | 0.840 | 0.828 | 0.811 | 0.825 | 0.772 |
| 观测数 | 305 | 305 | 305 | 305 | 305 | 305 | 305 |
表8 综合交通可达性与市场潜力和空间竞争因素的回归模型分析(标准化系数)Tab.8 Regressive analysis of the comprehensive transportation accessibility and market potential and spatial competition factors (standardized coefficients) |
| 变量 | ln Cons | ln W_ind | ln W_sal | ln W_con | ||||
|---|---|---|---|---|---|---|---|---|
| 2010年 | 2020年 | 2010年 | 2020年 | 2010年 | 2020年 | 2010年 | 2020年 | |
| ln Acc | -0.471*** | -0.534*** | -0.615*** | -0.636*** | -0.470*** | -0.564*** | -0.535*** | -0.549*** |
| 调整后R2 | 0.219 | 0.282 | 0.376 | 0.402 | 0.218 | 0.316 | 0.284 | 0.300 |
| 观测数 | 310 | 305 | 310 | 305 | 310 | 305 | 310 | 305 |
表9 综合交通可达性与空间集聚效应因素的回归模型分析(标准化系数)Tab.9 Regressive analysis of the comprehensive transportation accessibility and spatial agglomeration effect (standardized coefficients) |
| 变量 | ln W_Prod | ln W_Fina | ln W_Rese | ln W_Buss | |||||||
|---|---|---|---|---|---|---|---|---|---|---|---|
| 2010年 | 2020年 | 2010年 | 2020年 | 2010年 | 2020年 | 2010年 | 2020年 | ||||
| ln Acc | -0.511*** | -0.564*** | -0.487*** | -0.529*** | -0.569*** | -0.636*** | -0.544*** | -0.572*** | |||
| 调整后R2 | 0.258 | 0.316 | 0.234 | 0.277 | 0.322 | 0.403 | 0.294 | 0.325 | |||
| 观测数 | 310 | 305 | 310 | 305 | 310 | 305 | 310 | 305 | |||
注:ln W_Prod、ln W_Buss、ln W_Fina和ln W_Rese依次为ln Prod、ln Buss、ln Fina和ln Rese值的空间滞后项。 |
两位匿名评审专家对本文研究方法、数据分析和作用机理提出了宝贵建议和意见,在此表示诚挚感谢。
| [1] |
许学强, 周一星, 宁越敏. 城市地理学[M]. 2版. 北京: 高等教育出版社, 2009.
[
|
| [2] |
|
| [3] |
|
| [4] |
|
| [5] |
|
| [6] |
|
| [7] |
|
| [8] |
|
| [9] |
郑德高, 杜宝东. 寻求节点交通价值与城市功能价值的平衡: 探讨国内外高铁车站与机场等交通枢纽地区发展的理论与实践[J]. 国际城市规划, 2007, 22(1): 72-76.
[
|
| [10] |
|
| [11] |
|
| [12] |
罗双成, 刘建江, 石大千, 等. 创新的高速路: 高铁对制造业创新的影响[J]. 中国经济问题, 2021(4): 172-187.
[
|
| [13] |
覃成林, 杨晴晴. 高速铁路对生产性服务业空间格局变迁的影响[J]. 经济地理, 2017, 37(2): 90-97.
[
|
| [14] |
|
| [15] |
唐昭沛, 吴威, 刘玮辰, 等. 高速铁路对生产性服务业空间集聚的影响: 以长三角城市群为例[J]. 地理科学进展, 2021, 40(5): 746-758.
[
|
| [16] |
李雪松, 孙博文. 高铁开通促进了地区制造业集聚吗?基于京广高铁的准自然试验研究[J]. 中国软科学, 2017(7): 81-90.
[
|
| [17] |
朱文涛. 高铁服务供给对省域制造业空间集聚的影响研究[J]. 产业经济研究, 2019(3): 27-39.
[
|
| [18] |
|
| [19] |
|
| [20] |
|
| [21] |
|
| [22] |
|
| [23] |
陈松林, 陈进栋, 韦素琼. 福建省综合交通可达性格局及其与制造业空间分布的关系分析[J]. 地理科学, 2012, 32(7): 807-815.
[
|
| [24] |
|
| [25] |
傅志寰, 陆化普. 城市群交通一体化: 理论研究与案例分析[M]. 北京: 人民交通出版社, 2016.
[
|
| [26] |
徐建华. 计量地理学[M]. 2版. 北京: 高等教育出版社, 2014.
[
|
| [27] |
王庆喜, 蒋烨, 陈卓咏. 区域经济研究实用方法: 基于ArcGIS, GeoDa和R的运用[M]. 北京: 经济科学出版社, 2014.
[
|
| [28] |
蒋海兵. 区域高速交通基础设施可达性研究[M]. 北京: 科学出版社, 2022.
[
|
| [29] |
张文忠. 经济区位论[M]. 北京: 商务印书馆, 2022.
[
|
| [30] |
邱灵. 北京市生产性服务业空间结构演化机理研究[J]. 中国软科学, 2013(5): 74-91.
[
|
| [31] |
申玉铭, 吴康, 任旺兵. 国内外生产性服务业空间集聚的研究进展[J]. 地理研究, 2009, 28(6): 1494-1507.
[
|
| [32] |
张旺, 申玉铭. 京津冀都市圈生产性服务业空间集聚特征[J]. 地理科学进展, 2012, 31(6): 742-749.
[
|
| [33] |
刘曙华. 生产性服务业集聚与区域空间重构[M]. 北京: 经济科学出版社, 2012.
[
|
| [34] |
|
| [35] |
蒋海兵, 刘建国, 蒋金亮. 高速铁路影响下的全国旅游景点可达性研究[J]. 旅游学刊, 2014, 29(7): 58-67.
[
|
/
| 〈 |
|
〉 |