
北京对外投资与吸引投资的时空特征及影响因素的比较研究
|
王子安(1998— ),男,北京人,硕士生,主要研究方向为产业地理。E-mail: 871665675@qq.com |
收稿日期: 2022-08-08
修回日期: 2022-12-28
网络出版日期: 2023-03-27
基金资助
国家自然科学基金项目(41971156)
国家自然科学基金项目(42071148)
A comparative study on the temporal and spatial characteristics and influencing factors of Beijing’s outward investment and inward investment
Received date: 2022-08-08
Revised date: 2022-12-28
Online published: 2023-03-27
Supported by
National Natural Science Foundation of China(41971156)
National Natural Science Foundation of China(42071148)
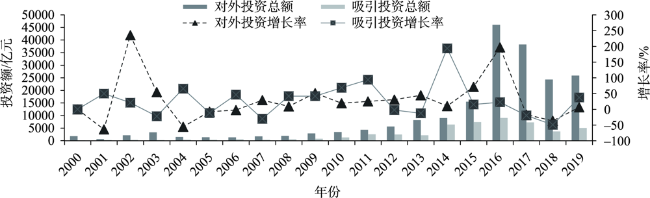
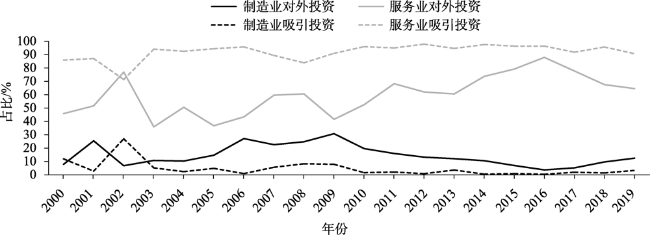
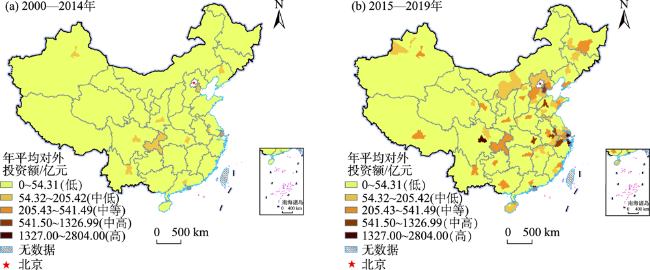
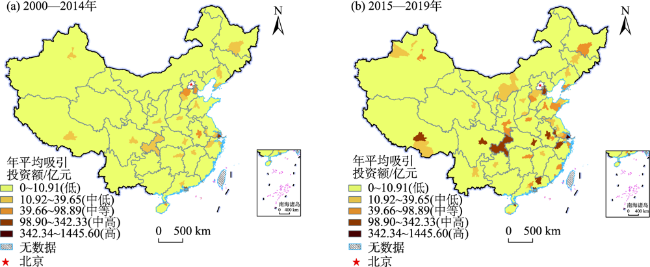
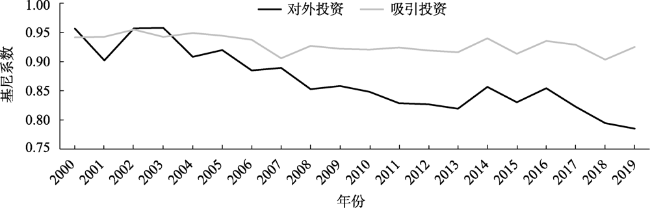
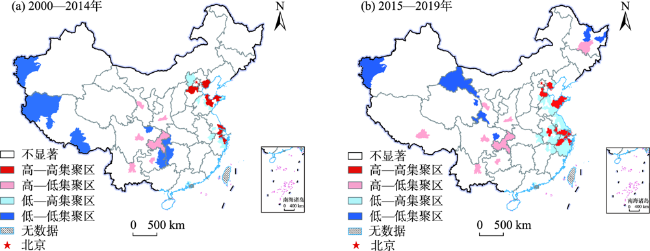
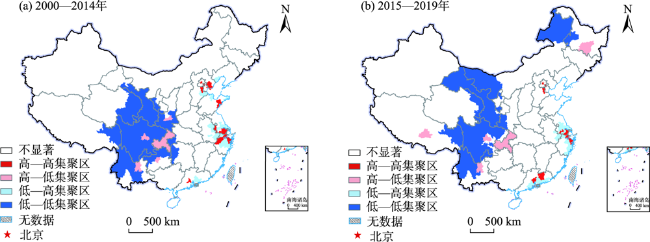
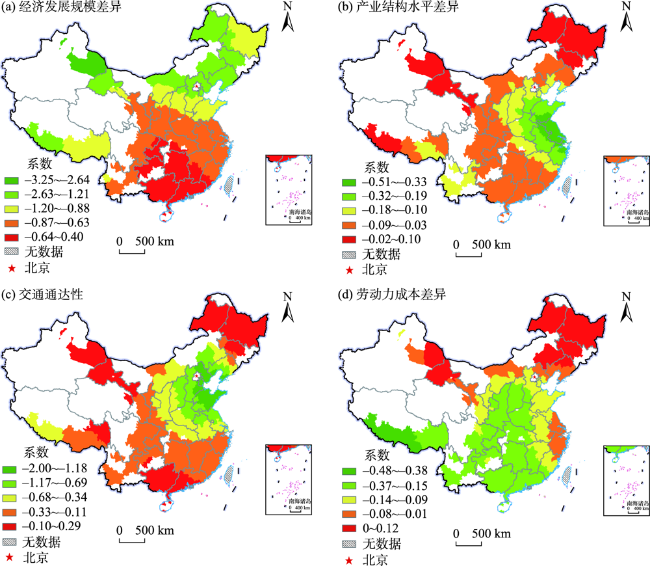
随着北京总部经济的蓬勃发展和非首都核心功能疏解的持续推进,北京与国内其他城市的资本流动得到了越来越多的关注。论文利用2000—2019年北京与全国地级及以上城市对外投资和吸引投资数据,揭示北京对外投资和吸引投资的时空特征,并利用地理加权回归(GWR)模型分析投资影响因素的空间分异特征。研究发现: ① 北京对外投资与吸引投资规模均呈现出先增加再减少的趋势,且对外投资一直大于吸引投资,北京是资本净输出区;北京对外投资和吸引投资均以服务业为主,对外投资的制造业总额和比重均大于吸引投资。② 北京对外投资与吸引投资空间范围不断扩大,对外投资的空间分布范围更广,分层现象更加明显;北京对外投资目的地以东部沿海城市和省会城市为主,近期更注重对中西部城市和北京周边城市的投资;北京吸引投资来源地较为稳定,主要是省会城市、东部沿海城市和北京周边城市。对外投资与吸引投资的重点区域非常类似。③ 北京对外投资与吸引投资的空间集中程度高但呈现下降趋势,吸引投资空间集中程度更高;近期北京对外投资分布呈现空间正相关分布,吸引投资呈现随机分布;对外投资形成了京津冀、长三角、山东半岛三大高—高集聚区;吸引投资形成了长三角、珠三角两大高—高集聚区。④ 对外投资与吸引投资均受到经济发展规模差异、产业结构水平差异的影响,影响效果存在明显的空间异质性;对外投资还会受到交通通达性和劳动力成本差异的影响,吸引投资还会受到经济开放程度差异的影响。论文完善了对外投资目的地与吸引投资来源地的对比研究,丰富了投资地理研究。
王子安 , 卢明华 . 北京对外投资与吸引投资的时空特征及影响因素的比较研究[J]. 地理科学进展, 2023 , 42(3) : 438 -451 . DOI: 10.18306/dlkxjz.2023.03.003
With the vigorous development of Beijing's headquarters economy and continuous promotion of the relief of noncapital core functions, capital flows between Beijing and other cities in China have received increasingly attention. Using the data of Beijing's outward investment and inward investment at prefecture-level and above cities from 2000 to 2019, this study examined the temporal and spatial characteristics of Beijing's outward investment and inward investment, and analyzed the spatial differentiation characteristics of investment influencing factors using a geographically weighted regression (GWR) model. The research found that: 1) Beijing's outward investment and inward investment first increased and then decreased, outward investment had always been greater than inward investment, and Beijing was a net capital export area. Beijing's outward investment and inward investment were mainly in the service sector, and the total amount and proportion of manufacturing in outward investment were greater than that of inward investment. 2) The spatial scope of Beijing's outward investment and inward investment continued to expand, the spatial distribution of destinations of outward investment was wider than inward investment, and the stratification phenomenon was more obvious. Beijing's outward investment was mainly in eastern coastal cities and provincial capital cities. Recently, more attention had been paid to the investment in central and western cities and cities around Beijing. The origin city of inward investment was stable, mainly provincial capital cities, eastern coastal cities, and cities around Beijing. The key cities of outward investment and inward investment were similar. 3) Beijing had a high degree of spatial concentration of outward investment and inward investment but showed a downward trend, and the degree of spatial concentration of inward investment was even higher. Recently, Beijing's outward investment had shown a positive spatial association, and inward investment had shown a random distribution. The high-high agglomeration areas of outward investment were the Beijing-Tianjin-Hebei, Yangtze River Delta, and Shandong Peninsula regions, and the high-high agglomeration areas of inward investment were the Yangtze River Delta and Pearl River Delta regions. 4) Beijing's outward investment and inward investment were both affected by differences in economic development scale and industrial structure, but there was an obvious spatial heterogeneity in the effects of influence. Outward investment was also affected by differences in transportation accessibility and labor costs, and inward investment was also affected by differences in economic openness. The research has improved the comparative study of outward investment destinations and inward investment sources, and enriched the study of investment geography.
图1 2000—2019年北京对外、吸引投资规模及增长率Fig.1 Scale and growth rate of Beijing's outward investment and inward investment during 2000-2019 |
表1 北京对外、吸引投资影响因素的指标选择Tab.1 Indicators for the influencing factors of Beijing's outward investment and inward investment |
| 影响因素 | 指标选取 | 定义 |
|---|---|---|
| 经济发展规模差异 | GDP | 各城市地区生产总值与北京地区生产总值的差值(万元) |
| 经济开放程度差异 | 实际使用外资额 | 各城市实际使用外资额与北京实际使用外资额差值(万美元) |
| 产业结构水平差异 | 第三产业与第二产业比值 | 各城市第三产业增加值与第二产业增加值的比值和北京第三产业增加值与第二产业增加值的比值的差值 |
| 交通通达性 | 铁路时间距离 | 距离北京的最短铁路行驶时间(h) |
| 创新能力差异 | 专利授权量 | 各城市的有效专利授权量与北京有效专利授权量的差值(件) |
| 政策环境差异 | 国家级经济技术开发区数量 | 各城市拥有的国家级经济技术开发区的数量与北京拥有的国家级经济技术开发区数量的差值(个) |
| 劳动力成本差异 | 在岗职工年平均工资 | 各城市在岗职工年平均工资与北京在岗职工年平均工资的差值(万元) |
| 劳动力素质差异 | 本专科在校生数量 | 各城市本专科在校生数量与北京本专科在校生数量的差值(人) |
表2 北京对外投资、吸引投资影响因素的OLS回归结果Tab.2 OLS regression results of influencing factors of Beijing's outward investment and inward investment |
| 变量 | 对外投资 | 吸引投资 |
|---|---|---|
| 经济发展规模差异 | -0.691*** | -0.989*** |
| (-3.214) | (-5.364) | |
| 经济开放程度差异 | -0.059 | -0.313** |
| (-0.313) | (-1.992) | |
| 产业结构水平差异 | -0.120** | 0.084*** |
| (-2.909) | (-3.294) | |
| 交通通达性 | -0.249** | -0.058 |
| (-3.981) | (-0.978) | |
| 创新能力差异 | 0.165 | 0.220 |
| (1.057) | (1.418) | |
| 政策环境差异 | -0.056 | 0.025 |
| (-0.606) | (0.384) | |
| 劳动力成本差异 | -0.169*** | -0.063 |
| (-2.916) | (-1.048) | |
| 劳动力素质差异 | -0.112 | 0.219 |
| (-1.046) | (0.367) | |
| 常数项 | 0.001 | 0.024 |
| (0.025) | (0.827) | |
| R2 | 0.606 | 0.764 |
注:括号中为t统计量;***、**、*分别表示P<0.01、P<0.05、P<0.1。 |
表3 北京对外投资影响因素GWR运算结果Tab.3 Calculation results of GWR of influencing factors of Beijing's outward investment |
| 解释变量 | 最大值 | 最小值 | 系数绝对 平均值 | 正值占比/% | 负值占比/% |
|---|---|---|---|---|---|
| 经济发展规模差异 | -0.40 | -3.25 | 0.8500 | 0 | 100.00 |
| 产业结构水平差异 | 0.12 | -0.51 | 0.1352 | 7.17 | 92.83 |
| 交通通达性 | 0.29 | -2.00 | 0.4600 | 4.78 | 95.22 |
| 劳动力成本差异 | 0.12 | -0.48 | 0.1351 | 9.22 | 90.78 |
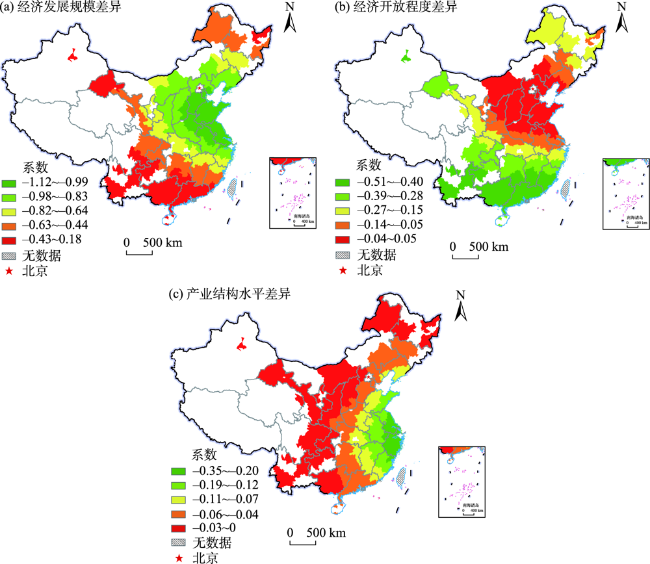
表4 北京吸引投资影响因素GWR模型运算结果Tab.4 Calculation results of GWR of influencing factors of Beijing's inward investment |
| 解释变量 | 最大值 | 最小值 | 系数绝对 平均值 | 正值占比/% | 负值占比/% |
|---|---|---|---|---|---|
| 经济发展规模差异 | -0.18 | -1.12 | 0.72 | 0 | 100.00 |
| 经济开放程度差异 | 0.05 | -0.51 | 0.21 | 18.77 | 81.23 |
| 产业结构水平差异 | 0 | -0.35 | 0.08 | 0.36 | 99.64 |
| [1] |
魏后凯. 现代区域经济学[M]. 北京: 经济管理出版社, 2006.
[
|
| [2] |
|
| [3] |
|
| [4] |
|
| [5] |
|
| [6] |
|
| [7] |
|
| [8] |
李国平, 杨开忠. 外商对华直接投资的产业与空间转移特征及其机制研究[J]. 地理科学, 2000, 20(2): 102-109.
[
|
| [9] |
廖小东, 丰凤. 近10年外商在华直接投资的空间分异及成因分析[J]. 经济地理, 2012, 32(12): 112-116.
[
|
| [10] |
曾国军. 外商直接投资在华区位选择的影响因素研究[J]. 学术研究, 2005(11): 38-42, 147.
[
|
| [11] |
|
| [12] |
|
| [13] |
贺灿飞, 肖晓俊. 跨国公司功能区位实证研究[J]. 地理学报, 2011, 66(12): 1669-1681.
[
|
| [14] |
|
| [15] |
|
| [16] |
|
| [17] |
|
| [18] |
汪胜兰, 蒋小荣, 杨永春. 中国境外投资企业功能区位的空间格局及其演化[J]. 地域研究与开发, 2020, 39(5): 1-7.
[
|
| [19] |
余官胜, 林俐. 企业海外集群与新晋企业对外直接投资区位选择: 基于浙江省微观企业数据[J]. 地理研究, 2015, 34(2): 364-372.
[
|
| [20] |
王茂军, 徐永平. 中国在美洲OFDI的基本特征与决定因素[J]. 地理学报, 2017, 72(8): 1373-1391.
[
|
| [21] |
刘晓宁. 企业对外直接投资区位选择: 东道国因素与企业异质性因素的共同考察[J]. 经济经纬, 2018, 35(3): 59-66.
[
|
| [22] |
郑蕾, 刘志高. 中国对“一带一路”沿线直接投资空间格局[J]. 地理科学进展, 2015, 34(5): 563-570.
[
|
| [23] |
公丕萍, 宋周莺, 刘卫东. 中国与“一带一路”沿线国家贸易的商品格局[J]. 地理科学进展, 2015, 34(5): 571-580.
[
|
| [24] |
张亚斌. “一带一路”投资便利化与中国对外直接投资选择: 基于跨国面板数据及投资引力模型的实证研究[J]. 国际贸易问题, 2016(9): 165-176.
[
|
| [25] |
王帅, 席强敏, 李国平. 北京制造业企业对河北投资的空间特征与影响因素[J]. 经济地理, 2015, 35(4): 90-98.
[
|
| [26] |
卢明华, 周悦颜, 刘汉初, 等. 北京企业对河北直接投资的时空动态特征及影响因素[J]. 地理科学进展, 2020, 39(3): 389-401.
[
|
| [27] |
桑瑞聪, 刘志彪. 中国产业转移趋势特征和影响因素研究: 基于上市公司微观数据的分析[J]. 财贸研究, 2014, 25(6): 53-60.
[
|
| [28] |
宋渊洋, 黄礼伟. 为什么中国企业难以国内跨地区经营?[J]. 管理世界, 2014, 30(12): 115-133.
[
|
| [29] |
胡国建, 陈传明, 陈丽娟, 等. 企业跨区域投资格局及其影响因素: 以福建上市企业为例[J]. 经济地理, 2018, 38(9): 138-146.
[
|
| [30] |
张永波, 张峰. 基于企业投资数据的京津冀科技创新空间网络研究[J]. 城市规划学刊, 2017(S2): 72-78.
[
|
| [31] |
谢专, 张佳梁, 张晓波. 京津冀的产业结构现状、变迁与空间资本流动: 来自工商注册数据的证据[J]. 人口与发展, 2015, 21(5): 24-33.
[
|
| [32] |
许欣. 北京企业对河北直接投资区位选择及影响因素研究[D]. 北京: 首都师范大学, 2017.
[
|
| [33] |
陆大道. 京津冀城市群功能定位及协同发展[J]. 地理科学进展, 2015, 34(3): 265-270.
[
|
| [34] |
叶琪. 我国区域产业转移的态势与承接的竞争格局[J]. 新疆财经, 2013(6): 38-45.
[
|
| [35] |
沈惊宏, 孟德友, 陆玉麒. 皖江城市带承接长三角产业转移的空间差异分析[J]. 经济地理, 2012, 32(3): 43-49.
[
|
| [36] |
张建伟, 苗长虹, 肖文杰. 河南省承接产业转移区域差异及影响因素[J]. 经济地理, 2018, 38(3): 106-112.
[
|
| [37] |
张建伟, 赵建吉, 肖文杰, 等. 豫皖湘赣承接产业转移的空间计量经济分析[J]. 地理科学, 2019, 39(1): 140-146.
[
|
| [38] |
|
| [39] |
蔡高明, 李志斌, 王东宇, 等. 中原城市群产业投资网络结构特征分析[J]. 城市发展研究, 2017, 24(12): 16-21, 91.
[
|
| [40] |
王伟, 张常明, 王梦茹. 中国三大城市群产业投资网络演化研究[J]. 城市发展研究, 2018, 25(11): 118-124, 2, 161.
[
|
| [41] |
李聪, 卢明华, 张金哲, 等. 京津冀城市群产业投资网络演变及影响因素研究[J]. 人文地理, 2022, 37(5): 162-170.
[
|
| [42] |
高技. Excel下基尼系数的计算研究[J]. 浙江统计, 2008(6): 41-43.
[
|
| [43] |
宗会明, 季欣. 1999—2018年重庆市主城区住宅用地空间演变特征及驱动因素研究[J]. 地理科学, 2021, 41(7): 1256-1265.
[
|
| [44] |
王少剑, 高爽, 陈静. 基于GWR模型的中国城市雾霾污染影响因素的空间异质性研究[J]. 地理研究, 2020, 39(3): 651-668.
[
|
| [45] |
周悦颜. 基于企业网络的京津冀地区城市联系特征及影响因素[D]. 北京: 首都师范大学, 2020.
[
|
| [46] |
王成. 山东省城市网络特征及其演化过程探析[D]. 北京: 首都师范大学, 2015.
[
|
| [47] |
吴加伟, 陈雯, 袁丰, 等. 中国企业本土并购双方的地理格局及其空间关联研究[J]. 地理科学, 2019, 39(9): 1434-1445.
[
|
/
| 〈 |
|
〉 |