
泰安市设施农用地的时空格局演变与影响因素
|
陈韵凌(2001— ),女,湖南怀化人,硕士生,研究方向为城乡发展与区域规划。E-mail: Lucky_chen518@163.com |
收稿日期: 2022-05-28
修回日期: 2022-09-27
网络出版日期: 2023-02-06
基金资助
国家重点研发计划项目(2018YFD1100803)
Spatial and temporal patterns of facility agricultural land in Tai’an City and influencing factors
Received date: 2022-05-28
Revised date: 2022-09-27
Online published: 2023-02-06
Supported by
National Key Research and Development Program of China(2018YFD1100803)
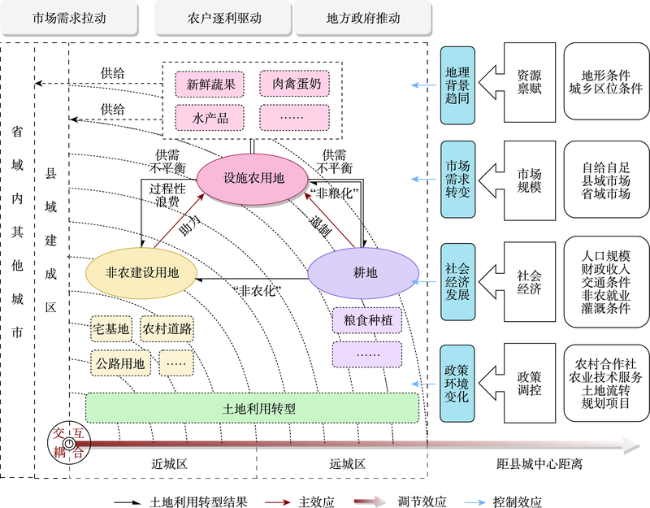
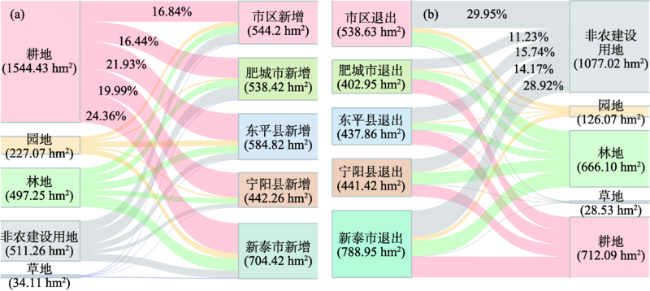
设施农用地是农副产品重要的空间载体。在土地利用转型视角下,区域耕地、非农建设用地规模对设施农用地规模的作用机制及其空间效应尚不明确。论文基于第二、三次全国土地利用调查数据(简称为“二调”和“三调”),运用空间自相关分析、土地利用转移矩阵等方法,系统分析泰安市设施农用地的空间演变特征及其关键影响因素。研究发现:① 二调至三调期间,泰安市设施农用地规模总量相对稳定,但净变化剧烈,耕地、非农建设用地分别是设施农用地主要的转入来源、退出去向;② 泰安市设施农用地呈现出从县城中心向外围推移的规律性,远城区集聚趋势不断加强;③ 二调时期,耕地规模促进设施农用地扩张,而三调时期,耕地规模抑制设施农用地增长,并且在远离县城的乡镇表现更为显著;④ 二调、三调时期非农建设用地均稳定促进设施农用地扩张,这一作用在空间上普遍存在。研究结论可为耕地“非粮化”“非农化”治理以及设施农用地的空间布局调整提供理论支撑。
陈韵凌 , 王茂军 . 泰安市设施农用地的时空格局演变与影响因素[J]. 地理科学进展, 2023 , 42(1) : 116 -130 . DOI: 10.18306/dlkxjz.2023.01.010
Facility agricultural land (FAL) is an important spatial carrier of non-grain agricultural production. Under the current land use transition, the impact of regional arable and construction land scales on the scale of FAL and their spatial effects are unclear. Based on the data of the second (2008) and third (2018) national land surveys, this study used spatial autocorrelation analysis and land use transfer matrix to systematically analyze the spatial evolution characteristics of the FAL in Tai'an City and the key influencing factors, in an attempt to provide some theoretical support for the management of "non-grain" and "non-agricultural" transition of arable land and the spatial layout adjustment of FAL. The results show that: 1) During the decade between 2008 and 2018, the total area of FAL in Tai'an City was relatively stable, but the net change was dramatic, and arable land and construction land were the main sources and destinations for transferring FAL, respectively. 2) The FAL showed a spatial pattern of moving from the center of the counties/districts to the periphery, with an increasing trend of agglomeration in distant urban areas. 3) During the second national land survey period, the scale of arable land promoted the expansion of FAL, while during the third national land survey period, the scale of arable land inhibited the growth of FAL and the effect was more significant in townships far away from the county seats. 4) During both the second and the third national land surveys, construction land steadily promoted the expansion of facility agricultural land, and this effect was widespread in space.
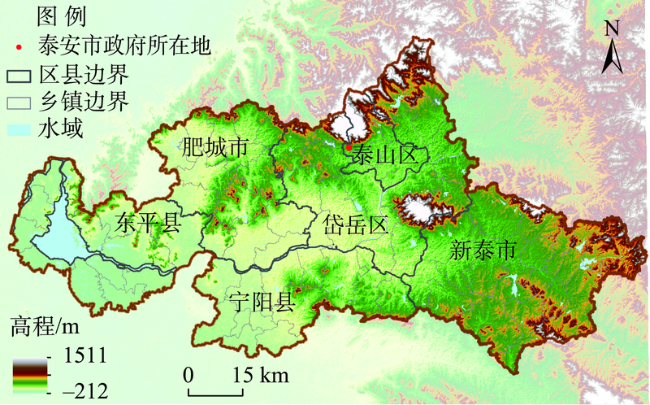
表1 设施农用地面积数量变化情况Tab.1 Changes in the area of facility agricultural land (hm2) |
| 项 目 | 市区 | 新泰市 | 宁阳县 | 肥城市 | 东平县 | 合 计 | |
|---|---|---|---|---|---|---|---|
| 泰山区 | 岱岳区 | ||||||
| 二调 | 345.41 | 859.41 | 1334.68 | 866.21 | 818.70 | 662.35 | 4886.76 |
| 三调 | 218.61 | 870.24 | 1251.15 | 858.87 | 951.79 | 763.54 | 4914.20 |
| 总变化 | -126.80 | 10.83 | -83.53 | -7.34 | 133.09 | 101.19 | 27.44 |
| 净增加 | 101.47 | 442.73 | 704.42 | 442.26 | 538.43 | 584.82 | 2814.12 |
| 净减少 | 150.95 | 387.68 | 788.95 | 441.42 | 402.95 | 437.86 | 2609.81 |
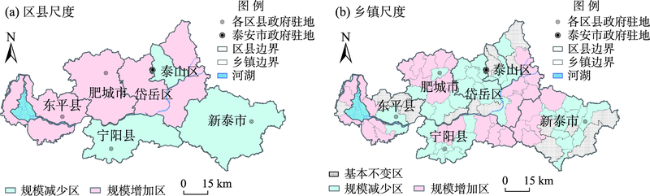
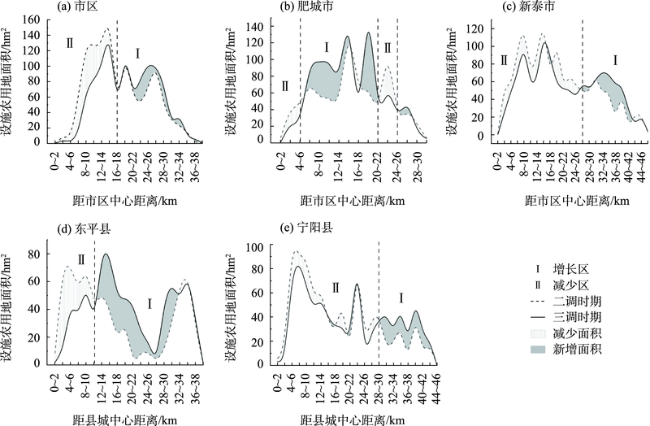
图5 泰安市二调至三调时期距区县中心不同距离的面积变化曲线Fig.5 Changes in the area of facility agricultural land with different distances from the county center in Tai'an City during the second (2008) and third (2018) national land surveys |
表2 泰安市各县市区过渡圈层、中心外围区位、地形坡度、城区人口规模Tab.2 Transitional zone, location, topographic slope, and urban population size of the counties/districts in Tai'an City |
| 区域 | 过渡圈层/km | 行政中心至质心距离/km | Ⅱ区平均坡度/(°) | 县城人口规模/万人 |
|---|---|---|---|---|
| 市区 | 16~18 | 9.80 | 6.79 | 67.28 |
| 肥城市 | 4~6 | 8.62 | 2.97 | 30.77 |
| 东平县 | 10~12 | 11.02 | 4.05 | 28.04 |
| 宁阳县 | 28~30 | 13.23 | 2.77 | 10.40 |
| 新泰市 | 26~28 | 14.70 | 5.28 | 35.82 |
表3 影响因素预期符号及描述性统计Tab.3 Expected direction of impact and descriptive statistics of influencing factors |
| 变量 | 符号 | 单位 | 预期 符号 | 二调时期 | 三调时期 | |||||||||
|---|---|---|---|---|---|---|---|---|---|---|---|---|---|---|
| 最小值 | 最大值 | 平均值 | 标准偏差 | 最小值 | 最大值 | 平均值 | 标准偏差 | |||||||
| 因变量 | 设施农用地面积 | FAL_area | hm2 | 0 | 144.10 | 55.53 | 31.94 | 0 | 145.60 | 55.84 | 32.75 | |||
| 自变量 | 耕地面积 | AL_area | hm2 | - | 3.79 | 11693.08 | 4275.77 | 2520.42 | 1.07 | 14498.59 | 4325.13 | 2891.82 | ||
| 非农建设用地面积 | NACL_area | hm2 | + | 268.03 | 4490.23 | 1398.82 | 730.24 | 310.46 | 8087.00 | 1848.19 | 1191.40 | |||
| 控制 变量 | 地形条件 | 坡度 | Slope | ° | - | 1.84 | 16.23 | 4.47 | 2.82 | 1.84 | 16.23 | 4.47 | 2.82 | |
| 区位条件 | 距县城中心距离 | Dcounty | km | + | 0.60 | 40.91 | 17.27 | 9.63 | 0.60 | 40.91 | 17.27 | 9.63 | ||
| 距市中心距离 | Dcity | km | + | 2.38 | 92.74 | 43.68 | 23.20 | 2.38 | 92.74 | 43.68 | 23.20 | |||
| 市场规模 | 省域市场规模 | MPit | + | 193.94 | 254.54 | 224.41 | 19.85 | 491.47 | 671.05 | 576.18 | 61.23 | |||
| 县城人口规模 | NCpop | 万人 | + | 9.82 | 47.67 | 25.03 | 10.26 | 10.4 | 53.59 | 27.11 | 12.81 | |||
| 社会 经济 发展 | 乡镇人口规模 | Pop | 万人 | + | 0.11 | 7.80 | 0.72 | 0.84 | 1.25 | 21.53 | 6.51 | 3.29 | ||
| 乡镇财政收入 | LFR | 万元 | + | 148.00 | 47814.00 | 3474.76 | 5615.91 | 468.00 | 94336.00 | 11122.92 | 17425.62 | |||
| 距公路最近距离 | ND_road | m | - | 4.12 | 1377.31 | 362.03 | 325.41 | 4.12 | 1377.31 | 362.03 | 325.41 | |||
| 非农就业人口占比 | NFP | % | +/- | 0.03 | 0.84 | 0.38 | 0.15 | |||||||
| 有效灌溉面积 | IR_area | hm2 | + | 0 | 31.60 | 12.79 | 7.51 | |||||||
| 政策调控 | 农村合作社 | RC | 个 | + | 0 | 146.00 | 54.11 | 31.34 | ||||||
| 农业技术服务机构 | ATS | 个 | + | 0 | 28.00 | 5.35 | 5.59 | |||||||
| 土地流转面积 | LT_area | 个 | + | 0 | 11753.20 | 820.64 | 1312.64 | |||||||
| 是否高效农业项目驻地乡镇 | EAP | 是/否 | + | 0 | 1.00 | 0.60 | 0.49 | |||||||
表4 回归分析结果Tab.4 Results of regression analyses |
| 变量名称 | 三调时期 | 二调时期 | |||||||
|---|---|---|---|---|---|---|---|---|---|
| 基准回归模型 | 稳健性检验 | ||||||||
| 模型1 | 模型2 | 模型3 | 模型4 | 模型5 (子样本) | 模型6 (子样本) | 模型7 | 模型8 | ||
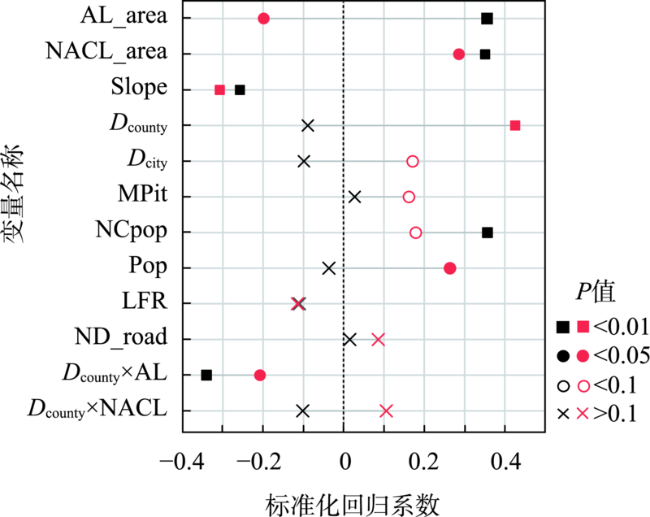
| 耕地面积(AL_area) | -0.172* (-1.832) | -0.199** (-2.162) | -0.207** (-2.639) | -0.227*** (-2.939) | -0.221*** (-2.682) | -0.231*** (-2.81) | 0.318*** (2.809) | 0.356*** (3.131) | |
| 非农建设用地面积(NACL_area) | 0.240** (2.385) | 0.286** (2.300) | 0.226** (2.537) | 0.289** (2.518) | 0.231** (2.136) | 0.256** (2.090) | 0.381*** (3.622) | 0.351*** (2.901) | |
| 坡度(Slope) | -0.326*** (-3.252) | -0.308*** (-3.098) | -0.224** (-2.479) | -0.236** (-2.645) | -0.250** (-2.491) | -0.259** (-2.597) | -0.250** (-2.518) | -0.258*** (-2.747) | |
| 距县城中心距离(Dcounty) | 0.410*** (4.198) | 0.426*** (4.452) | 0.323*** (3.836) | 0.360*** (4.154) | 0.350*** (3.891) | 0.390*** (3.981) | -0.013 (-0.124) | -0.089 (-0.840) | |
| 距市中心距离(Dcity) | 0.193* (1.847) | 0.171* (1.544) | 0.185** (2.008) | 0.186* (1.926) | 0.186* (1.912) | 0.177* (1.735) | -0.125 (-0.965) | -0.099 (-0.724) | |
| 省域市场规模(MPit) | 0.153 (1.604) | 0.162* (1.737) | 0.134* (1.703) | 0.153* (1.969) | 0.217** (2.355) | 0.217** (2.369) | 0.154 (1.079) | 0.027 (0.196) | |
| 县域市场规模(NCpop) | 0.144 (1.506) | 0.179* (1.899) | 0.247*** (2.793) | 0.264*** (3.044) | 0.186* (1.794) | 0.213** (2.054) | 0.183* (1.424) | 0.357*** (2.815) | |
| 乡镇人口规模(Pop) | 0.221** (1.981) | 0.264** (2.382) | 0.286* (1.753) | 0.328** (2.023) | 0.469** (2.286) | 0.461** (2.227) | -0.019 (-0.208) | -0.037 (-0.437) | |
| 乡镇财政收入(LFR) | -0.102 (-0.892) | -0.115 (-1.031) | 0.074 (0.764) | 0.038 (0.388) | 0.136 (1.405) | 0.098 (0.991) | -0.177 (-1.693) | -0.110 (-1.067) | |
| 距公路最近距离(ND_road) | 0.086 (0.873) | 0.086 (0.902) | 0.086 (1.055) | 0.101 (1.268) | 0.147 (1.606) | 0.148 (1.639) | 0.004 (0.035) | 0.015 (0.158) | |
| 非农就业人口占比(NFP) | -0.276 (-1.600) | -0.259 (-1.518) | -0.407* (-1.933) | -0.350 (-1.608) | |||||
| 有效灌溉面积(IR_area) | 0.361*** (3.057) | 0.335*** (2.891) | 0.288** (2.297) | 0.268** (2.152) | |||||
| 二调设施农用地(SecFAL_area) | -0.006 (-0.070) | -0.007 (-0.091) | -0.059 (-0.678) | -0.051 (-0.588) | |||||
| 农村合作社(RC) | 0.201** (2.211) | 0.172* (1.863) | 0.164* (1.693) | 0.160 (1.645) | |||||
| 农业技术服务机构(ATS) | 0.159** (2.136) | 0.168** (2.297) | 0.165** (1.999) | 0.186** (2.262) | |||||
| 土地流转面积 (LT_area) | -0.198** (-2.412) | -0.253*** (-2.851) | -0.237** (-2.616) | -0.269*** (-2.788) | |||||
| 是否高效农业项目驻地乡镇(EAP) | 0.146* (1.912) | 0.132* (1.713) | 0.057 (0.643) | 0.065 (0.708) | |||||
| Dcounty AL_area | -0.208** (-2.199) | -0.156** (-2.014) | -0.141* (-1.729) | -0.341*** (-3.204) | |||||
| Dcounty NACL_area | 0.106 (0.940) | 0.099 (0.955) | 0.068 (0.633) | -0.102 (-0.962) | |||||
| R² | 0.399 | 0.447 | 0.663 | 0.688 | 0.634 | 0.635 | 0.431 | 0.517 | |
| 调整后R² | 0.321 | 0.358 | 0.581 | 0.601 | 0.535 | 0.545 | 0.354 | 0.437 | |
| F | 5.114 | 5.049 | 8.099 | 7.892 | 6.405 | 6.042 | 5.600 | 6.424 | |
| Sig | < 0.001 | < 0.001 | < 0.001 | < 0.001 | < 0.001 | < 0.001 | < 0.001 | < 0.001 | |
| N | 88 | 88 | 88 | 88 | 80 | 80 | 88 | 88 | |
注:括号内为t统计量;*、**、***分别表示P < 0.1、P < 0.05、P < 0.01。 |
| [1] |
黄宗智. 中国的隐性农业革命(1980—2010): 一个历史和比较的视野[J]. 开放时代, 2016(2): 11-35, 5.
[
|
| [2] |
黄季焜. 四十年中国农业发展改革和未来政策选择[J]. 农业技术经济, 2018(3): 4-15.
[
|
| [3] |
李二玲, 胥亚男, 雍雅君, 等. 农业结构调整与中国乡村转型发展: 以河南省巩义市和鄢陵县为例[J]. 地理科学进展, 2018, 37(5): 698-709.
[
|
| [4] |
戚渊, 李瑶瑶, 朱道林. 农地资本化视角下的耕地非粮化研究[J]. 中国土地科学, 2021, 35(8): 47-56.
[
|
| [5] |
吴郁玲, 张佩, 于亿亿, 等. 粮食安全视角下中国耕地“非粮化”研究进展与展望[J]. 中国土地科学, 2021, 35(9): 116-124.
[
|
| [6] |
魏慧, 吕昌河, 刘亚群, 等. 青藏高原设施农业分布格局及变化[J]. 资源科学, 2019, 41(6): 1093-1101.
[
|
| [7] |
陈浮, 刘俊娜, 常媛媛, 等. 中国耕地非粮化空间格局分异及驱动机制[J]. 中国土地科学, 2021, 35(9): 33-43.
[
|
| [8] |
欧阳竹, 邓祥征, 孙志刚, 等. 面向国民经济主战场的区域农业研究[J]. 地理学报, 2020, 75(12): 2636-2654.
[
|
| [9] |
付慧, 刘艳军, 孙宏日, 等. 京津冀地区耕地利用转型时空分异及驱动机制[J]. 地理科学进展, 2020, 39(12): 1985-1998.
[
|
| [10] |
戈大专, 龙花楼, 杨忍. 中国耕地利用转型格局及驱动因素研究: 基于人均耕地面积视角[J]. 资源科学, 2018, 40(2): 273-283.
[
|
| [11] |
刘文超, 董金玮. 近20年来苏锡常地区建设用地扩展及耕地占用态势的遥感分析[J]. 地球信息科学学报, 2009, 11(4): 549-555, 534.
[
|
| [12] |
张浩, 冯淑怡, 曲福田. 耕地保护、建设用地集约利用与城镇化耦合协调性研究[J]. 自然资源学报, 2017, 32(6): 1002-1015.
[
|
| [13] |
黄春华, 吕靖童, 王志远, 等. 洞庭湖生态经济区城乡建设用地演变特征及驱动因素[J]. 科学技术与工程, 2021, 21(33): 14062-14073.
[
|
| [14] |
韩会然, 杨成凤, 宋金平. 北京市土地利用空间格局演化模拟及预测[J]. 地理科学进展, 2015, 34(8): 976-986.
[
|
| [15] |
刘纪远, 宁佳, 匡文慧, 等. 2010—2015年中国土地利用变化的时空格局与新特征[J]. 地理学报, 2018, 73(5): 789-802.
[
|
| [16] |
张涵, 李阳兵. 城郊土地利用功能演变: 以贵州省惠水县乡村旅游度假区好花红村为例[J]. 地理科学进展, 2020, 39(12): 1999-2012.
[
|
| [17] |
|
| [18] |
曹广忠, 马嘉文. 中国城镇化与非农化的空间分异、相互关系和形成机制[J]. 地理研究, 2016, 35(12): 2249-2260.
[
|
| [19] |
戴起伟, 曹静, 凡燕, 等. 面向现代设施农业应用的物联网技术模式设计[J]. 江苏农业学报, 2012, 28(5): 1173-1180.
[
|
| [20] |
盛平, 郭洋洋, 李萍萍. 基于ZigBee和3G技术的设施农业智能测控系统[J]. 农业机械学报, 2012, 43(12): 229-233.
[
|
| [21] |
边淑贞, 柳晓娟, 安子扬, 等. 我国典型设施蔬菜种植区农用地膜污染分析[J]. 环境科学与技术, 2015, 38(11): 76-81.
[
|
| [22] |
|
| [23] |
杜姗姗, 蔡建明, 郭华, 等. 食品安全导向下的都市农业发展模式: 以北京蔬菜生产为例[J]. 地理科学进展, 2012, 31(6): 783-791.
[
|
| [24] |
李中明, 沈军, 王仲, 等. 北京市日光温室与塑料大棚生产效益分析[J]. 中国蔬菜, 2011(S1): 13-19.
[
|
| [25] |
范成方, 史建民. 山东省大棚与露地蔬菜种植的经济和生态效益分析[J]. 农业现代化研究, 2012, 33(1): 108-112.
[
|
| [26] |
周敏, 雷国平, 李菁. 预期征地下设施农用地流转利益主体冲突机制研究: 以吉林省F市联盟村为例[J]. 中国土地科学, 2016, 30(1): 32-39.
[
|
| [27] |
谭智心, 张云华. 设施农业用地供需状况、政策执行困境与优化策略[J]. 改革, 2020(11): 109-118.
[
|
| [28] |
张震, 刘学瑜. 我国设施农业发展现状与对策[J]. 农业经济问题, 2015, 36(5): 64-70, 111.
[
|
| [29] |
侯琴, 孙鸿睿, 舒瑞. 基于灰色关联度的宁夏设施农用地变化及影响因素研究[J]. 农业科学研究, 2020, 41(4): 1-8, 13.
[
|
| [30] |
|
| [31] |
|
| [32] |
闫梦露, 王柏源, 赵小风, 等. 新型职业农民对城市郊区耕地利用“大棚化”转型的影响: 以南京市为例[J]. 地理科学进展, 2019, 38(9): 1294-1304.
[
|
| [33] |
孔祥天, 邵战林. 乡村振兴背景下我国设施农用地变化趋势探究[J]. 南方农业, 2020, 14(8): 91-92.
[
|
| [34] |
刘守英. 土地制度与中国发展[M]. 2版. 北京: 中国人民大学出版社, 2021.
[
|
| [35] |
张凤荣, 张小京, 周建. 都市区设施农业用地空间变化及其政策启示[J]. 资源科学, 2015, 37(4): 637-644.
[
|
| [36] |
匡远配, 刘洋. 农地流转过程中的“非农化”、“非粮化”辨析[J]. 农村经济, 2018(4): 1-6.
[
|
| [37] |
谈明洪, 李秀彬, 吕昌河. 20世纪90年代中国大中城市建设用地扩张及其对耕地的占用[J]. 中国科学(地球科学), 2004, 34(12): 1157-1165.
[
|
| [38] |
刘涛, 史秋洁, 王雨, 等. 中国城乡建设占用耕地的时空格局及形成机制[J]. 地理研究, 2018, 37(8): 1609-1623.
[
|
| [39] |
张占录, 李永梁. 开发区土地扩张与经济增长关系研究: 以国家级经济技术开发区为例[J]. 中国土地科学, 2007, 21(6): 4-9.
[
|
| [40] |
陈秧分, 刘玉, 李裕瑞. 中国乡村振兴背景下的农业发展状态与产业兴旺途径[J]. 地理研究, 2019, 38(3): 632-642.
[
|
| [41] |
|
| [42] |
|
| [43] |
|
| [44] |
刘彦随, 陆大道. 中国农业结构调整基本态势与区域效应[J]. 地理学报, 2003, 58(3): 381-389.
[
|
| [45] |
|
| [46] |
徐斐斐. 泰安市农业产业结构调整对策研究[D]. 泰安: 山东农业大学, 2016.
[
|
/
| 〈 |
|
〉 |
