
粤港澳大湾区保险业发展水平时空演变特征及对经济增长的影响
|
李琼(1972— ),女,湖南桑植人,教授,博士生导师,研究方向为区域经济与国民经济。E-mail: sisi_9672@163.com |
收稿日期: 2022-01-24
修回日期: 2022-06-22
网络出版日期: 2022-11-28
基金资助
广东省科学院建设国内一流研究机构行动专项项目(2021GDASYL-20210401001)
国家自然科学基金项目(42130712)
国家社会科学基金项目(2021BJY099)
湖南省自然科学基金面上项目(2020JJ4503)
湖南省研究生科研创新项目(CX20211047)
国家民委课题(2021-GMB-038)
Spatial and temporal features of insurance industry development level and its impact on economic growth in the Guangdong-Hong Kong-Macao Greater Bay Area
Received date: 2022-01-24
Revised date: 2022-06-22
Online published: 2022-11-28
Supported by
GDAS Special Project of Science and Technology Development(2021GDASYL-20210401001)
National Natural Science Foundation of China(42130712)
National Social Science Foundation of China(2021BJY099)
Natural Science Foundation of Hunan Province(2020JJ4503)
Hunan Provincial Postgraduate Research Innovation Project(CX20211047)
Project of National Ethnic Affairs Commission(2021-GMB-038)
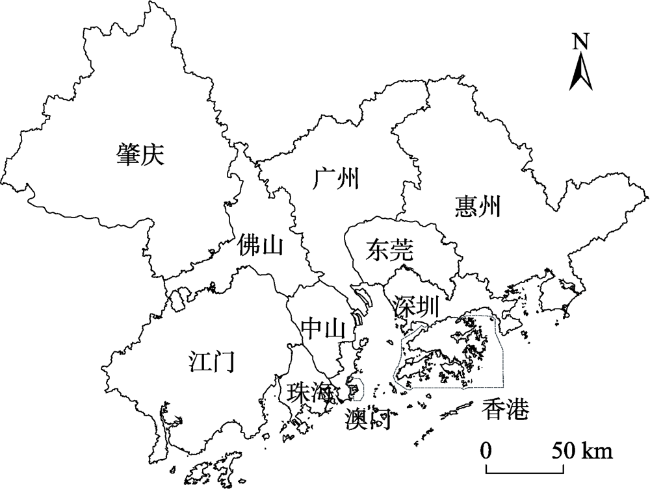
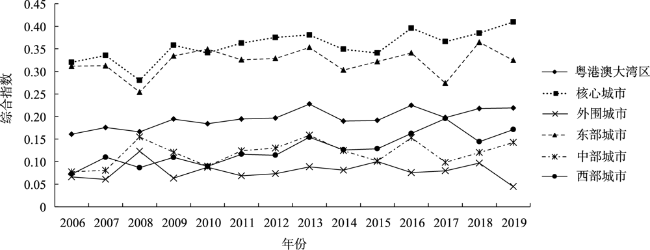
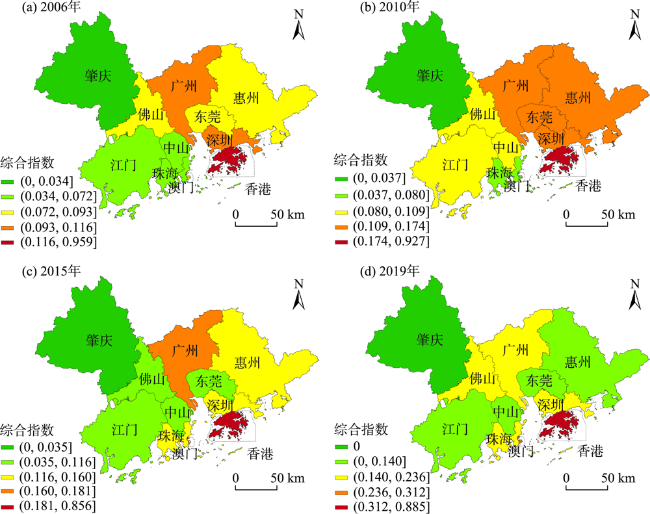
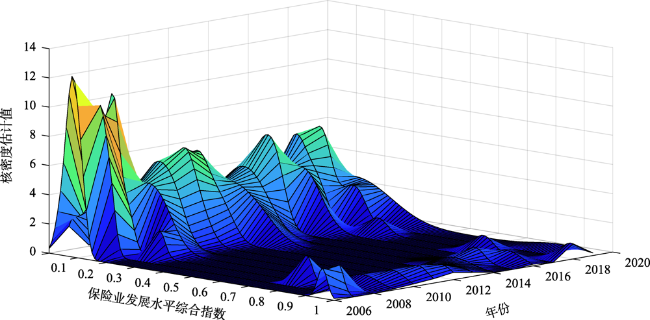
保险业在中国经济发展、转型和产业升级等方面发挥着越来越重要的作用。论文利用粤港澳大湾区2006—2019年的市级面板数据,运用熵权、核密度估计和空间计量等方法,研究粤港澳大湾区保险业发展水平时空特征及其对经济增长的影响,结果表明:① 保险业发展水平综合指数在波动中上升,11个城市保险业发展水平呈现香港、澳门和广州单核领跑大湾区东、中、西部的特征,珠三角9市呈现广州、深圳和珠海单核领跑广佛肇、深莞惠和珠中江三大经济圈的特征;② 11个城市保险业发展水平存在两极分化现象,但高值区与低值区的绝对差异有缩小趋势,低值区城市之间的差距有扩大趋势;③ 保险业发展对本地区经济增长产生了显著的正向影响,在其他影响因素保持不变的情况下,保险业发展水平每提升1%,本地区经济增长0.0538%。保险业发展具有负溢出效应,但未通过显著性检验。研究成果为粤港澳大湾区相关部门制定保险业与经济发展相互促进的产业政策提供了理论依据。
李琼 , 殷悦 , 张蓝澜 , 董梁 , 张文涛 . 粤港澳大湾区保险业发展水平时空演变特征及对经济增长的影响[J]. 地理科学进展, 2022 , 41(9) : 1743 -1754 . DOI: 10.18306/dlkxjz.2022.09.015
The insurance industry is playing an increasingly important role in China's economic development, transformation and industrial upgrading. Based on the city panel data of the Guangdong-Hong Kong-Macao Greater Bay Area (GBA) from 2006 to 2019 and using entropy weights, kernel density estimation, and spatial econometric methods, this study examined the spatial-temporal characteristics of the development level of the insurance industry in the area and its impact on economic growth. The findings are as follows: 1) The comprehensive index of insurance industry development level increased with fluctuation. The insurance industry development level in 11 cities of the GBA showed the characteristics of Hong Kong, Macao, and Guangzhou leading in the eastern, central, and western regions, and Guangzhou, Shenzhen, and Zhuhai leading in the three economic circles of Guangzhou-Foshan-Zhaoqing, Shenzhen-Dongguan-Huizhou, and Zhuhai-Zhongshan-Jiangmen. 2) The development level of the insurance industry in the 11 cities is polarized, but the absolute difference between high-value and low-value regions tends to decrease, and the gap between low-value areas tends to widen. 3) The development of the insurance industry has a significant positive impact on regional economic growth. If other influencing factors remain unchanged, each 1% increase in the development level of the insurance industry will result in a regional economic growth of 0.0538%. The development of the insurance industry has negative spillover effect, but it does not pass the significance test. The research results provide a theoretical basis for relevant departments in the Greater Bay Area to formulate industrial policies that promote the insurance industry and economic development mutually.
表1 粤港澳大湾区保险业发展水平综合评价指标体系Tab.1 Comprehensive evaluation index system for the development level of the insurance industry in the Guangdong-Hong Kong-Macao Greater Bay Area |
| 目标层 | 指标层 | 指标说明 | 权重 |
|---|---|---|---|
| 保险业发展水平综合指数 | 保费收入(亿元) | 一定期间的保费收入 | 0.230 |
| 保险密度(元/人) | 保费收入/常住人口数 | 0.181 | |
| 保险深度(%) | 保费收入/GDP | 0.132 | |
| 赔付支出(亿元) | 一定期间的保险赔付支出 | 0.276 | |
| 赔付率(%) | 赔付支出/保费收入 | 0.055 | |
| 保费收入增长率(%) | (当年总保费收入-上年总保费收入)/上年总保费收入 | 0.057 | |
| 赔付支出增长率(%) | (当年赔付支出-上年赔付支出)/上年赔付支出 | 0.069 |
注:各指标权重通过熵值法计算得到。 |
表2 各变量的定义及符号表示Tab.2 Definition and symbolic representation of the variables |
| 变量类型 | 变量名 | 定义 | 符号 | 单位 |
|---|---|---|---|---|
| 被解释变量 | 经济发展水平 | 人均GDP的对数 | ln Y | — |
| 核心解释变量 | 保险业发展水平 | 保险业发展水平综合指数的对数 | ln I | — |
| 固定资本投入 | 人均固定资产投资额的对数 | ln K | — | |
| 劳动投入 | 从业人员数占常住人口比重的对数 | ln L | — | |
| 控制变量 | 科技发展水平 | 人均R&D经费支出的对数 | ln sci | — |
| 对外贸易程度 | 进出口总额/GDP×100% | open | % | |
| 政府支持程度 | 财政支出/GDP×100% | gov | % | |
| 产业结构 | 第二产业增加值/GDP×100% | ind | % |
表3 空间和时间固定效应的联合显著性检验Tab.3 Joint significance tests for spatial and temporal fixed effects |
| 类型 | LR统计量 | 自由度 | P值 |
|---|---|---|---|
| 时间固定 | 201.2336 | 14 | <0.0001 |
| 空间固定 | 5.3558 | 11 | 0.9127 |
| 时间和空间固定 | 126.6811 | 14 | <0.0001 |
表4 时间固定效应模型的参数估计与LM检验Tab.4 Parameter estimates and LM tests for the time fixed effects model |
| 变量 | 回归系数 | t统计量 | P值 |
|---|---|---|---|
| ln I | 0.0505 | 2.5115 | 0.0131 |
| ln K | 0.4214 | 8.0366 | <0.0001 |
| ln L | 0.3098 | 2.5694 | 0.0112 |
| ln sci | 0.2797 | 13.9342 | <0.0001 |
| open | 0.0016 | 7.3494 | <0.0001 |
| gov | 0.0054 | 2.8759 | 0.0046 |
| ind | -0.0073 | -6.8146 | <0.0001 |
| R2 | 0.9266 | ||
| LM检验 | 卡方统计量 | P值 | |
| LM检验(rho=0) | 9.4339 | 0.002 | |
| R-LM检验(rho=0) | 0.4325 | 0.511 | |
| LM检验(lambda=0) | 12.4136 | <0.001 | |
| R-LM检验(lambda=0) | 3.4122 | 0.065 |
表5 空间面板模型的回归结果Tab.5 Regression results of the spatial panel model |
| 变量 | SPLM | SPEM | SPDM |
|---|---|---|---|
| ln I | 0.0376** (1.9625) | 0.0374** (2.0284) | 0.0307* (1.7565) |
| ln K | 0.4184*** (8.3975) | 0.4137*** (7.9970) | 0.4045*** (7.8746) |
| ln L | 0.2889** (2.5172) | 0.4089*** (3.4214) | 0.3424*** (2.9222) |
| ln sci | 0.2741*** (14.3781) | 0.2365*** (10.7667) | 0.1946*** (7.4910) |
| open | 0.0020*** (8.5962) | 0.0013 (7.1200) | 0.0018*** (5.4713) |
| gov | 0.0076*** (4.2596) | 0.0097*** (4.8964) | 0.0146*** (6.4139) |
| ind | -0.0096*** (-8.9538) | -0.0092*** (-8.4761) | -0.0130*** (-9.9658) |
| W·ln I | — | — | -0.0697 (-1.2336) |
| W·ln K | — | — | 0.3607*** (4.0301) |
| W·ln L | — | — | 0.3704** (1.9296) |
| W·lnsci | — | — | -0.0289 (-0.5651) |
| W·open | — | — | -0.0003 (-0.5475) |
| W·gov | — | — | 0.0202*** (4.4806) |
| W·ind | — | — | -0.0117*** (-4.1497) |
| rho | -0.3420*** | — | -0.6240*** |
| Lambda | — | -0.5830*** | — |
| 时间 | YES | YES | YES |
| R2 | 0.9466 | 0.9593 | 0.9622 |
| Wald(空间滞后) | 20.3449*** | — | — |
| Wald(空间误差) | — | 23.3241*** | — |
注:*、**、***分别表示通过0.1、0.05、0.01显著性水平检验,括号内为t值,下同;W·ln I、W·ln K、W·ln L、W·lnsci、W·open、W·gov、W·ind表示各对应变量的空间滞后项。 |
表6 空间杜宾模型的直接效应和间接效应Tab.6 Direct and indirect effects of the spatial Durbin model |
| 变量 | 非标准化回归系数 | 标准化回归系数 | |||||
|---|---|---|---|---|---|---|---|
| 直接效应 | 间接效应 | 总体效应 | 直接效应 | 间接效应 | 总体效应 | ||
| ln I | 0.0538** (2.5711) | -0.0784 (-1.6376) | -0.0245 (-0.6127) | 0.0732** (2.6076) | -0.1052 (-1.5701) | -0.0320 (-0.5616) | |
| ln K | 0.3784*** (6.7332) | 0.0940 (1.3519) | 0.4724*** (6.8197) | 0.3049*** (6.8370) | 0.0760 (1.3887) | 0.3809*** (6.9972) | |
| ln L | 0.3086*** (2.6125) | 0.1350 (0.9331) | 0.4436** (2.7086) | 0.0651** (2.6763) | 0.0282 (0.8993) | 0.0934** (2.6293) | |
| ln sci | 0.2323** (9.4778) | -0.1311*** (-3.7594) | 0.1012** (2.4280) | 0.4272*** (9.3109) | -0.2378*** (-3.6709) | 0.1894** (2.4967) | |
| open | 0.0021*** (4.9853) | -0.0012** (-2.4787) | 0.0009*** (3.4322) | 0.2581*** (4.8310) | -0.1422** (-2.2883) | 0.1158*** (3.4422) | |
| gov | 0.0117*** (5.6908) | 0.0096** (2.8782) | 0.0213*** (5.1692) | 0.2233*** (6.1242) | 0.1732** (2.9381) | 0.3965*** (5.5659) | |
| ind | -0.0121*** (-8.9292) | -0.0031 (-1.4366) | -0.0152*** (-6.5754) | -0.4148*** (-9.3201) | -0.1048 (-1.3912) | -0.5196*** (-6.8317) | |
| [1] |
王向楠, 吴婷. 保险发展、产业间资源配置与经济增长[J]. 金融评论, 2019, 11(6): 36-55, 121.
[
|
| [2] |
王韧, 农通理, 张双双. 基于空间杜宾模型的保险业发展时空格局研究[J]. 保险研究, 2020(10): 48-64.
[
|
| [3] |
|
| [4] |
|
| [5] |
|
| [6] |
李恩龙, 杨永春, 史坤博, 等. 省域视角下中国保险业市场的时空特征[J]. 经济地理, 2017, 37(5): 116-124.
[
|
| [7] |
田小文, 郑理, 徐雷. 中国保险业发展的时空分异特征及动态演变[J]. 经济地理, 2021, 41(9): 135-144.
[
|
| [8] |
田乾, 金怀玉. 中国保险业发展的空间集聚效应分析[J]. 统计与决策, 2016(13): 152-155.
[
|
| [9] |
洪梅, 黄华珍, 焦俊勇. 我国保险业增长影响因素研究[J]. 保险研究, 2014(2): 11-22.
[
|
| [10] |
杨汇潮, 江生忠. 城镇化促进保险业发展研究: 基于面板数据[J]. 保险研究, 2014(8): 82-92.
[
|
| [11] |
|
| [12] |
|
| [13] |
|
| [14] |
|
| [15] |
|
| [16] |
黄英君, 陈晔婷. 中国保险业发展与经济增长关系研究: 基于VAR模型的实证分析[J]. 保险研究, 2012(1): 36-41.
[
|
| [17] |
|
| [18] |
温健, 何小伟, 万润坤. 保险发展对我国各省份经济增长的非线性影响: 基于门限模型的实证检验[J]. 中央财经大学学报, 2017(6): 30-37.
[
|
| [19] |
徐阳, 屈广玉. 保险消费、区域金融差异与经济增长的动态关系研究: 基于非线性面板模型的实证分析[J]. 保险研究, 2017(3): 39-55.
[
|
| [20] |
陈华, 齐红梅. 我国保险业的地区差异及协调发展[J]. 江西财经大学学报, 2008(2): 38-41.
[
|
| [21] |
葛杨. 粤港澳大湾区保险业互联互通机制初步探究[J]. 港澳研究, 2019(4): 74-81, 96.
[
|
| [22] |
冯俊建. 我国保险业发展区域差异对实体经济增长的影响研究[D]. 青岛: 青岛大学, 2018.
[
|
| [23] |
肖攀, 李连友, 苏静. 保险业发展水平门槛与中国经济增长的动态均衡[J]. 山西财经大学学报, 2015, 37(10): 33-43.
[
|
| [24] |
张一静. 我国保险业发展的影响因素区域差异研究[D]. 济南: 山东大学, 2018.
[
|
| [25] |
宋昌耀, 李沅曦, 罗心然, 等. 经济外部性对中国保险业空间集聚的影响[J]. 经济地理, 2021, 41(1): 104-113, 120.
[
|
| [26] |
郭付友, 佟连军, 刘志刚, 等. 山东省产业生态化时空分异特征与影响因素: 基于17地市时空面板数据[J]. 地理研究, 2019, 38(9): 2226-2238.
[
|
| [27] |
蒋海兵, 李业锦. 京津冀地区制造业空间格局演化及其驱动因素[J]. 地理科学进展, 2021, 40(5): 721-735.
[
|
| [28] |
|
| [29] |
安宁, 马凌, 朱竑. 政治地理视野下的粤港澳大湾区发展思考[J]. 地理科学进展, 2018, 37(12):1633-1643.
[
|
| [30] |
尹佳璇, 谢逸翔, 黄嵩. 基于保险职能视角下保险业对经济增长的动态传导机制研究[J]. 哈尔滨商业大学学报(社会科学版), 2018(5): 68-76.
[
|
| [31] |
马佳羽, 韩兆洲, 蒋青嬗. 粤港澳大湾区经济发展: 空间格局、影响因素与启示: 基于两级行政区分层数据[J]. 数量经济技术经济研究, 2021, 38(11): 43-61.
[
|
/
| 〈 |
|
〉 |