
可渗透性环境对盗窃犯罪分布的影响及社会解组的调节作用——兼论街道眼理论与防卫空间理论的适用性
|
张延吉(1989— ),男,上海人,博士,副教授,硕士生导师,研究方向为社会地理学和环境犯罪学。E-mail: chairman7up@126.com |
收稿日期: 2021-10-18
修回日期: 2021-12-18
网络出版日期: 2022-08-28
基金资助
国家社会科学基金青年项目(21CSH006)
The influence of permeable built environment on theft crime pattern and the moderation effects of social disorganization: Applicability of street eyes and defensible place theories
Received date: 2021-10-18
Revised date: 2021-12-18
Online published: 2022-08-28
Supported by
Youth Program of National Social Science Foundation of China(21CSH006)
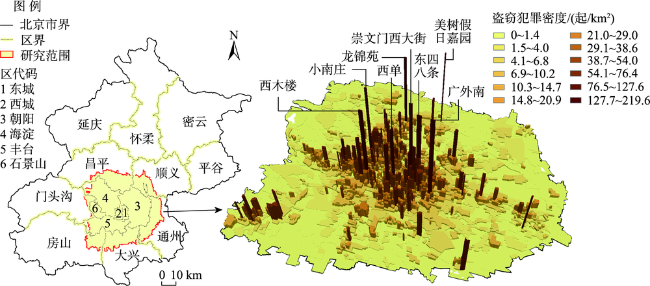
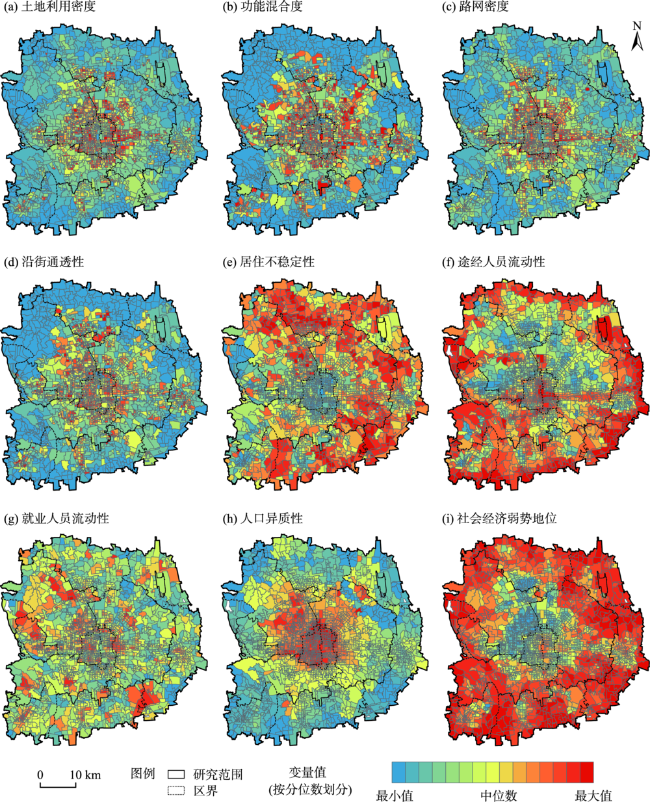
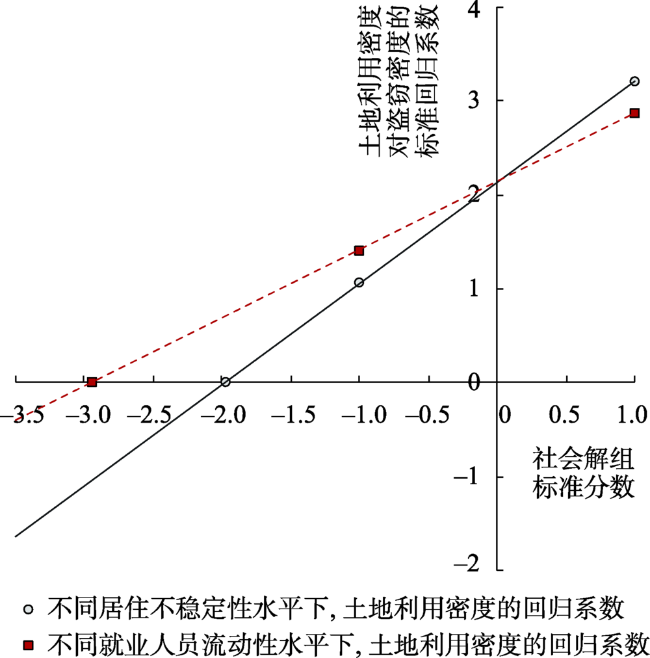
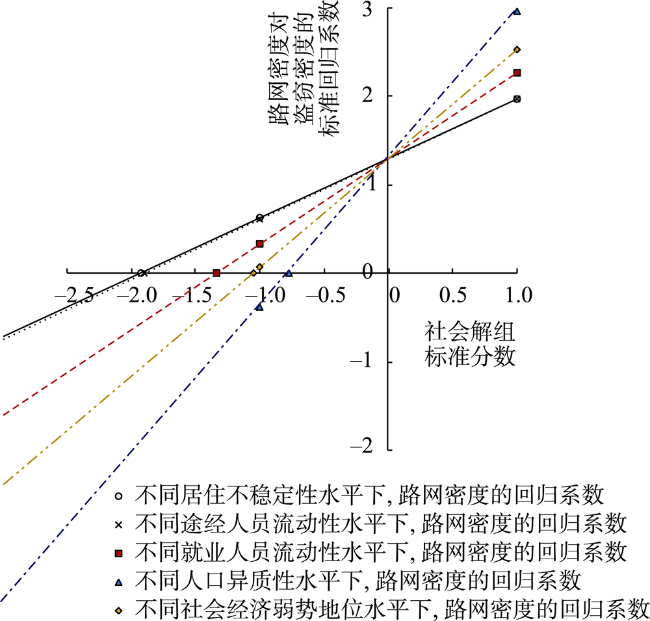
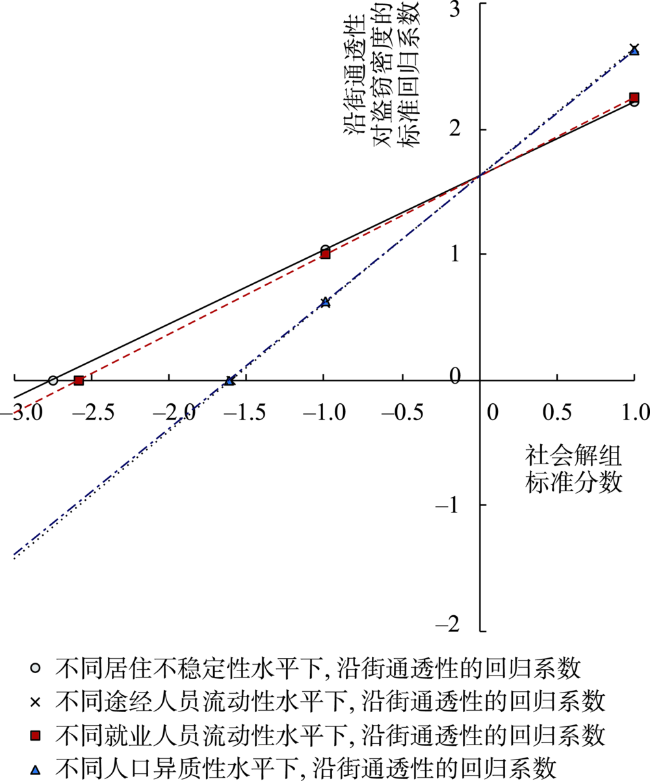
为揭示街道眼与防卫空间理论的分歧源头和适用条件,论文以北京中心城区为研究范围,整合法律文书、定位服务、街景图像、兴趣点等多源大数据,将犯罪机会与社会生态理论置于同一分析框架,探讨了可渗透性环境对盗窃犯罪分布的影响以及社会解组因素的调节作用。结果表明,土地利用密度、功能混合度、路网密度、沿街通透性等可渗透性特征与盗窃密度整体呈现正向关联。建成环境对犯罪行为的影响因社会生态分异而变化,随着居住不稳定性、途经人员流动性、就业人员流动性、人口异质性、社会经济弱势地位等社会解组程度的加深,可渗透性环境的犯罪引致作用将不断放大,防卫空间理论更具适用性。而在社会结构稳定的社区中,街道眼能够发挥自然监控作用,街道眼理论的解释力更强,现实生活中该类社区仍属少数,盲目采用新城市主义设计方法恐会加剧安全风险。
张延吉 , 林钦熙 , 朱春武 , 茅明睿 , 姜冬睿 . 可渗透性环境对盗窃犯罪分布的影响及社会解组的调节作用——兼论街道眼理论与防卫空间理论的适用性[J]. 地理科学进展, 2022 , 41(6) : 1041 -1052 . DOI: 10.18306/dlkxjz.2022.06.008
To unravel the conditions of application of street eyes theory and defensible space theory as well as the reasons of their theoretical dispute, this study took the central urban area of Beijing as research area and systematically explored the impacts of the permeable built environment on theft crime and the moderation effects of social disorganization on such relationships by integrating crime opportunity theory and social ecology theory. Big data from multiple sources during 2016 to 2020, including court records, location-based service data, street view images, points of interest, and road networks were used together. The results indicate that characteristics of permeable built environment such as land use density, mixing degree of urban functions, road network density, and transparency of street buildings all have positive and significant associations with the density of theft crimes in general. Furthermore, the direction and intensity of incluence of built environment features on criminal activities vary depending on the social ecological factors of communities. In other words, the degrees of social disorganization moderate the links between permeable environment and theft distribution. With social disorganization exacerbating, including the increase in residential instability, visitor mobility, employee mobility, population heterogeneity, and socioeconomic disadvantages, the positive effects of permeable built environment on crime will be steadily magnified, which more conforms to the defensible space theory. On the contrary, street eyes theory has better explanatory power in communities with stable social structure and abundant social capital where street eyes can be activated so as to provide effective informal surveillance to ensure safety. Unfortunately, according to the critical value of moderators estimated by the regression models, the later situation is less common in Beijing, suggesting that defensible space theory is more applicable in the majority of communities and the safety risks would increase when applying the approach of New Urbanism.
表1 变量说明及描述统计Tab.1 Measurement and descriptive statistics of variables |
| 变量名 | 释义 | 均值 | 标准差 |
|---|---|---|---|
| 被解释变量 | |||
| 盗窃犯罪密度 | 2016—2020年盗窃总数/社区面积(起/km2) | 7.95 | 15.78 |
| 解释变量 | |||
| 土地利用密度 | 容积率=总建筑面积/社区面积 | 1.00 | 0.78 |
| 功能混合度 | HHj=- ,其中Sij为社区j中i类POI占该社区POI总数的比重,xi为研究范围内i类POI占POI总数的比重 | -0.81 | 0.60 |
| 路网密度 | 路网密度=(干道长度+支路长度)/社区面积(km/km2) | 6.06 | 3.23 |
| 沿街通透性 | 各街景图像的通透性评分均值 | 0.92 | 0.48 |
| 调节变量 | |||
| 居住不稳定性 | 外来人口数/居住人口数 | 0.49 | 0.12 |
| 途经人员流动性 | 途经人口数/定位人口数 | 0.37 | 0.22 |
| 就业人员流动性 | 就业人口数/定位人口数 | 0.33 | 0.24 |
| 人口异质性 | 每套住房成交单价的标准差,无成交社区记为0(万元) | 1.41 | 0.61 |
| 社会经济弱势地位 | 非本科学历居住人口数/居住人口数 | 0.74 | 0.10 |
| 混淆变量 | |||
| 商业设施密度 | (零售+餐饮+批发市场+宾馆POI数)/社区面积(个/km2) | 199.04 | 503.18 |
| 公交站密度 | 公交站POI数/社区面积(个/km2) | 3.51 | 6.63 |
| 地铁站密度 | 地铁站POI数/社区面积(个/km2) | 0.60 | 3.94 |
| 对外交通站场密度 | (汽车站+火车站+机场POI数)/社区面积(个/km2) | 0.06 | 3.41 |
| 娱乐设施密度 | (KTV+游戏厅+网吧+酒吧+舞厅+棋牌室+洗浴按摩+影剧院POI数)/社区面积(个/km2) | 4.86 | 12.26 |
| 派出所密度 | 派出所POI数/社区面积(个/km2) | 1.64 | 5.31 |
| 空间失序 | 各街景图像的空间失序要素数量均值 | 3.94 | 2.34 |
| 盗窃犯罪密度滞后项 | Q相邻社区的平均盗窃犯罪密度(起/km2) | 7.41 | 14.93 |
表2 盗窃分布影响因素的回归分析结果Tab.2 Regression analysis results of the influencing factors of theft distribution |
| 变量 | 模型1 | 模型2 | 模型3 | 模型4 | 模型5 | 模型6 |
|---|---|---|---|---|---|---|
| 土地利用密度 | 1.985*** | 2.032*** | 2.138*** | 2.013*** | 1.940*** | 1.893*** |
| 功能混合度 | 1.524*** | 1.356*** | 1.298*** | 1.588*** | 1.320*** | 1.299*** |
| 路网密度 | 1.307*** | 1.199*** | 1.121** | 1.019** | 1.294*** | 1.151** |
| 沿街通透性 | 1.252* | 1.101* | 1.070+ | 1.016+ | 0.869+ | 1.620** |
| 居住不稳定性 | 0.872** | 1.162*** | 1.048** | 1.031** | 1.021** | |
| 途经人员流动性 | 1.551*** | 1.526*** | 1.350*** | 1.429*** | 1.554*** | |
| 就业人员流动性 | 1.079*** | 1.048** | 0.962** | 1.022** | 1.055*** | |
| 人口异质性 | 1.878*** | 1.893*** | 2.015*** | 1.798*** | 1.819*** | |
| 社会经济弱势地位 | 0.878* | 1.139* | 1.114* | 0.967* | 0.904* | |
| 土地利用密度×居住不稳定性 | 1.077** | |||||
| 土地利用密度×途经人员流动性 | 0.332 | |||||
| 土地利用密度×就业人员流动性 | 0.726* | |||||
| 土地利用密度×人口异质性 | 0.257 | |||||
| 土地利用密度×社会经济弱势地位 | 0.205 | |||||
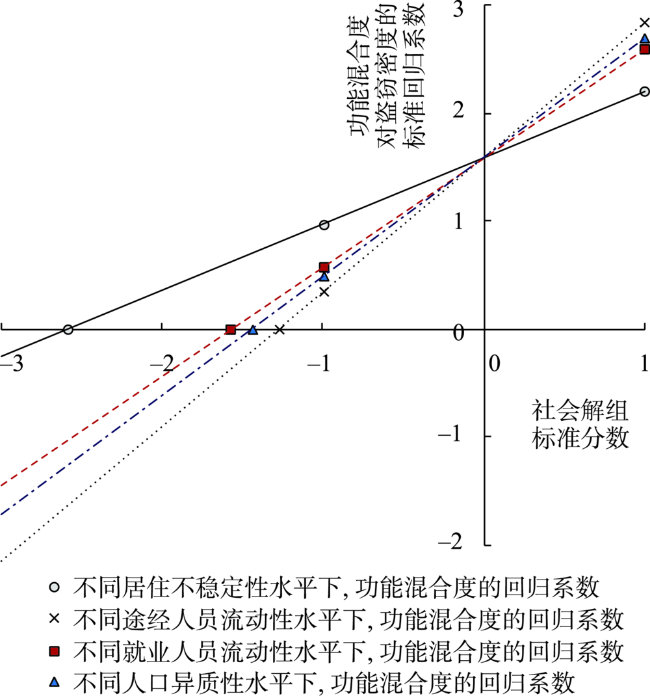
| 功能混合度×居住不稳定性 | 0.614* | |||||
| 功能混合度×途经人员流动性 | 1.247*** | |||||
| 功能混合度×就业人员流动性 | 1.010*** | |||||
| 功能混合度×人口异质性 | 1.103** | |||||
| 功能混合度×社会经济弱势地位 | -0.492 | |||||
| 路网密度×居住不稳定性 | 0.672* | |||||
| 路网密度×途经人员流动性 | 0.680* | |||||
| 路网密度×就业人员流动性 | 0.967** | |||||
| 路网密度×人口异质性 | 1.669*** | |||||
| 路网密度×社会经济弱势地位 | 1.229** | |||||
| 沿街通透性×居住不稳定性 | 0.588* | |||||
| 沿街通透性×途经人员流动性 | 1.014** | |||||
| 沿街通透性×就业人员流动性 | 0.626* | |||||
| 沿街通透性×人口异质性 | 1.001** | |||||
| 沿街通透性×社会经济弱势地位 | 0.449 | |||||
| 商业设施密度 | 2.196*** | 2.028*** | 2.003*** | 2.395*** | 1.986*** | 1.945*** |
| 公交站密度 | -0.829** | -0.436 | -0.428 | -0.298 | -0.258 | -0.425 |
| 地铁站密度 | 0.531+ | 0.341 | 0.337 | 0.482+ | 0.248 | 0.297 |
| 对外交通站场密度 | 0.975*** | 0.838** | 0.830** | 1.014*** | 0.850** | 0.860** |
| 娱乐设施密度 | 1.512*** | 1.691*** | 1.693*** | 1.593*** | 1.802*** | 1.775*** |
| 派出所密度 | 0.440 | 0.363 | 0.454 | 0.553+ | 0.439 | 0.340 |
| 空间失序 | 1.362** | 1.254* | 1.265* | 0.995+ | 1.063* | 1.561** |
| 盗窃犯罪密度滞后项 | 1.696*** | 1.785*** | 1.921*** | 1.718*** | 1.856*** | 1.839*** |
| 常数 | 8.010*** | 8.011*** | 8.194*** | 7.768*** | 8.087*** | 8.033*** |
| R2 | 0.350 | 0.385 | 0.391 | 0.405 | 0.401 | 0.396 |
| F值 | 46.200 | 37.940 | 30.200 | 31.920 | 31.680 | 30.810 |
注:***、**、*、+分别表示在0.001、0.01、0.05、0.1的统计水平上显著。 |
图4 功能混合度与社会解组的交互效应Fig.4 Interactions between mixing degree of urban functions and social disorganization |
图5 路网密度与社会解组的交互效应Fig.5 Interactions between road network density and social disorganization |
| [1] |
|
| [2] |
|
| [3] |
|
| [4] |
|
| [5] |
|
| [6] |
|
| [7] |
|
| [8] |
|
| [9] |
|
| [10] |
|
| [11] |
柳林, 姜超, 周素红, 等. 城市入室盗窃犯罪的多尺度时空格局分析: 基于中国H市DP半岛的案例研究[J]. 地理研究, 2017, 36(12): 2451-2464.
[
|
| [12] |
肖露子, 柳林, 宋广文, 等. 基于理性选择理论的社区环境对入室盗窃的影响研究[J]. 地理研究, 2017, 36(12): 2479-2491.
[
|
| [13] |
张延吉, 朱春武, 秦波. 犯罪数量与危害的空间分布及建成环境影响: 基于北京市刑事案件的纵向研究[J]. 地理科学进展, 2019, 38(12): 1876-1889.
[
|
| [14] |
|
| [15] |
|
| [16] |
|
| [17] |
|
| [18] |
|
| [19] |
|
| [20] |
|
| [21] |
|
| [22] |
|
| [23] |
|
| [24] |
|
| [25] |
|
| [26] |
|
| [27] |
|
| [28] |
|
| [29] |
|
| [30] |
|
| [31] |
|
| [32] |
|
| [33] |
|
| [34] |
|
| [35] |
|
| [36] |
|
| [37] |
|
| [38] |
|
| [39] |
|
| [40] |
|
| [41] |
|
| [42] |
|
| [43] |
|
| [44] |
|
/
| 〈 |
|
〉 |