
PM2.5污染对中国人口死亡率的影响——基于346个城市面板数据的实证分析
|
陈镘(1998— ),女,广东潮州人,硕士生,主要研究方向为健康地理。E-mail: chenm253@mail2.sysu.edu.cn |
收稿日期: 2021-10-22
修回日期: 2021-12-26
网络出版日期: 2022-08-28
基金资助
国家自然科学基金项目(42171196)
国家自然科学基金项目(41930646)
国家自然科学基金项目(41971194)
中央高校基本科研业务费项目(20lgzd10)
中国博士后科学基金项目(2020M683149)
Effects of PM2.5 concentration on mortality in China: A study based on city-level panel data
Received date: 2021-10-22
Revised date: 2021-12-26
Online published: 2022-08-28
Supported by
National Natural Science Foundation of China(42171196)
National Natural Science Foundation of China(41930646)
National Natural Science Foundation of China(41971194)
The Fundamental Research Funds for the Central Universities(20lgzd10)
China Postdoctoral Science Foundation(2020M683149)
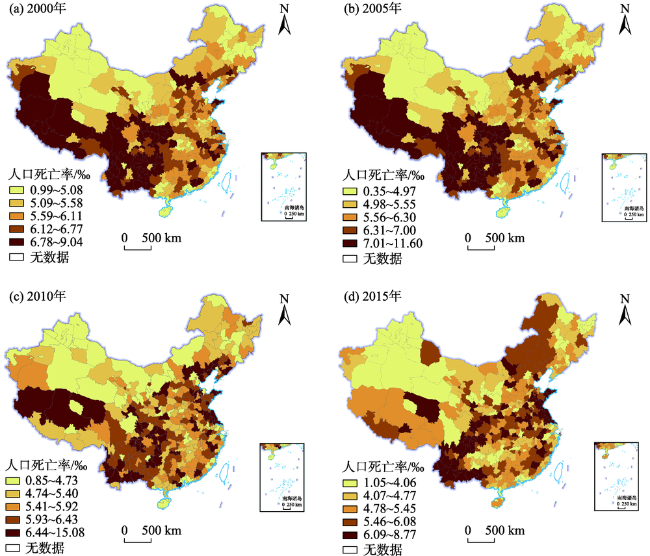
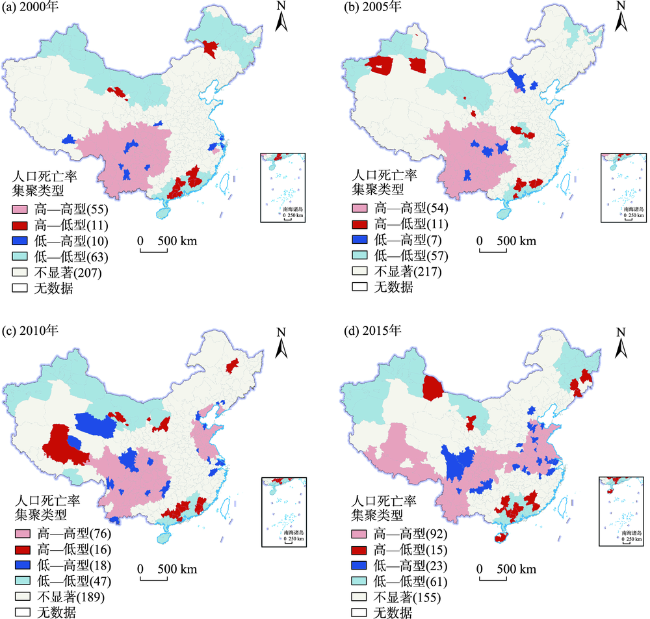
中国生态文明建设和“健康中国”战略强调切实治理影响人口健康的环境问题,建设健康人居环境。论文基于2000年和2010年中国人口普查资料以及2005年和2015年各省级行政单元1%人口抽样调查等数据资料,论文使用探索性空间分析方法刻画中国城市人口死亡率的时空变化特征,并采用空间回归方法,揭示城市PM2.5的平均浓度对人口死亡率的影响及其空间溢出效应,以及社会经济因素对PM2.5—人口死亡率关联的调节效应。结果表明:① 中国城市人口死亡率的空间分布特征呈现明显的异质性,高死亡率地区早期集聚分布于西南地区,2005年后在西南地区、华北地区、华东地区和华中地区呈现逐渐集聚分布态势。低死亡率地区长期集中分布于西北地区、东北地区、长三角地区、珠三角地区和京津两市。② 人口死亡率的分布存在空间关联性,高—高类型地区早期集中分布于西南地区,后期向东扩展;低—低类型地区主要分布于北疆、内蒙古西部和广东省及其周边地区。③ 城市PM2.5浓度对人口死亡率具有显著的正向影响,并且对邻近地区的人口死亡率具有显著的空间溢出效应。④ 中国城市PM2.5浓度对人口死亡率的影响存在学历差异和城乡差异,地区高学历人群集聚可降低PM2.5的健康风险,城镇化发展进程缓慢则会加重PM2.5的健康风险。研究旨在为防范空气污染暴露导致的健康风险、建设健康人居环境提供科学依据。
陈镘 , 黄柏石 , 刘晔 . PM2.5污染对中国人口死亡率的影响——基于346个城市面板数据的实证分析[J]. 地理科学进展, 2022 , 41(6) : 1028 -1040 . DOI: 10.18306/dlkxjz.2022.06.007
Health hazards and risks caused by air pollution have become a public topic. Ecological civilization construction and "Healthy China" strategy emphasize the alleviation of environmental stressors and the construction of healthy living environment. Using city-level data of population census and the 1% provincial sample demographic survey from 2000 to 2015, this study examined the spatial-temporal patterns of mortality and the effects of PM2.5 concentration on mortality based on spatial regression models. It further examined the moderation effects of regional socioeconomic conditions on the PM2.5 concentration-mortality association. Analytical results are as follows: 1) There is a considerable regional variation in mortality rate in China. Cities with high mortality rates initially were maincdly concentrated in Southwest China, and they become increasingly concentrated in Southwest China, North China, East China, and Central China after 2005. Cities with low mortality rates have long been concentrated in Northwest China, Northeast China, the Yangtze River Delta, the Pearl River Delta, and Beijing and Tianjin. 2) There is a significant spatial correlation in mortality rates. From 2000 to 2015, mortality rates became increasingly concentrated in particular regions. High-high type areas were concentrated in the southwest in the early stage and then expanded to the east. Low-low type areas are mainly distributed in the north of Xinjiang, the west of Inner Mongolia, and Guangdong Province and its surrounding areas. 3) The concentration of PM2.5 has a positive correlation with mortality rates and a significant spatial spillover effect on mortality rates in neighboring areas. 4) The impact of PM2.5 on mortality is subject to the influences of educational differences and urban-rural divides: regions with great concentration of highly educated people are less vulnerable to PM2.5 health impact, and areas with a low level of urbanization are more subject to health risks of PM2.5. The results show that regional prevention and control of air pollution is important, and in order to reduce health risks, more attention should be paid to the development of high-quality urbanization, optimization of economic structure, and promotion of residents' health literacy. Our findings can provide a scientific reference for the environmental risk assessment of air pollution and the construction of healthy living environments.
表1 变量描述性统计Tab.1 Descriptive statistics of variables |
| 变量名 | 符号 | 2000年 平均值(标准差) | 2005年 平均值(标准差) | 2010年 平均值(标准差) | 2015年 平均值(标准差) |
|---|---|---|---|---|---|
| 人口死亡率/‰ | mortality | 5.83 (1.13) | 5.96 (1.46) | 5.56 (1.31) | 5.04 (1.28) |
| 当年PM2.5/(μg/m3) | pm | 20.78 (11.95) | 33.17 (17.07) | 33.59 (18.15) | 33.23 (19.21) |
| 3年PM2.5均值/(μg/m3) | pm3 | 20.96 (10.60) | 30.56 (15.68) | 33.65 (17.76) | 33.39 (18.24) |
| 老年人口比重/% | older | 9.92 (1.90) | 12.23 (2.68) | 12.89 (2.81) | 15.61 (3.93) |
| 少儿人口比重/% | child | 23.73 (4.97) | 20.33 (4.87) | 17.31 (4.68) | 17.67 (6.10) |
| 大专及以上学历人口比重/% | edu | 3.34 (2.59) | 4.89 (3.58) | 7.76 (4.72) | 10.49 (6.17) |
| 城镇化率/% | urban | 36.94 (18.80) | 43.31 (18.24) | 47.58 (17.23) | 52.86 (14.91) |
| 人口密度/(人/km2) | pop | 343.12 (329.44) | 356.93 (333.02) | 369.66 (331.49) | 385.15 (357.95) |
| 人均GDP/元 | pgdp | 7742.18 (6598.64) | 14529.42 (11736.97) | 30832.91 (21342.19) | 48702.67 (28559.05) |
| 第二产业比重/% | secindust | 40.60 (12.99) | 44.27 (13.23) | 49.35 (11.90) | 45.40 (10.39) |
| 第三产业比重/% | terindust | 35.56 (7.48) | 37.04 (8.90) | 36.01 (9.11) | 41.46 (8.76) |
| 每万人医生数/(位/万人) | doctor | 15.21 (10.32) | 15.55 (7.26) | 18.30 (9.44) | 21.40 (10.67) |
| 年平均相对湿度/% | rh | 69.27 (10.37) | 66.08 (9.73) | 67.02 (10.03) | 68.56 (11.36) |
| 年平均温度/℃ | temp | 13.23 (5.62) | 13.30 (5.59) | 13.35 (5.64) | 13.88 (5.44) |
| NDVI | ndvi | 0.41(0.14) | 0.40 (0.13) | 0.41 (0.14) | 0.44 (0.15) |
表2 空间滞后回归模型估计结果Tab.2 Estimation results of spatial regression model |
| 变量 | 模型1: SLM 估计系数(标准差) | 直接效应 估计系数(标准差) | 间接效应 估计系数(标准差) | 总效应 估计系数(标准差) |
|---|---|---|---|---|
| pm | 0.906** (0.379) | 0.937** (0.396) | 0.364** (0.161) | 1.301** (0.547) |
| older | 0.060*** (0.014) | 0.061*** (0.014) | 0.024*** (0.007) | 0.084*** (0.020) |
| child | 0.006 (0.005) | 0.006 (0.005) | 0.002 (0.002) | 0.009 (0.007) |
| edu | -0.044*** (0.009) | -0.044*** (0.009) | -0.017*** (0.005) | -0.062*** (0.013) |
| urban | -0.004 (0.004) | -0.004 (0.004) | -0.002 (0.001) | -0.005 (0.005) |
| ln pop | -0.088 (0.060) | -0.086 (0.061) | -0.034 (0.025) | -0.120 (0.085) |
| ln pgdp | -0.137** (0.069) | -0.137** (0.069) | -0.053* (0.028) | -0.189** (0.095) |
| secindust | -0.003 (0.005) | -0.003 (0.004) | -0.001 (0.002) | -0.004 (0.006) |
| terindust | -0.011** (0.006) | -0.012** (0.005) | -0.005** (0.002) | -0.016** (0.008) |
| doctor | 0.003 (0.003) | 0.003 (0.003) | 0.001 (0.001) | 0.004 (0.005) |
| rh | -0.012 (0.010) | -0.013 (0.010) | -0.005 (0.004) | -0.018 (0.014) |
| temp | -0.397*** (0.074) | -0.402*** (0.077) | -0.156*** (0.035) | -0.558*** (0.104) |
| ndvi | -0.532 (1.134) | -0.618 (1.125) | -0.244 (0.455) | -0.861 (1.574) |
| 0.291*** (0.036) | ||||
| Log likelihood | -1400.340 | |||
| N | 1384 |
注:***、**、*分别代表通过1%、5%和10%显著性水平检验,下同。 |
表3 社会经济因素的调节效应分析Tab.3 Analysis on the moderation effects of socioeconomic factors |
| 变量 | 模型2: SLM模型 估计系数(标准差) | 模型3: SLM模型 估计系数(标准差) | 模型4: SLM模型 估计系数(标准差) | 模型5: SLM模型 估计系数(标准差) |
|---|---|---|---|---|
| pm | 1.512*** (0.477) | 2.091*** (0.714) | 2.383 (1.681) | 1.425* (0.864) |
| older | 0.061*** (0.014) | 0.061*** (0.014) | 0.061*** (0.014) | 0.061*** (0.014) |
| child | 0.007 (0.005) | 0.006 (0.005) | 0.006 (0.005) | 0.006 (0.005) |
| edu | -0.021 (0.014) | -0.040*** (0.010) | -0.042*** (0.009) | -0.043*** (0.009) |
| urban | -0.004 (0.004) | 0.002 (0.005) | -0.004 (0.004) | -0.004 (0.004) |
| ln pop | -0.092 (0.060) | -0.095 (0.060) | -0.091 (0.060) | -0.089 (0.060) |
| ln pgdp | -0.158** (0.070) | -0.148** (0.069) | -0.111 (0.074) | -0.143** (0.069) |
| secindust | -0.004 (0.005) | -0.004 (0.005) | -0.003 (0.005) | -0.003 (0.005) |
| terindust | -0.012** (0.006) | -0.012** (0.006) | -0.012** (0.006) | -0.009 (0.007) |
| doctor | 0.004 (0.003) | 0.004 (0.003) | 0.003 (0.003) | 0.003 (0.003) |
| rh | -0.009 (0.010) | -0.010 (0.010) | -0.011 (0.010) | -0.011 (0.010) |
| temp | -0.414*** (0.075) | -0.410*** (0.074) | -0.408*** (0.075) | -0.396*** (0.074) |
| ndvi | -0.384 (1.135) | -0.373 (1.136) | -0.337 (1.154) | -0.508 (1.135) |
| pm×edu | -0.061** (0.029) | |||
| pm×urban | -0.022* (0.011) | |||
| pm×ln pgdp | -0.140 (0.155) | |||
| pm×terindust | -0.013 (0.019) | |||
| 0.287*** (0.036) | 0.287*** (0.036) | 0.290*** (0.036) | 0.291*** (0.036) | |
| 0.434*** (0.017) | 0.434*** (0.017) | 0.435*** (0.017) | 0.435*** (0.017) | |
| Log likelihood | -1398.1478 | -1398.4257 | -1399.9333 | -1400.1161 |
| N | 1384 | 1384 | 1384 | 1384 |
表4 稳健性检验结果Tab.4 Results of robustness test |
| 变量 | 模型6: SEM 估计系数(标准差) | 模型7: SLM 估计系数(标准差) | 模型8: SLM 估计系数(标准差) |
|---|---|---|---|
| pm | 1.164** (0.477) | ||
| pm3 | 0.846* (0.477) | ||
| pm_35 | 0.224*** (0.074) | ||
| older | 0.069*** (0.016) | 0.067*** (0.013) | 0.063*** (0.013) |
| child | 0.005 (0.006) | 0.006 (0.005) | 0.006 (0.005) |
| edu | -0.050*** (0.010) | -0.043*** (0.009) | -0.043*** (0.009) |
| urban | -0.004 (0.004) | -0.004 (0.004) | -0.004 (0.004) |
| ln pop | -0.080 (0.066) | -0.087 (0.060) | -0.087 (0.060) |
| ln pgdp | -0.223*** (0.075) | -0.145** (0.071) | -0.115* (0.068) |
| secindust | -0.004 (0.005) | -0.002 (0.005) | -0.003 (0.005) |
| terindust | -0.011* (0.006) | -0.011** (0.006) | -0.011** (0.006) |
| doctor | 0.003 (0.003) | 0.003 (0.003) | 0.003 (0.003) |
| rh | -0.020 (0.013) | -0.014 (0.010) | -0.015 (0.009) |
| temp | -0.511*** (0.093) | -0.385*** (0.078) | -0.403*** (0.073) |
| ndvi | -0.896 (1.385) | -1.113 (1.096) | -0.554 (1.115) |
| 0.296*** (0.038) | |||
| 0.298*** (0.036) | 0.297*** (0.036) | ||
| N | 1384 | 1384 | 1384 |
| Log likelihood | -1401.978 | -1401.626 | -1398.653 |
| [1] |
|
| [2] |
宋长青, 冷疏影. 地理科学三十年: 从经典到前沿[M]. 北京: 商务印书馆, 2016: 759-788.
[
|
| [3] |
World Health Organization. Ambient air pollution: A global assessment of exposure and burden of disease[M]. Geneva, Switzerland: World Health Organization, 2016: 19-21.
|
| [4] |
郭杰, 肖纯凌. PM2.5对人群健康影响的流行病学研究进展[J]. 环境卫生学杂志, 2017, 7(2): 164-169.
[
|
| [5] |
|
| [6] |
|
| [7] |
|
| [8] |
|
| [9] |
|
| [10] |
|
| [11] |
|
| [12] |
|
| [13] |
孙猛, 李晓巍. 空气污染与公共健康: 基于省际面板数据的实证研究[J]. 人口学刊, 2017, 39(5): 5-13.
[
|
| [14] |
|
| [15] |
|
| [16] |
曾贤刚, 阮芳芳, 彭彦彦. 基于空间网格尺度的中国PM2.5污染健康效应空间分布[J]. 中国环境科学, 2019, 39(6): 2624-2632.
[
|
| [17] |
杨振, 敖荣军, 王念, 等. 中国环境污染的健康压力时空差异特征[J]. 地理科学, 2017, 37(3): 339-346.
[
|
| [18] |
解垩. 中国地区间健康差异的因素分解[J]. 山西财经大学学报, 2011, 33(8): 11-24.
[
|
| [19] |
杨振, 刘会敏, 王晓霞. 中国人口健康分布的时空变化与影响因素[J]. 世界地理研究, 2017, 26(2): 161-168.
[
|
| [20] |
|
| [21] |
李立清, 许荣. 中国居民健康水平的区域差异分析[J]. 卫生经济研究, 2015(1): 14-20.
[
|
| [22] |
赵雪雁, 王伟军, 万文玉. 中国居民健康水平的区域差异: 2003—2013[J]. 地理学报, 2017, 72(4): 685-698.
[
|
| [23] |
齐良书. 经济、环境与人口健康的相互影响: 基于我国省区面板数据的实证分析[J]. 中国人口·资源与环境, 2008, 18(6): 169-173.
[
|
| [24] |
薛倩, 谢苗苗, 郭强, 等. 地理学视角下城市高温热浪脆弱性评估研究进展[J]. 地理科学进展, 2020, 39(4): 685-694.
[
|
| [25] |
|
| [26] |
|
| [27] |
周素红, 张琳, 林荣平. 地理环境暴露与公众健康研究进展[J]. 科技导报, 2020, 38(7): 43-52.
[
|
| [28] |
杨林生, 李海蓉, 李永华, 等. 医学地理和环境健康研究的主要领域与进展[J]. 地理科学进展, 2010, 29(1): 31-44.
[
|
| [29] |
郭文伯, 张艳, 柴彦威. 城市居民出行的空气污染暴露测度及其影响机制: 北京市郊区社区的案例分析[J]. 地理研究, 2015, 34(7): 1310-1318.
[
|
| [30] |
马静, 柴彦威, 符婷婷. 居民时空行为与环境污染暴露对健康影响的研究进展[J]. 地理科学进展, 2017, 36(10): 1260-1269.
[
|
| [31] |
赵宏波, 冯渊博, 董冠鹏, 等. 大城市居民自评健康与环境危害感知的空间差异及影响因素: 基于郑州市区的实证研究[J]. 地理科学进展, 2018, 37(12): 1713-1726.
[
|
| [32] |
|
| [33] |
程雁鹏, 冯永亮, 段小丽, 等. 孕期大气细颗粒物PM2.5暴露及对早产的影响研究[J]. 中华流行病学杂志, 2016, 37(4): 572-577.
[
|
| [34] |
|
| [35] |
刁贝娣, 丁镭, 成金华. 不同类型城市的PM2.5健康风险及影响因素差异[J]. 中国人口·资源与环境, 2021, 31(8): 90-100.
[
|
| [36] |
蔡瑞婷, 肖舜, 董治宝, 等. 汾渭平原典型城乡PM2.5中多环芳烃特征与健康风险[J]. 地理学报, 2021, 76(3): 740-752.
[
|
| [37] |
杨新兴, 冯丽华, 尉鹏. 大气颗粒物PM2.5及其危害[J]. 前沿科学, 2012, 6(1): 22-31.
[
|
| [38] |
马静, 周创文,
[
|
| [39] |
祁毓, 卢洪友. 污染、健康与不平等: 跨越“环境健康贫困”陷阱[J]. 管理世界, 2015(9): 32-51.
[
|
| [40] |
|
| [41] |
|
| [42] |
涂正革, 张茂榆, 许章杰, 等. 收入增长、大气污染与公众健康: 基于CHNS的微观证据[J]. 中国人口·资源与环境, 2018, 28(6): 130-139.
[
|
| [43] |
孙猛, 芦晓珊. 空气污染社会经济地位与居民健康不平等: 基于CGSS的微观证据[J]. 人口学刊, 2019, 41(6): 103-112.
[
|
| [44] |
邵帅, 李欣, 曹建华, 等. 中国雾霾污染治理的经济政策选择: 基于空间溢出效应的视角[J]. 经济研究, 2016, 51(9): 73-88.
[
|
| [45] |
李光勤, 何仁伟. PM2.5污染与健康支出: 时间滞后效应与空间溢出效应[J]. 安全与环境学报, 2019, 19(1): 326-336.
[
|
| [46] |
刘海猛, 方创琳, 黄解军, 等. 京津冀城市群大气污染的时空特征与影响因素解析[J]. 地理学报, 2018, 73(1): 177-191.
[
|
| [47] |
Center for International Earth Science Information Network-Ciesin-Columbia University. Annual PM2.5 concentrations for countries and urban areas, 1998—2016 [DB/OL]. 2021-04-06 [2021-10-20]. NASA Socioeconomic Data and Applications Center ( SEDAC), 2021. https://doi.org/10.7927/rja8-8h89
|
| [48] |
徐新良. 中国人口空间分布公里网格数据集[DB/OL]. 中国科学院资源环境科学数据中心数据注册与出版系统, 2017 [2021-08-20]. https://www.resdc.cn/data.aspx?DATAID=251doi: 10.12078/2017121101.
[
|
| [49] |
|
| [50] |
|
| [51] |
|
| [52] |
刘华军, 张权, 杨骞. 城镇化、空间溢出与区域经济增长: 基于空间回归模型偏微分方法及中国的实证[J]. 农业技术经济, 2014, 10: 95-105.
[
|
| [53] |
|
| [54] |
|
| [55] |
|
| [56] |
姚宏文, 石琦, 李英华. 我国城乡居民健康素养现状及对策[J]. 人口研究, 2016, 40(2): 88-97.
[
|
| [57] |
唐丹. 城乡因素在老年人抑郁症状影响模型中的调节效应[J]. 人口研究, 2010, 34(3): 53-63.
[
|
/
| 〈 |
|
〉 |