
多尺度视角下中国新能源汽车产业创新空间格局及网络特征
|
张凯煌(1996— ),男,广东广州人,硕士生,主要研究方向为经济地理与区域发展。E-mail: kh819@outlook.com |
收稿日期: 2020-12-31
修回日期: 2021-04-16
网络出版日期: 2022-01-28
基金资助
国家自然科学基金项目(41771127)
广东省攀登计划项目(pdjh2020b0472)
版权
Multilevel spatial patterns and network characteristics of China’s new energy vehicle industrial technological innovation
Received date: 2020-12-31
Revised date: 2021-04-16
Online published: 2022-01-28
Supported by
National Natural Science Foundation of China(41771127)
Guangdong Climbing Plan Project(pdjh2020b0472)
Copyright
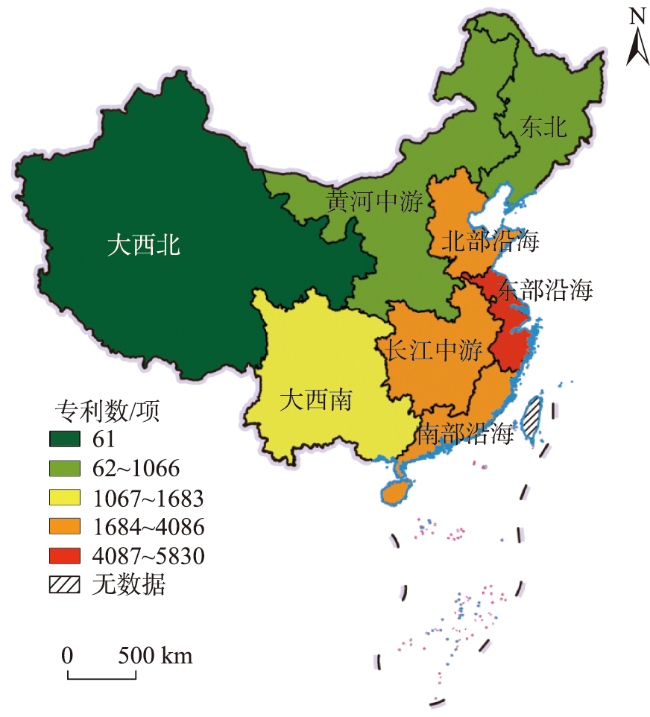
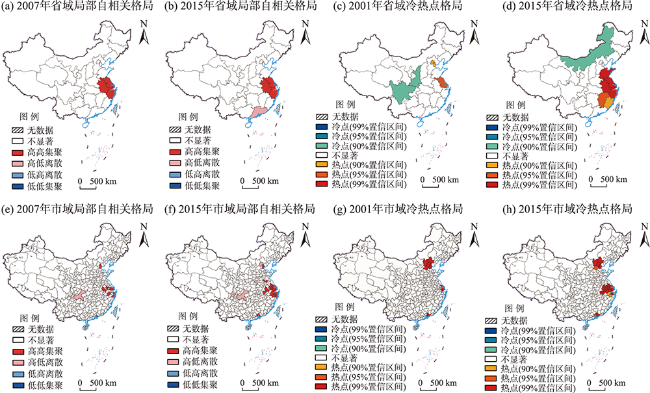
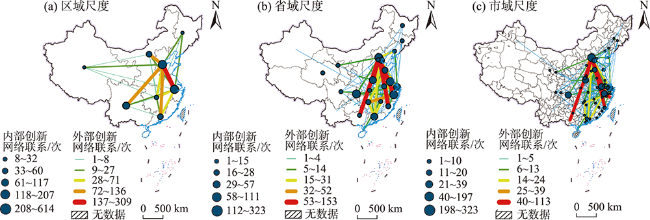
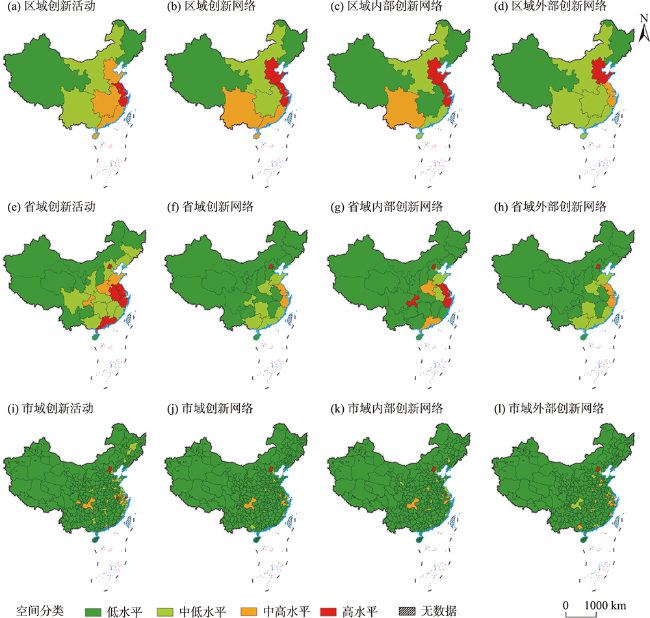
创新活动与创新网络的多尺度空间模式是创新经济地理学关注的焦点。论文选择在知识分类上兼具隐性和显性知识特征的新能源汽车产业作为研究对象,利用来自国家知识产权局的相关专利数据,分析了2001—2015年中国新能源汽车产业独立创新活动和合作创新网络在“区域—省域—市域”的多尺度空间特征,并对其进行空间分类。结果显示:① 创新活动在城市层面最具解释力度,中国新能源汽车产业技术创新活动主要集中在东部和北部沿海地区,市域尺度上的创新活动存在较大差异;② 内部创新网络和外部创新网络在区域层面最具解释力度,创新网络集中在东部和北部沿海地区,市域尺度上的创新网络变异明显;③ 在不同尺度上,创新网络与创新活动之间存在不同程度的差异。地方创新环境与创新主体性质是造成上述格局差异的重要原因。仅停留在空间上的分析很难深入解释创新网络格局,应从更微观的创新主体层面探究创新结网的过程和机理。此外,创新活动和创新网络分别具有“多尺度结构性嵌套”和“多尺度能动性交换”特征,未来研究应对两者之间的差别给予更多关注。
张凯煌 , 千庆兰 , 陈清怡 . 多尺度视角下中国新能源汽车产业创新空间格局及网络特征[J]. 地理科学进展, 2021 , 40(11) : 1824 -1838 . DOI: 10.18306/dlkxjz.2021.11.003
Multilevel spatial models of innovation activities and innovation networks have been the focus of researchers. To provide more direct evidence for multilevel spatial model of innovation, we chose the new energy vehicle industry (NEV industry) as an example, because the knowledge in NEV industry is tacit and codified, which means it would be with a significant multilevel feature. This study used the patent data of 2004 to 2018 from the State Intellectual Property Office (SIPO) to analyze the multilevel spatial characteristics of China's NEV industry innovation from 2001 to 2015 because the patents in China would be published 18 to 24 months after the application and there is a time lag of almost 3 years between innovation input and output. We used the Theil coefficient to understand the multilevel structure, the coefficient of variation (CV) and Gini coefficient to clear the variation and difference of innovation at multiple levels, and the local Moran's I, Getis-Ord $G_{i}^{*}$, and natural breaks (Jenks) to map the spatial agglomerations and clustering. The results show that: 1) At the municipal level resides the strongest explanation of innovation activities and they are mainly agglomerated in the eastern coastal region (ECR) and northern coastal region (NCR), and the distribution of innovation activities are greatly different at the municipal level. 2) The regional level has the strongest explanatory power of internal and external innovation networks and they are mainly clustered in the ECR and NCR, and the distribution of innovation networks are quite different at the municipal level. 3) The distributions of innovation networks and innovation activities are significantly different at different spatial levels. Based on this reality, we point out that the formation mechanism of innovation activities and innovation networks are different. The spatial pattern of innovation activities is affected by regional innovation system, and the innovation networks are the result of actors' choices. We argue that it is difficult to explain the spatial characteristics of innovation networks only from the spatial perspective. Therefore, it is necessary to examine the formation process of innovation networks from a more micro level. Because the municipal level is the most important place for innovation activities and the regional level is the key area for innovation networks, as the Theil coefficient shows, we actually provide direct evidence for the multilevel structural nesting feature of innovation activities and the multilevel initiative interaction feature of innovation networks. It would be necessary for researchers to discuss the differences between them in the future.
表1 创新活动与创新网络的空间关系类型划分Tab.1 Types of spatial relationship between innovation activities and innovation networks |
| 具体类型 | 主要特征 |
|---|---|
| 第Ⅰ型:高值正向强化 | 创新活动规模高或中高,创新网络规模高或中高 |
| 第Ⅱ型:高值负向背离 | 创新活动规模高或中高,创新网络规模低或中低 |
| 第Ⅲ型:低值负向背离 | 创新活动规模低或中低,创新网络规模高或中高 |
| 第Ⅳ型:低值正向强化 | 创新活动规模低或中低,创新网络规模低或中低 |
表2 2001—2015年多尺度创新活动的泰尔指数嵌套分解和贡献度构成Tab.2 Theil nesting index and scale decomposition of multilevel innovation activities, 2001-2015 |
| 年份 | 泰尔指数 | |||||||
|---|---|---|---|---|---|---|---|---|
| 市域尺度 | 省域尺度 | 区域尺度 | ||||||
| 指数 | 权重/% | 指数 | 权重/% | 指数 | 权重/% | |||
| 2001 | -1.64 | 50.52 | -0.69 | 21.34 | -0.91 | 28.14 | ||
| 2002 | -2.22 | 59.72 | -0.58 | 15.61 | -0.92 | 24.67 | ||
| 2003 | -1.89 | 57.19 | -0.54 | 16.23 | -0.88 | 26.58 | ||
| 2004 | -2.31 | 61.53 | -0.60 | 16.04 | -0.84 | 22.43 | ||
| 2005 | -2.07 | 57.81 | -0.64 | 17.88 | -0.87 | 24.31 | ||
| 2006 | -1.97 | 57.95 | -0.58 | 16.92 | -0.85 | 25.13 | ||
| 2007 | -2.23 | 60.04 | -0.62 | 16.75 | -0.86 | 23.21 | ||
| 2008 | -2.17 | 59.39 | -0.63 | 17.15 | -0.86 | 23.46 | ||
| 2009 | -2.30 | 61.26 | -0.58 | 15.54 | -0.87 | 23.20 | ||
| 2010 | -2.12 | 59.50 | -0.58 | 16.26 | -0.87 | 24.24 | ||
| 2011 | -2.43 | 62.64 | -0.59 | 15.12 | -0.86 | 22.24 | ||
| 2012 | -2.54 | 63.51 | -0.60 | 14.94 | -0.86 | 21.55 | ||
| 2013 | -2.37 | 62.74 | -0.54 | 14.26 | -0.87 | 23.00 | ||
| 2014 | -1.73 | 55.73 | -0.51 | 16.25 | -0.87 | 28.02 | ||
| 2015 | -2.97 | 68.40 | -0.51 | 11.71 | -0.86 | 19.89 | ||
表3 2001—2015年多尺度创新活动的变异系数、基尼系数和全局莫兰指数Tab.3 Coefficient of variation, Gini index, and global Moran's I of multilevel innovation activities, 2001-2015 |
| 年份 | 变异系数 | 基尼系数 | 全局莫兰指数 | ||||||||
|---|---|---|---|---|---|---|---|---|---|---|---|
| 市域尺度 | 省域尺度 | 区域尺度 | 市域尺度 | 省域尺度 | 区域尺度 | 市域尺度 | 省域尺度 | ||||
| Moran's I | P值 | Moran's I | P值 | ||||||||
| 2001 | 6.56 | 1.75 | 0.95 | 0.98 | 0.78 | 0.60 | 0.007 | 0.40 | -0.060 | 0.70 | |
| 2002 | 6.27 | 1.56 | 0.75 | 0.97 | 0.72 | 0.48 | -0.008 | 0.67 | -0.056 | 0.73 | |
| 2003 | 6.88 | 1.92 | 0.79 | 0.98 | 0.81 | 0.51 | 0 | 0.83 | -0.077 | 0.52 | |
| 2004 | 7.53 | 1.95 | 0.95 | 0.97 | 0.75 | 0.52 | -0.006 | 0.75 | -0.019 | 0.83 | |
| 2005 | 6.22 | 1.67 | 0.72 | 0.96 | 0.75 | 0.46 | 0.003 | 0.62 | -0.128 | 0.19 | |
| 2006 | 5.78 | 1.56 | 0.78 | 0.95 | 0.71 | 0.50 | 0.005 | 0.50 | 0.044 | 0.30 | |
| 2007 | 4.40 | 1.24 | 0.75 | 0.93 | 0.64 | 0.48 | 0.044 | <0.01 | 0.109 | 0.09 | |
| 2008 | 4.30 | 1.24 | 0.75 | 0.92 | 0.65 | 0.48 | 0.038 | <0.01 | 0.114 | 0.07 | |
| 2009 | 4.65 | 1.33 | 0.79 | 0.93 | 0.67 | 0.49 | 0.037 | <0.01 | 0.054 | 0.27 | |
| 2010 | 4.18 | 1.23 | 0.69 | 0.93 | 0.65 | 0.44 | 0.044 | <0.01 | 0.072 | 0.20 | |
| 2011 | 4.70 | 1.41 | 0.77 | 0.92 | 0.68 | 0.49 | 0.039 | <0.01 | 0.009 | 0.59 | |
| 2012 | 4.03 | 1.23 | 0.77 | 0.91 | 0.64 | 0.49 | 0.060 | <0.01 | 0.112 | 0.07 | |
| 2013 | 4.11 | 1.34 | 0.78 | 0.90 | 0.67 | 0.50 | 0.061 | <0.01 | 0.057 | 0.27 | |
| 2014 | 3.56 | 1.36 | 0.77 | 0.89 | 0.66 | 0.49 | 0.095 | <0.01 | 0.037 | 0.39 | |
| 2015 | 3.16 | 1.40 | 0.77 | 0.87 | 0.67 | 0.49 | 0.162 | <0.01 | 0.123 | 0.05 | |
表4 2003—2015年多尺度内部创新网络的泰尔指数嵌套分解和贡献度构成Tab.4 Theil nesting index and scale decomposition of multilevel internal innovation networks, 2003-2015 |
| 年份 | 泰尔指数 | |||||||
|---|---|---|---|---|---|---|---|---|
| 市域尺度 | 省域尺度 | 区域尺度 | ||||||
| 指数 | 权重/% | 指数 | 权重/% | 指数 | 权重/% | |||
| 2003 | 0.05 | 2.14 | -1.66 | 67.89 | -0.73 | 29.97 | ||
| 2004 | 0.02 | 1.44 | -0.89 | 53.52 | -0.75 | 45.05 | ||
| 2005 | 0.02 | 1.05 | -0.73 | 47.03 | -0.80 | 51.92 | ||
| 2006 | -0.11 | 4.52 | -1.47 | 58.35 | -0.94 | 37.14 | ||
| 2007 | 0 | 0.07 | -0.51 | 38.13 | -0.82 | 61.80 | ||
| 2008 | 0 | 0.22 | -0.64 | 43.62 | -0.83 | 56.16 | ||
| 2009 | -0.04 | 2.69 | -0.50 | 35.60 | -0.87 | 61.71 | ||
| 2010 | -0.07 | 4.58 | -0.50 | 35.03 | -0.87 | 60.39 | ||
| 2011 | -0.04 | 2.67 | -0.51 | 35.85 | -0.87 | 61.48 | ||
| 2012 | -0.03 | 2.05 | -0.40 | 31.65 | -0.84 | 66.30 | ||
| 2013 | -0.04 | 2.78 | -0.49 | 35.95 | -0.84 | 61.27 | ||
| 2014 | -0.04 | 3.45 | -0.33 | 26.38 | -0.89 | 70.16 | ||
| 2015 | -0.08 | 5.36 | -0.47 | 33.02 | -0.88 | 61.62 | ||
表5 2003—2015年多尺度内部创新网络和外部创新网络的变异系数和基尼系数Tab.5 Coefficient of variation and Gini index of multilevel internal and external innovation networks, 2003-2015 |
| 年份 | 内部网络 | 外部网络 | ||||||||||||
|---|---|---|---|---|---|---|---|---|---|---|---|---|---|---|
| 变异系数 | 基尼系数 | 变异系数 | 基尼系数 | |||||||||||
| 市域尺度 | 省域尺度 | 区域尺度 | 市域尺度 | 省域尺度 | 区域尺度 | 市域尺度 | 省域尺度 | 区域尺度 | 市域尺度 | 省域尺度 | 区域尺度 | |||
| 2003 | 18.97 | 5.48 | 2.65 | 1.00 | 1.00 | 1.00 | 254.91 | 21.54 | 5.20 | 1.00 | 1.00 | 1.00 | ||
| 2004 | 18.97 | 4.03 | 1.86 | 1.00 | 0.98 | 0.90 | 254.91 | 0 | 0 | 1.00 | 0 | 0 | ||
| 2005 | 12.53 | 3.54 | 1.58 | 1.00 | 0.95 | 0.79 | 0 | 0 | 0 | 0 | 0 | 0 | ||
| 2006 | 11.59 | 3.68 | 2.65 | 1.00 | 0.97 | 1.00 | 140.96 | 14.08 | 3.32 | 1.00 | 1.00 | 0.96 | ||
| 2007 | 10.87 | 2.70 | 1.23 | 0.99 | 0.87 | 0.71 | 102.12 | 11.37 | 3.61 | 1.00 | 0.99 | 0.96 | ||
| 2008 | 15.45 | 3.36 | 1.49 | 1.00 | 0.95 | 0.82 | 111.14 | 10.90 | 3.28 | 1.00 | 0.99 | 0.94 | ||
| 2009 | 8.86 | 2.74 | 0.83 | 0.99 | 0.91 | 0.46 | 97.85 | 8.70 | 1.87 | 1.00 | 0.99 | 0.83 | ||
| 2010 | 6.83 | 2.10 | 1.32 | 0.98 | 0.84 | 0.74 | 51.24 | 5.34 | 2.27 | 1.00 | 0.97 | 0.86 | ||
| 2011 | 7.15 | 1.93 | 1.45 | 0.98 | 0.83 | 0.78 | 55.40 | 7.19 | 2.89 | 1.00 | 0.98 | 0.91 | ||
| 2012 | 6.93 | 1.76 | 1.17 | 0.98 | 0.79 | 0.68 | 63.21 | 6.82 | 2.71 | 1.00 | 0.98 | 0.88 | ||
| 2013 | 9.14 | 2.26 | 1.38 | 0.98 | 0.82 | 0.78 | 54.25 | 5.39 | 1.72 | 1.00 | 0.96 | 0.77 | ||
| 2014 | 6.18 | 1.68 | 1.28 | 0.97 | 0.75 | 0.64 | 54.19 | 5.41 | 2.03 | 1.00 | 0.96 | 0.79 | ||
| 2015 | 7.26 | 1.45 | 0.97 | 0.97 | 0.69 | 0.62 | 68.63 | 7.37 | 3.49 | 1.00 | 0.97 | 0.90 | ||
表6 2003—2015年多尺度外部创新网络的泰尔指数嵌套分解和贡献度构成Tab.6 Theil nesting index and scale decomposition of multilevel external innovation networks, 2003-2015 |
| 年份 | 泰尔指数 | |||||||
|---|---|---|---|---|---|---|---|---|
| 市域尺度 | 省域尺度 | 区域尺度 | ||||||
| 指数 | 权重/% | 指数 | 权重/% | 指数 | 权重/% | |||
| 2003 | -0.01 | 0.6 | -1.47 | 74.8 | -0.48 | 24.5 | ||
| 2004 | 0 | 0 | 0 | 0 | 0 | 0 | ||
| 2005 | 0 | 0 | 0 | 0 | 0 | 0 | ||
| 2006 | -0.05 | 4.3 | -0.60 | 48.6 | -0.58 | 47.1 | ||
| 2007 | -0.08 | 7.9 | -0.34 | 34.9 | -0.56 | 57.2 | ||
| 2008 | -0.04 | 4.7 | -0.33 | 34.9 | -0.57 | 60.4 | ||
| 2009 | -0.02 | 2.7 | -0.10 | 14.9 | -0.56 | 82.4 | ||
| 2010 | -0.05 | 7.5 | -0.09 | 12.3 | -0.56 | 80.2 | ||
| 2011 | -0.03 | 4.7 | -0.11 | 16.4 | -0.55 | 78.9 | ||
| 2012 | -0.09 | 10.2 | -0.20 | 23.3 | -0.57 | 66.5 | ||
| 2013 | -0.03 | 4.5 | -0.10 | 14.7 | -0.57 | 80.8 | ||
| 2014 | -0.05 | 6.3 | -0.16 | 20.3 | -0.56 | 73.4 | ||
| 2015 | -0.14 | 14.0 | -0.32 | 31.2 | -0.56 | 54.8 | ||
| [1] |
孙瑜康, 李国平, 袁薇薇, 等. 创新活动空间集聚及其影响机制研究评述与展望[J]. 人文地理, 2017, 32(5):17-24.
[
|
| [2] |
|
| [3] |
|
| [4] |
|
| [5] |
World Intellectual Property Organization (WIPO). World intellectual property report 2019: The geography of innovation: Local hotspots, global networks[R]. Geneva, Switzerland: WIPO, 2019.
|
| [6] |
马双, 曾刚. 多尺度视角下中国城市创新网络格局及邻近性机理分析[J]. 人文地理, 2020, 35(1):95-103.
[
|
| [7] |
|
| [8] |
|
| [9] |
|
| [10] |
|
| [11] |
|
| [12] |
|
| [13] |
|
| [14] |
符文颖, 杨家蕊. 创新地理学的批判性思考: 基于中国情境的理论创新[J]. 地理研究, 2020, 39(5):1018-1027.
[
|
| [15] |
朱晟君, 黄永源, 胡晓辉. 多尺度视角下的产业价值链与空间升级研究框架与展望[J]. 地理科学进展, 2020, 39(8):1367-1384.
[
|
| [16] |
野中郁次郎, 竹内弘高. 知识创造的螺旋: 知识管理理论与案例研究 [M]. 北京: 知识产权出版社, 2012: 1-349.
[
|
| [17] |
曹贤忠, 曾刚, 司月芳. 网络资本、知识流动与区域经济增长: 一个文献述评[J]. 经济问题探索, 2016(6):175-184.
[
|
| [18] |
王缉慈. 创新的空间: 企业集群与区域发展 [M]. 北京: 科学出版社, 2001.
[
|
| [19] |
|
| [20] |
|
| [21] |
|
| [22] |
|
| [23] |
|
| [24] |
|
| [25] |
|
| [26] |
余谦, 白梦平, 覃一冬. 多维邻近性能促进中国新能源汽车企业的合作创新吗?[J]. 研究与发展管理, 2018, 30(6):67-74.
[
|
| [27] |
|
| [28] |
江孝君. 中国区域经济差异的多尺度时空演化特征及驱动机制研究[D]. 长春: 东北师范大学, 2019.
[
|
| [29] |
鲁凤, 徐建华. 基于不同区划系统的中国区域经济差异分解研究[J]. 人文地理, 2006, 21(2):77-81.
[
|
| [30] |
|
| [31] |
|
| [32] |
段吕晗, 杜德斌, 黄筱彧. 上海互联网新创企业的时空演化及影响因素[J]. 地理科学进展, 2019, 38(3):383-394.
[
|
| [33] |
侯纯光, 程钰, 任建兰, 等. 中国创新能力时空格局演变及其影响因素[J]. 地理科学进展, 2016, 35(10):1206-1217.
[
|
| [34] |
朱晟君, 王翀. 制造业重构背景下的中国经济地理研究转向[J]. 地理科学进展, 2018, 37(7):865-879.
[
|
/
| 〈 |
|
〉 |