
国家城市规模分布的时空演化特征及影响因素——基于LandScan的全球实证研究
|
王妤(1992— ),女,河北唐山人,博士生,主要从事城市地理、区域经济研究。E-mail: taibeidezuoan@163.com |
收稿日期: 2021-01-11
修回日期: 2021-04-26
网络出版日期: 2022-01-28
基金资助
国家社会科学基金重大项目(17ZDA068)
华东师范大学未来科学家和优秀学者培育计划项目(WLKXJ202010)
版权
Spatio-temporal change and influencing factors of city size distribution: Global empirical research based on LandScan data
Received date: 2021-01-11
Revised date: 2021-04-26
Online published: 2022-01-28
Supported by
Major Program of National Social Science Foundation of China(17ZDA068)
Training Program for Future Scientists and Outstanding Scholars of East China Normal University(WLKXJ202010)
Copyright
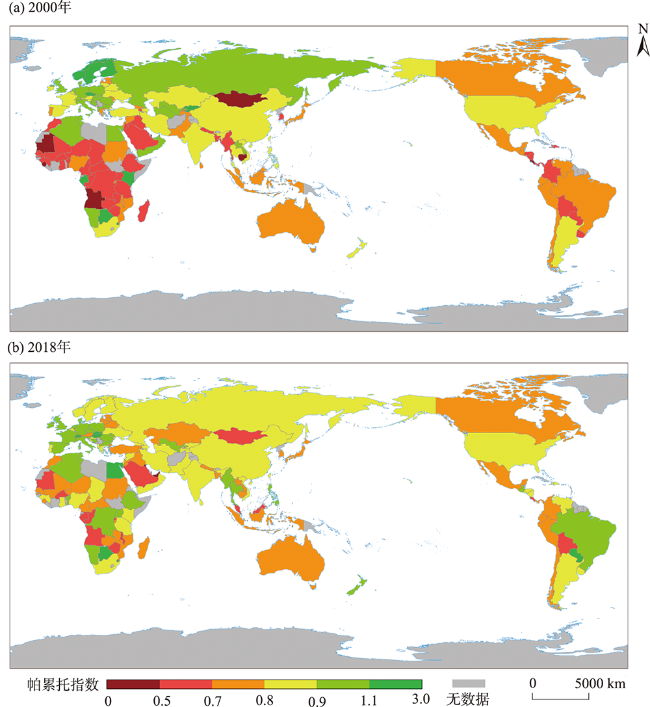
洞悉世界各国城市规模分布规律有助于推动形成合理的城镇格局和促进国家经济高质量发展。论文基于2000—2018年LandScan等数据库,按照统一的人口集聚标准创新性地识别了全球各国的城市,分析了国家城市规模分布的时空演化特征、影响因素及其异质性。研究发现:全球各国城市规模分布在研究期间内呈波动均衡的态势。从空间演化来看,非洲、南美洲国家城市规模分布逐渐均衡,而亚洲、欧洲国家出现极化趋势;从现状比较来看,非洲国家城市规模分布的极化程度居于首位,欧洲国家则最为均衡。河流密度、城市人口密度以及工业化水平提高会促进城市规模分布均衡发展,而地形起伏度、国家不稳定程度增加则会强化其极化程度。相比于其他要素,社会经济要素(尤其是城市人口密度)对城市规模分布的影响在不同收入水平、产业结构和政府干预程度的国家间异质性最为明显。研究深化了对城市规模分布及其形成机理的规律性认知,为形成合理的城市规模分布提供了有力的实证支撑。未来中国应通过构建适度均衡的城市规模分布体系、扩大内外双向开放以及应用新一代信息技术,重塑国家经济地理格局。
王妤 , 孙斌栋 , 张婷麟 . 国家城市规模分布的时空演化特征及影响因素——基于LandScan的全球实证研究[J]. 地理科学进展, 2021 , 40(11) : 1812 -1823 . DOI: 10.18306/dlkxjz.2021.11.002
Understanding the patterns of city size distribution around the world is important for the formation of reasonable city size distribution and high-quality national economic development. Based on a panel two-way fixed effects model and multiple databases such as LandScan from 2000 to 2018, this study identified the spatial and temporal change characteristics of city size distribution at the national level and analyzed its influencing factors as well as their heterogeneity based on global cities with a uniform definition. It was found that city size distribution across countries showed a fluctuating equalizing trend. In terms of spatial change, African and South American countries showed gradually equalized city size distribution, while Asian and European countries showed a trend of polarization. In a comparison of the present situation, African countries lead in the polarization of city size distribution, while European countries are the most equalized. Higher river densities, city population densities, and industrialization levels promote a equalized city size distribution, while larger topographic relief and national unrest reinforce their polarization. Compared to other factors, the socioeconomic factors (especially urban population density) have the most significant impact on the heterogeneity of city size distribution across countries with different income levels, industrial structures, and levels of government intervention. Although increased city population density contributes to a more equalized city size distribution overall, it has a significant polarizing effect in service-dominated and weak government intervention countries and a less pronounced effect in high-income countries. The balancing effect of industrial development on city size distribution and the polarizing effect of increased railway density are more significant in low-income countries, manufacturing-dominated countries, and countries with weak government intervention. Increased economic development significantly contributes to the polarization of city size distribution in service-dominated and weak government intervention countries and the expansion of openness contributes to the equalization of city size distribution in high-income countries. The increase in city population and internet penetration contributes to polarization and equalization of the city size distribution in countries with strong government intervention, and the increase in government spending only has a balancing effect on the city size distribution in countries with strong government intervention. This study deepens the knowledge of the patterns of city size distribution and its formation mechanism, and provides strong empirical support for the formation of a reasonable city size distribution. In the future, China should reshape the national economic geography by constructing an appropriately equalized city size distribution, expanding the two-way internal and external openness, and applying new generation information technologies.
表1 各变量描述性统计Tab.1 Descriptive statistics of variables |
| 变量 | 单位 | 平均值 | 标准差 | 最小值 | 最大值 |
|---|---|---|---|---|---|
| Pareto1(ln) | — | -0.218 | 0.241 | -1.231 | 0.867 |
| 城市河流密度(ln) | km/km2 | -1.324 | 0.531 | -3.771 | 2.295 |
| 地表粗糙度(ln) | — | 5.232 | 1.138 | -0.698 | 8.213 |
| 人均GDP(ln) | 美元/人 | 8.485 | 1.512 | 5.285 | 11.431 |
| 城市总人口(ln) | 人 | 20.396 | 1.458 | 16.938 | 25.135 |
| 城市人口密度(ln) | 人/km2 | 9.407 | 0.734 | 7.508 | 13.098 |
| 进出口贸易总额占GDP比重(ln) | % | 4.257 | 0.546 | -1.295 | 5.728 |
| 工业增加值占GDP比重(ln) | % | 3.278 | 0.381 | 1.516 | 4.440 |
| 制造业与服务业增加值之比(ln) | — | -1.443 | 0.538 | -3.678 | 0.725 |
| 铁路密度(ln) | km/100 km2 | -4.341 | 1.462 | -11.216 | -2.095 |
| 互联网普及率(ln) | % | 2.540 | 1.974 | -8.794 | 4.602 |
| 政府支出占GDP比重(ln) | % | 2.667 | 0.377 | 0.722 | 3.401 |
| 公民政治权利指数① | — | 3.489 | 2.157 | 1 | 7 |
| 国家脆弱指数② | — | 8.463 | 6.442 | 0 | 24 |
注:① Freedom House将该指数分为自由(1~2)、半自由(3~5)和非自由(6~7) 3个级别;② 国家脆弱指数分为低等脆弱(0~7)、中等脆弱(8~16)、高等脆弱(17~24) 3类;括号中ln表示变量取自然对数,下同。 |
图2 2000—2018年国家城市规模分布和影响因素时间演化特征Fig.2 Temporal change of city size distribution at the national level and influencing factors, 2000-2018 |
表2 国家城市规模分布影响因素及异质性Tab.2 Influencing factors of city size distribution at the national level and their heterogeneity across countries |
| 变量 | Pareto1(ln) | ||||||
|---|---|---|---|---|---|---|---|
| 所有国家 | 高收入国家 | 低收入国家 | 制造业为主国家 | 服务业为主国家 | 强政府干预国家 | 弱政府干预国家 | |
| 河流密度(ln) | 0.3790*** | 0.3860*** | 0.4830*** | 0.4670*** | 0.3900*** | 0.5130*** | -0.0038 |
| (0.1120) | (0.1050) | (0.1570) | (0.1650) | (0.1210) | (0.0860) | (0.1830) | |
| 地表粗糙度(ln) | -0.1050* | -0.0435*** | -0.2580*** | -0.0317** | -0.0574 | -0.0282** | -0.2850*** |
| (0.0571) | (0.0119) | (0.0426) | (0.0158) | (0.1660) | (0.0139) | (0.0452) | |
| 人均GDP(ln) | 0.0358 | 0.0372 | -0.0069 | 7.43E-05 | -0.1250* | -0.0617 | -0.1740** |
| (0.0553) | (0.1030) | (0.0776) | (0.0798) | (0.0657) | (0.0777) | (0.0763) | |
| 城市人口(ln) | -0.0727 | 0.1230 | -0.0710 | 0.0221 | -0.2090 | -0.3260** | 0.1830 |
| (0.1030) | (0.2570) | (0.1120) | (0.1420) | (0.1990) | (0.1510) | (0.2010) | |
| 城市人口密度(ln) | 0.1880** | -0.0349 | 0.1820** | 0.2150*** | -0.1190* | 0.1380* | -0.1470* |
| (0.0918) | (0.0659) | (0.0812) | (0.0665) | (0.0688) | (0.0731) | (0.0868) | |
| 进出口贸易总额占 | 0.0257 | 0.1440* | -0.0518 | -0.0767 | -0.1000 | -0.0132 | -0.0916 |
| GDP比重(ln) | (0.0531) | (0.0759) | (0.0499) | (0.0523) | (0.0805) | (0.0598) | (0.0600) |
| 工业增加值占 | 0.1780** | -0.1980 | 0.2240*** | 0.1760* | 0.1640 | 0.0368 | 0.3350*** |
| GDP比重(ln) | (0.0714) | (0.1420) | (0.0796) | (0.0918) | (0.1350) | (0.1090) | (0.0975) |
| 制造业与服务业 | -0.0803 | 0.1030 | 0.00924 | 0.0413 | 0.0371 | 0.0792 | -0.0467 |
| 增加值之比(ln) | (0.0704) | (0.0871) | (0.0521) | (0.0499) | (0.0909) | (0.0562) | (0.0493) |
| 铁路密度(ln) | -0.0145 | -0.0051 | -0.1040* | -0.1270** | -0.0074 | 0.0016 | -0.1510** |
| (0.0089) | (0.0092) | (0.0571) | (0.0523) | (0.0076) | (0.0050) | (0.0671) | |
| 互联网普及率(ln) | -0.0078 | 0.0234 | -0.0005 | 0.0008 | 0.0158 | 0.0215** | -0.0236 |
| (0.0110) | (0.0282) | (0.0141) | (0.0139) | (0.0182) | (0.0104) | (0.0153) | |
| 政府支出占 | 0.0347 | -0.0353 | 0.0786 | 0.1290 | 0.0890 | 0.2800** | 0.0227 |
| GDP比重(ln) | (0.0643) | (0.1040) | (0.0646) | (0.0779) | (0.0874) | (0.1170) | (0.0786) |
| 公民政治权利半自由 | -0.0371 | 0.0571** | -0.0922 | -0.0655 | -0.3440*** | -0.1930** | -0.1690* |
| (0.0801) | (0.0223) | (0.0775) | (0.0542) | (0.0683) | (0.0918) | (0.0857) | |
| 公民政治权利自由 | -0.0941 | — | -0.1580* | -0.1150** | — | -0.1910* | — |
| (0.0656) | — | (0.0840) | (0.0562) | — | (0.0980) | — | |
| 中等脆弱 | -0.0410 | 0.0054 | -0.0422 | -0.0640* | -0.0331 | -0.0578** | -0.0701* |
| (0.0317) | (0.0362) | (0.0272) | (0.0362) | (0.0519) | (0.0288) | (0.0410) | |
| 高等脆弱 | -0.1370* | — | -0.1380** | -0.1410 | 0.0648 | -0.0017 | -0.1670 |
| (0.0721) | — | (0.0621) | (0.0915) | (0.1050) | (0.0707) | (0.1180) | |
| 时间 | 控制 | 控制 | 控制 | 控制 | 控制 | 控制 | 控制 |
| 国家 | 控制 | 控制 | 控制 | 控制 | 控制 | 控制 | 控制 |
| 常数 | -0.6120 | -1.8450 | 0.5860 | -2.9570 | 6.9020 | 5.9960 | -1.1140 |
| (2.3500) | (5.7770) | (2.8920) | (3.4140) | (4.1670) | (3.9190) | (4.7470) | |
| 观测值 | 303 | 131 | 172 | 187 | 116 | 194 | 109 |
| 样本国家数 | 89 | 30 | 59 | 67 | 44 | 55 | 45 |
| R2 | 0.413 | 0.441 | 0.639 | 0.588 | 0.484 | 0.575 | 0.712 |
注:① 括号内数值为稳健标准误;***、**、* 分别代表在1%、5%和10%的水平下通过显著性检验;② 进行分样本回归的时,一些指标在样本量少的分组中由于共线性被自动剔除掉;③ 高、低收入国家分类参考世界银行标准;制造业、服务业为主国家,强、弱政府干预国家类型的划分取决于样本高于或低于相应指标在全球的平均值。 |
表3 本文与近年来全球尺度城市规模分布影响因素相关研究对比Tab.3 Comparison between this study and recent studies on influencing factors of city size distribution at the global scale |
| 比较内容 | 本文 | 张亮靓等[9] | 盛科荣等[15] | Soo[28] |
|---|---|---|---|---|
| 研究样本 | 全球89个国家 | 全球100多个国家 | 57个国家和地区 | 全球73个国家 |
| 人口数据 来源 | Landscan人口数据、欧空局土地利用类型数据 | 2014年《世界城市化展望》 | City Population数据库 | City Population数据库 |
| 计量方法 | 面板固定效应模型 | 截面回归、面板固定效应模型 | 截面回归 | 混合横截面回归 |
| 研究内容 | 城市规模分布时空演化 城市规模分布影响因素 不同类型国家影响因素异质性分析 | 城市规模分布演变 城市规模分布影响因素 | 城市规模分布类型划分 城市规模分布影响因素 | 验证Zipf定律的适用性 城市规模分布影响因素 |
| 主要结论 | (1) 2000—2018年,国家城市规模分布总体均衡发展,而亚洲、欧洲部分国家城市规模分布有所极化 (2) 众多影响因素中,河流密度、城市人口密度、工业增加值占GDP比重的增加会促进城市规模分布向均衡发展;地表粗糙度、国家脆弱指数上升导致城市规模分布极化;城市人口和密度、工业化水平、经济发展水平、开放水平、交通基础设施水平以及政府干预程度对国家城市规模分布的影响均存在异质性,会因国家收入水平、产业结构和政府干预程度的不同存在差异 | (1) 1950—2010年,国家城市规模分布逐渐分散 (2) 从影响要素来看,土地面积、人口密度、二三产业产值占GDP比重促进城市规模分布的均衡;进出口贸易额占GDP比重、国家脆弱指数促进城市规模分布的极化;人均GDP先促进城市规模分布极化后促进城市规模分布均衡;城市化率、每百人固定电话订阅数、每百人互联网用户以及Freedom自由度对城市规模分布的影响不明显 | (1) 全球各国城市规模分布分为5种类型 (2) 影响因素层面,进出口贸易额占GDP比重、每千人机动车拥有量以及民主化或降低首位城市的集聚度;区域人口数量、人均GDP会促使人口向高位序城市集聚;而城市化率对城市规模分布的影响则不显著 | (1) 全球73个国家中,大部分国家城市规模分布都不符合Zipf定律 (2) 影响因素中,人口规模,人均GDP、规模经济、政府支出占GDP比重、战争促进了城市规模分布的分散;二三产业产值占GDP比重、交通成本促进了城市规模分布的集聚;进出口贸易额占GDP比重、土地面积对城市规模分布的影响不明显 |
| [1] |
联合国. 世界城市化展望 (2018修订版)[EB/OL]. 2018-05-16 [2021-01-01]. https://www.un.org/development/desa/publications/2018-revision-of-world-urbanization-prospects.html
[United Nations. World Urbanization Prospects (2018 Revised Version). 2018-05-16 [2021-01-01]. https://www.un.org/development/desa/publications/2018-revision-of-world-urbanization-prospects.html
|
| [2] |
国家统计局. 中国农村发展报告(2020) [EB/OL]. 2020-08-19 [2021-01-01]. http://www.stats.gov.cn/
[National Bureau of Statistics. China rural development report (2020). 2020-08-19[2021-01-01]. http://www.stats.gov.cn/
|
| [3] |
|
| [4] |
|
| [5] |
沈体雁, 劳昕. 国外城市规模分布研究进展及理论前瞻-基于齐普夫定律的分析[J]. 世界经济文汇, 2012(5):95-111.
[
|
| [6] |
魏守华, 周山人, 千慧雄. 中国城市规模偏差研究[J]. 中国工业经济, 2015, 33(4):5-17.
[
|
| [7] |
万庆, 吴传清, 罗翔, 等. 中国城市规模分布时空演化特征: 基于“五普”和“六普”人口统计数据的实证研究[J]. 经济地理, 2018, 38(4):81-90.
[
|
| [8] |
孙斌栋, 金晓溪, 林杰. 走向大中小城市协调发展的中国新型城镇化格局: 1952年以来中国城市规模分布演化与影响因素[J]. 地理研究, 2019, 38(1):75-84.
[
|
| [9] |
张亮靓, 孙斌栋. 极化还是均衡: 重塑大国经济地理的战略选择: 城市规模分布变化和影响因素的跨国分析[J]. 地理学报, 2017, 72(8):1419-1431.
[
|
| [10] |
王超, 阚瑷珂, 曾业隆, 等. 基于随机森林模型的西藏人口分布格局及影响因素[J]. 地理学报, 2019, 74(4):664-680.
[
|
| [11] |
李琬, 孙斌栋, 刘倩倩, 等. 中国市域空间结构的特征及其影响因素[J]. 地理科学, 2018, 38(5):672-680.
[
|
| [12] |
赵彤彤, 宋邦国, 陈远生, 等. 西藏一江两河地区人口分布与地形要素关系分析[J]. 地球信息科学学报, 2017, 19(2):225-237.
[
|
| [13] |
刘修岩, 李松林, 陈子扬. 多中心空间发展模式与地区收入差距[J]. 中国工业经济, 2017(10):25-43.
[
|
| [14] |
刘修岩. 空间效率与区域平衡: 对中国省级层面集聚效应的检验[J]. 世界经济, 2014, 37(1):55-80.
[
|
| [15] |
盛科荣, 金耀坤, 纪莉. 城市规模分布的影响因素: 基于跨国截面数据的经验研究[J]. 经济地理, 2013, 33(1):66-71, 65.
[
|
| [16] |
孙斌栋, 华杰媛, 李琬, 等. 中国城市群空间结构的演化与影响因素: 基于人口分布的形态单中心—多中心视角[J]. 地理科学进展, 2017, 36(10):1294-1303.
[
|
| [17] |
叶浩, 庄大昌. 城市体系规模结构研究的新方法: 位序累积规模模型[J]. 地理科学, 2017, 37(6):825-832.
[
|
| [18] |
刘修岩, 文意豪. 中国省域城市体系多中心发展水平的测度与影响因素[J]. 浙江学刊, 2020(1):100-110.
[
|
| [19] |
|
| [20] |
李威, 王珺, 陈昊. 国际贸易、运输成本与城市规模分布: 基于中国省区数据的研究[J]. 南方经济, 2017(11):85-102.
[
|
| [21] |
胡晨光, 孙久文, 王婷婷. 大都市带基础设施, 城市规模与城市经济增长: 一个中介效应与调节效应的综合分析框架[J]. 中国软科学, 2020(10):85-95.
[
|
| [22] |
鲍超, 陈小杰. 中国城市体系的空间格局研究评述与展望[J]. 地理科学进展, 2014, 33(10):1300-1311.
[
|
| [23] |
|
| [24] |
|
| [25] |
|
| [26] |
|
| [27] |
|
| [28] |
|
| [29] |
|
| [30] |
|
| [31] |
|
| [32] |
彭昱, 周尹. 城市人口集聚与服务业发展[J]. 财经问题研究, 2016(12):35-40.
[
|
/
| 〈 |
|
〉 |
