
中国城市空气污染时空分布格局和人口暴露风险
|
肖嘉玉(1996— ),女,湖南娄底人,硕士生,研究方向为环境信息系统。E-mail: xiaojiayu1996@163.com |
收稿日期: 2020-10-05
要求修回日期: 2021-05-14
网络出版日期: 2021-12-28
基金资助
深圳市科技计划项目(JCYJ20150630153917252)
版权
Spatiotemporal pattern and population exposure risks of air pollution in Chinese urban areas
Received date: 2020-10-05
Request revised date: 2021-05-14
Online published: 2021-12-28
Supported by
Shenzhen Science and Technology Project(JCYJ20150630153917252)
Copyright
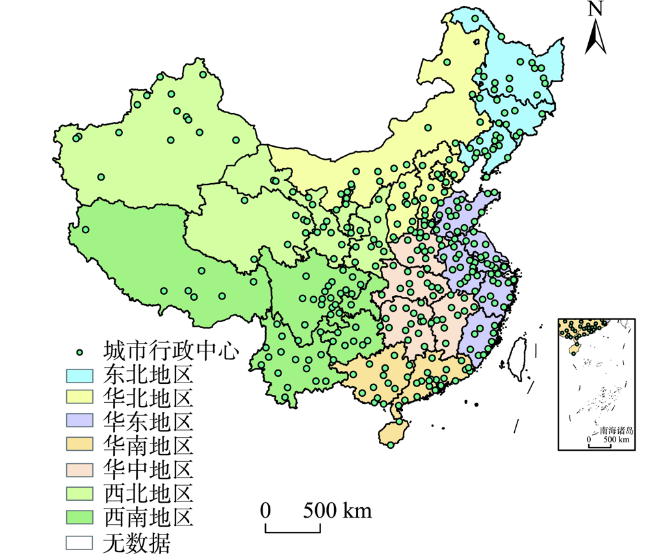
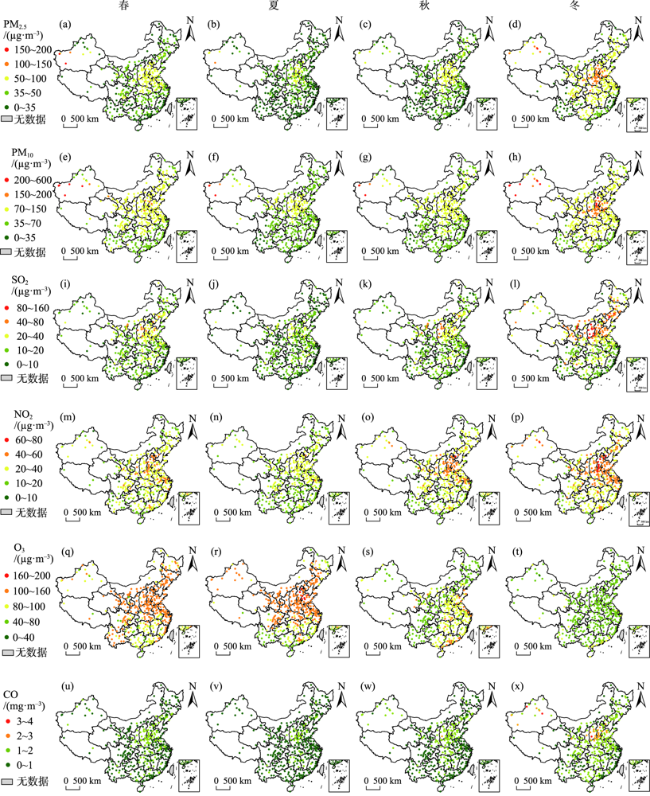
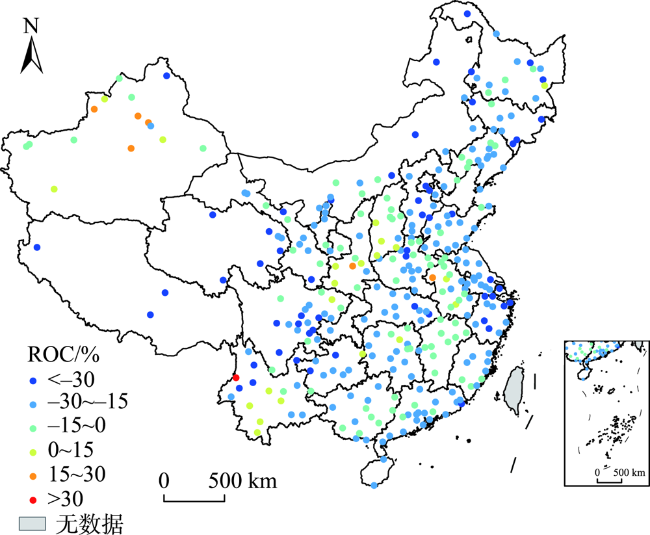
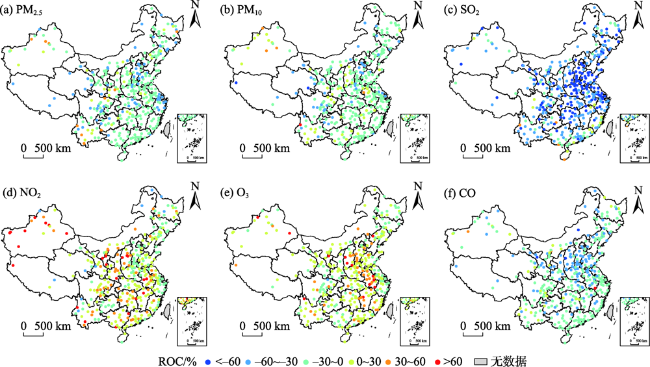
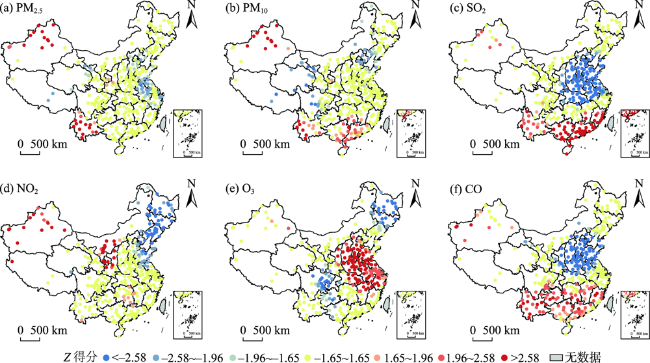
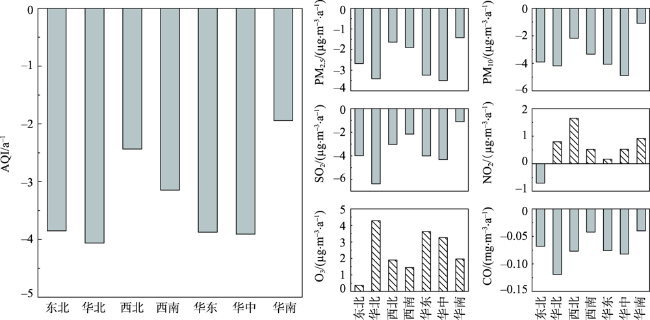
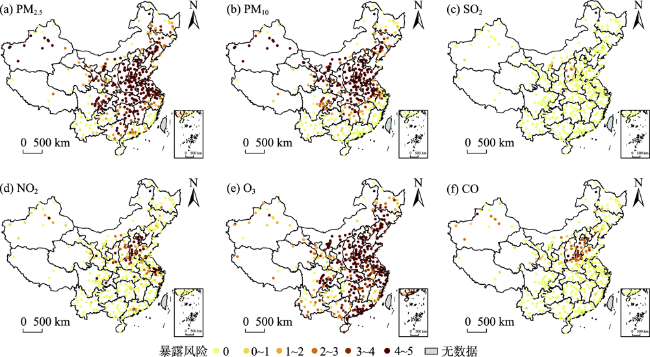
近年来,中国空气污染及其对人口健康危害的时空分布呈现出新的特征。论文使用5 a(2015—2019年)间逐小时的空气质量监测数据,利用变化率计算、热点分析、趋势分析和超标频数统计等方法,分析了中国332个城市的空气质量及人口空气污染暴露风险的时空分布特征,结论如下:① 中国城市近年来空气质量有好转趋势,环境空气质量指数(AQI)下降的城市占所研究城市总数的91.3%;PM2.5、PM10、SO2和CO等4种污染物浓度均有所下降,而NO2和O3浓度有所上升;② PM2.5、PM10、SO2和CO浓度变化率的热点分布于新疆地区和云南—华南地区,NO2浓度变化率的热点为新疆地区和河套平原,O3浓度变化率的热点为华北平原至长江中下游流域;西北地区和华南地区空气质量变化幅度较小;③ 9个城市在PM2.5、PM10、SO2、NO2、O3和CO等6种污染物中均有暴露,分布于山西、河北与山东。暴露风险均为0级的低风险城市共有12个,分别位于新疆、云南、贵州、四川、广东、福建和黑龙江。研究结论对于跨区域空气污染的协同治理以及制定差异化的空间人口流动管理政策具有重要参考价值。
肖嘉玉 , 何超 , 慕航 , 杨璐 , 黄佳伊 , 辛艾萱 , 涂佩玥 , 洪松 . 中国城市空气污染时空分布格局和人口暴露风险[J]. 地理科学进展, 2021 , 40(10) : 1650 -1663 . DOI: 10.18306/dlkxjz.2021.10.004
In recent years, the spatiotemporal distribution and its hazards to republic health of air pollution in China have shown new characteristics. Using hourly air quality monitoring data for five years (2015-2019) in 332 Chinese cities, this study analyzed the spatiotemporal distribution characteristics of air quality and urban population exposure risks by different methods. The results suggest that: 1) Air quality in Chinese urban areas has improved in recent years. Ambient Air Quality Index (AQI) decreased in 303 cities (91.3%). The concentrations of PM2.5, PM10, SO2, and CO declined while the concentrations of NO2 and O3 increased. 2) The hotspots of PM2.5, PM10, SO2, and CO concentration change rates were distributed in Xinjiang and Yunnan-South China. The hotspots of NO2 concentration change rate were in the Xinjiang area and the Hetao Plain. The hotspots of O3 concentration change rate were from the North China Plain to the middle and lower reaches of the Yangtze River. The trends of air quality change in the Northwest and South China were relatively slow. 3) Nine cities were exposed to PM2.5, PM10, SO2, NO2, O3, and CO pollution, which were located in Shanxi, Hebei, and Shandong provinces; 12 cities had no exposure risks to these six pollutants, which were distributed in Xinjiang, Yunnan, Guizhou, Sichuan, Guangdong, Fujian, and Heilongjiang provinces. These conclusions are of important reference value for collaborative treatment of cross-regional air pollution and formulating spatially diffenrentiated population flow management policies in China.
Key words: cities; air pollution; hotspot analysis; exposure risks; China
表1 空气污染指标与风险评估标准Tab.1 Air pollution indicators and risk evaluation standard |
| 指标 | 单位 | 平均时间 | 浓度限值 | 备注 |
|---|---|---|---|---|
| PM2.5 | μg·m-3 | 年平均 | 35 | — |
| 24 h平均 | 75 | — | ||
| PM10 | μg·m-3 | 年平均 | 70 | — |
| 24 h平均 | 150 | — | ||
| SO2 | μg·m-3 | 年平均 | 60 | — |
| 24 h平均 | 150 | — | ||
| NO2 | μg·m-3 | 年平均 | 40 | — |
| 24 h平均 | 80 | — | ||
| O3 | μg·m-3 | 日最大8 h平均 | 160 | 每年第四高的O3日最大8 h平均浓度达标,则该年O3浓度达标 |
| CO | mg·m-3 | 24 h平均 | 4 | 每年超标天数≤1,则该年CO浓度达标 |
表2 中国城市2015—2019年7项指标年均值与变化率Tab.2 Annual average value and change rate of seven air pollution indicators in Chinese cities, 2015-2019 |
| 指标 | 2015年 | 2016年 | 2017年 | 2018年 | 2019年 | ROC/% |
|---|---|---|---|---|---|---|
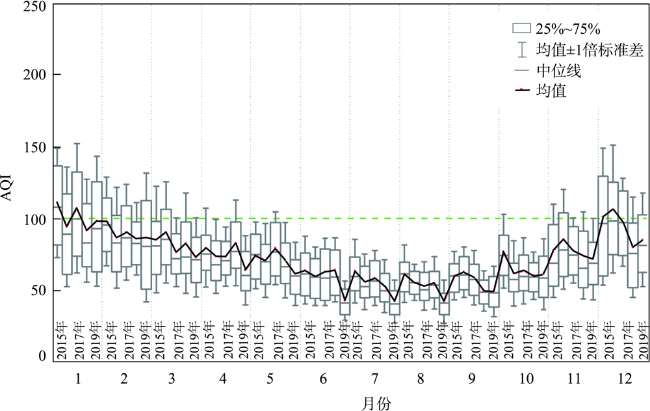
| AQI | 79.2 | 75.1 | 74.8 | 70.8 | 64.7 | -18.4 |
| PM2.5/(μg·m-3) | 49.7 | 45.9 | 43.5 | 39.1 | 40.2 | -19.1 |
| PM10/(μg·m-3) | 87.0 | 82.2 | 79.2 | 75.9 | 72.9 | -16.3 |
| SO2/(μg·m-3) | 25.0 | 21.6 | 18.0 | 13.6 | 11.2 | -55.2 |
| NO2/(μg·m-3) | 28.8 | 29.1 | 30.1 | 27.3 | 32.6 | 13.2 |
| O3/(μg·m-3) | 83.7 | 87.5 | 93.4 | 95.3 | 92.3 | 10.3 |
| CO/(mg·m-3) | 1.08 | 1.04 | 0.97 | 0.85 | 0.81 | -24.8 |
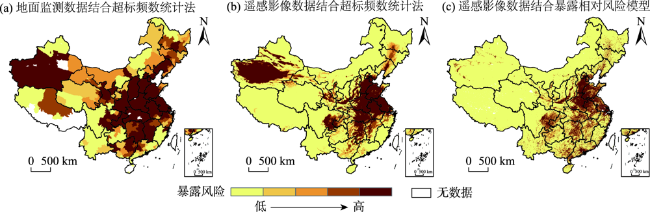
图8 中国城市2015—2019年空气污染物暴露风险空间分布Fig.8 Spatial distribution of exposure risks to air pollution in Chinese cities, 2015-2019 |
表3 中国空气污染物不同暴露风险等级的城市数量 (个)Tab.3 The number of cities under different exposure risk levels of air pollution in China |
| 暴露风险等级 | PM2.5 | PM10 | SO2 | NO2 | O3 | CO |
|---|---|---|---|---|---|---|
| 0 | 62 | 99 | 317 | 224 | 28 | 253 |
| 1 | 27 | 27 | 9 | 40 | 27 | 36 |
| 2 | 17 | 21 | 3 | 13 | 29 | 7 |
| 3 | 30 | 24 | 3 | 14 | 29 | 22 |
| 4 | 32 | 29 | 0 | 11 | 46 | 10 |
| 5 | 164 | 132 | 0 | 30 | 173 | 4 |
表4 中国2015—2019年空气污染超标天数全年占比的城市数量变化 (个)Tab.4 Changes in the number of Chinese cities with different annual percentage of days exceeding the air quality standards, 2015-2019 |
| 污染物 | 超标天数全年占比/% | 2015年 | 2016年 | 2017年 | 2018年 | 2019年 |
|---|---|---|---|---|---|---|
| PM2.5 | 0 | 11 | 12 | 20 | 24 | 38 |
| 0~5 | 65 | 89 | 101 | 111 | 109 | |
| 5~10 | 48 | 49 | 77 | 82 | 66 | |
| 10~20 | 100 | 86 | 81 | 65 | 71 | |
| 20~30 | 56 | 58 | 48 | 44 | 46 | |
| 30~50 | 38 | 35 | 5 | 6 | 1 | |
| >50 | 14 | 3 | 0 | 0 | 1 | |
| PM10 | 0 | 30 | 40 | 44 | 48 | 68 |
| 0~5 | 93 | 113 | 147 | 134 | 151 | |
| 5~10 | 66 | 67 | 63 | 55 | 49 | |
| 10~20 | 85 | 53 | 55 | 69 | 45 | |
| 20~30 | 27 | 29 | 16 | 17 | 13 | |
| 30~50 | 26 | 27 | 5 | 5 | 4 | |
| >50 | 5 | 3 | 2 | 4 | 2 | |
| SO2 | 0 | 257 | 294 | 307 | 320 | 328 |
| 0~5 | 62 | 28 | 21 | 11 | 4 | |
| 5~10 | 8 | 3 | 2 | 1 | 0 | |
| 10~20 | 5 | 7 | 2 | 0 | 0 | |
| >20 | 0 | 0 | 0 | 0 | 0 | |
| NO2 | 0 | 170 | 189 | 195 | 210 | 225 |
| 0~5 | 133 | 113 | 123 | 110 | 99 | |
| 5~10 | 19 | 21 | 11 | 11 | 8 | |
| 10~20 | 10 | 9 | 3 | 1 | 0 | |
| >20 | 0 | 0 | 0 | 0 | 0 | |
| O3 | 0 | 54 | 54 | 30 | 28 | 45 |
| 0~5 | 163 | 143 | 134 | 130 | 122 | |
| 5~10 | 49 | 68 | 60 | 65 | 66 | |
| 10~20 | 60 | 62 | 81 | 77 | 66 | |
| 20~30 | 6 | 5 | 25 | 29 | 33 | |
| 30~50 | 0 | 0 | 2 | 3 | 0 | |
| >50 | 0 | 0 | 0 | 0 | 0 | |
| CO | 0 | 246 | 268 | 279 | 317 | 312 |
| 0~5 | 75 | 57 | 51 | 14 | 20 | |
| 5~10 | 9 | 6 | 1 | 1 | 0 | |
| 10~20 | 2 | 1 | 1 | 0 | 0 | |
| >20 | 0 | 0 | 0 | 0 | 0 |
| [1] |
|
| [2] |
|
| [3] |
|
| [4] |
|
| [5] |
|
| [6] |
|
| [7] |
|
| [8] |
|
| [9] |
|
| [10] |
|
| [11] |
|
| [12] |
|
| [13] |
彭远新, 林振山. 能源消费产生的SO2和工业烟尘排放量时空演变分析[J]. 自然资源学报, 2010, 25(1):52-59.
[
|
| [14] |
周亮, 周成虎, 杨帆, 等. 2000—2011年中国PM2.5时空演化特征及驱动因素解析[J]. 地理学报, 2017, 72(11):2079-2092.
[
|
| [15] |
|
| [16] |
|
| [17] |
|
| [18] |
|
| [19] |
|
| [20] |
|
| [21] |
韩立建. 城市化与PM2.5时空格局演变及其影响因素的研究进展[J]. 地理科学进展, 2018, 37(8):1011-1021.
[
|
| [22] |
|
| [23] |
|
| [24] |
环境保护部, 国家质量监督检验检疫总局. 环境空气质量标准(GB 3095—2012)[S]. 北京: 中国环境科学出版社, 2016.
[Ministry of Environment Protection of the People's Republic of China, General Administration of Quality Supervision, Inspection and Quarantine of the People's Republic of China. Ambient air quality standards, GB 3095-2012. Beijing, China: China Environment Science Press, 2016. ]
|
| [25] |
Environmental Protection Agency, USA. NAAQS table[EB/OL]. 2015 [2020-12-06]. https://www.epa.gov/criteria-air-pollutants/naaqs-table.
|
| [26] |
邹滨, 彭芬, 焦利民, 等. 高分辨率人口空气污染暴露GIS空间区划研究[J]. 武汉大学学报(信息科学版), 2013, 38(3):334-338.
[
|
| [27] |
张亮林, 潘竟虎. 中国PM2.5人口暴露风险时空格局[J]. 中国环境科学, 2020, 40(1):1-12.
[
|
| [28] |
|
| [29] |
|
| [30] |
程雪雁, 朱磊, 周艺萱. 2015—2018年京津冀城市群空气污染时空变化特征[J]. 北京师范大学学报(自然科学版), 2019, 55(4):523-531.
[
|
| [31] |
蔺雪芹, 王岱. 中国城市空气质量时空演化特征及社会经济驱动力[J]. 地理学报, 2016, 71(8):1357-1371.
[
|
| [32] |
刘欢, 席鹏辉. 中国存在环境移民吗? 来自空气质量指数测算改革的自然实验[J]. 经济学动态, 2019(12):38-54.
[
|
| [33] |
洪大用, 范叶超, 李佩繁. 地位差异、适应性与绩效期待: 空气污染诱致的居民迁出意向分异研究[J]. 社会学研究, 2016, 31(3):1-24, 242.
[
|
/
| 〈 |
|
〉 |