
大城市制造业企业空间扩张模式及其对企业效率的影响——以北京市上市企业为例
|
张可云(1964— ),男,湖南临湘人,博士,教授,博士生导师,主要从事区域经济政策及区域经济合作与冲突等研究。E-mail: zkeyun@ruc.edu.cn |
收稿日期: 2020-12-25
要求修回日期: 2021-06-05
网络出版日期: 2021-12-28
基金资助
国家自然科学基金青年科学基金项目(72003190)
国家社会科学基金青年项目(19CJY002)
版权
Spatial expansion mode of manufacturing firms in big cities and its impact on firm efficiency: A case study of Beijing listed firms
Received date: 2020-12-25
Request revised date: 2021-06-05
Online published: 2021-12-28
Supported by
National Natural Science Foundation of China(72003190)
National Social Science Foundation of China(19CJY002)
Copyright
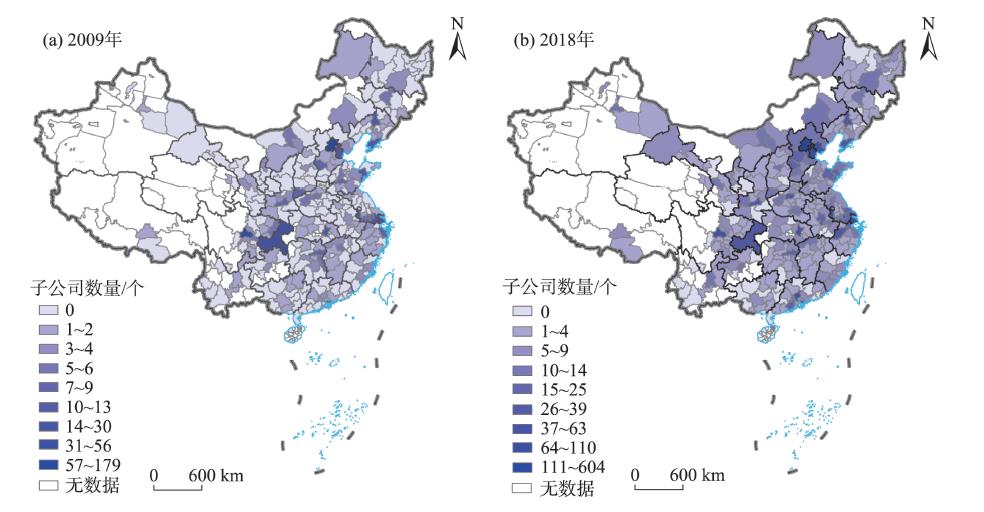
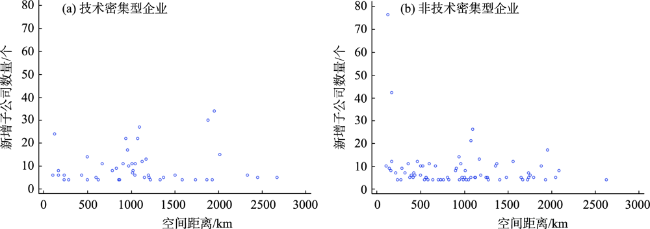
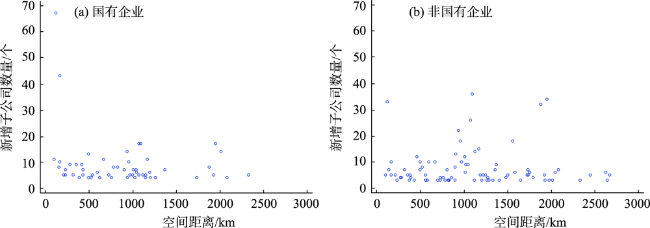
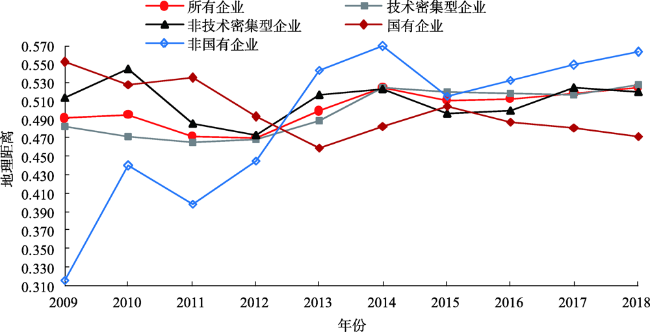
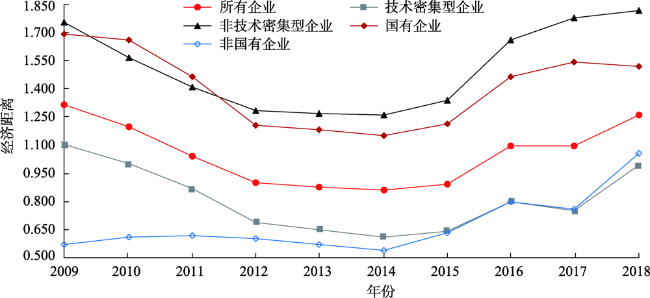
企业空间扩张对企业效率与区域协调发展具有重要意义。论文基于2009—2018年北京市制造业上市企业及其子公司微观数据,通过子公司空间分布变化分析了企业空间扩张模式,并分析了扩张带来的企业总部与子公司之间距离的变化,进一步采用动态面板计量方法,实证检验了总部与子公司之间地理距离与经济距离的变化对不同扩张模式的制造业企业效率的影响。研究发现:① 在样本期内,北京市制造业上市企业扩张规模较大,空间扩张模式由等级扩散转变为等级扩散与接触扩散相结合,且以接触扩散为主;总部与子公司之间的地理距离呈上升趋势,经济距离先下降后上升。其中,技术密集型企业与非国有企业倾向于等级扩散,非技术密集型企业与国有企业倾向于接触扩散。② 对以接触扩散为主要扩张模式的企业来说,总部与子公司之间的地理距离与企业效率负相关,而以等级扩散为主要扩张模式的企业效率受地理距离影响不显著。③ 无论企业扩张模式如何,总部与子公司之间的经济距离均与企业效率正相关。因此,不同类型的制造业企业应选择不同的扩张策略。
张可云 , 裴相烨 . 大城市制造业企业空间扩张模式及其对企业效率的影响——以北京市上市企业为例[J]. 地理科学进展, 2021 , 40(10) : 1613 -1625 . DOI: 10.18306/dlkxjz.2021.10.001
Firms spatial expansion is of great significance to enterprise efficiency and regional coordinated development. Based on the data of listed manufacturing firms in Beijing and their subsidiaries from 2009 to 2018, this study examined the enterprise spatial expansion model through the changes of spatial distribution of subsidiaries, and analyzed the change of the distance between headquarters and subsidiaries brought by expansion. Furthermore, the dynamic panel measurement method was used to empirically test the impact of the change of geographical distance and economic distance between headquarters and subsidiaries on the efficiency of manufacturing enterprises with different expansion modes. The study found that: First, during the study period, the scale of expansion of the sample listed manufacturing firms in Beijing was relatively large, and the spatial expansion mode has changed from hierarchical diffusion to a combination of hierarchical diffusion and contagious diffusion, with contagious diffusion as the dominant mode. The geographical distance between headquarters and subsidiaries showed an upward trend, and the economic distance first decreased and then increased. Among these firms, technology-intensive firms and non-state-owned firms tend to experience hierarchical diffusion, while non-technology-intensive firms and state-owned firms tend to undergo contagious diffusion. Second, for the firms with contagious diffusion as the main expansion mode, geographical distance between headquarters and subsidiaries was negatively correlated with firm efficiency, but the efficiency of firms that did not take contagious diffusion as the main mode of expansion was not affected by geographical distance. Third, regardless of firm expansion mode, economic distance between headquarters and subsidiaries was positively correlated with firm efficiency. Therefore, different types of manufacturing firms should choose different expansion strategies.
图2 2009—2018年技术密集型(a)与非技术密集型(b)企业子公司数量变化分布Fig.2 Distribution of subsidiaries of technology-intensive (a) and non-technology-intensive (b) firms, 2009-2018 |
表1 全部样本企业变量的描述性统计(N=833)Tab.1 Descriptive statistics of all sample firms variables (N=833) |
| 变量 | 均值 | 标准差 | 最小值 | 最大值 |
|---|---|---|---|---|
| ln TFP | 2.074 | 0.168 | 1.619 | 2.478 |
| ln (GD+1) | 0.393 | 0.184 | 0 | 0.775 |
| ED | 1.449 | 1.589 | -3.226 | 5.232 |
| Roa | 5.694 | 7.483 | -26.710 | 77.190 |
| ln Age | 2.659 | 0.380 | 0 | 3.466 |
| ln Size | 13.043 | 1.467 | 10.331 | 17.440 |
| Growth | 26.909 | 57.075 | -69.313 | 538.274 |
注:个别企业上市时间比成立时间晚1 a,故 出现了零值。 |
表2 地理距离对样本企业TFP影响估计结果Tab.2 Estimated results of the impact of geographical distance on the TFP of sample firms |
| 变量 | 所有企业 | 技术密集型企业 | 非技术密集型企业 | 国有企业 | 非国有企业 |
|---|---|---|---|---|---|
| L.ln TFP | 0.429*** | 0.789*** | 0.457*** | 0.451*** | 0.741*** |
| (3.276) | (13.384) | (3.717) | (5.364) | (7.180) | |
| ln (GD+1) | -0.115* | -0.049 | -0.152** | -0.055* | 0.061 |
| (-1.801) | (-0.757) | (-2.252) | (-1.655) | (1.366) | |
| L.ln (GD+1) | 0.073 | 0.035 | 0.054 | -0.060* | -0.054 |
| (1.207) | (0.520) | (0.914) | (-1.776) | (-1.296) | |
| Roa | 0.001** | 0.001 | 0.003*** | 0.003*** | 0.001 |
| (2.387) | (1.606) | (2.991) | (3.049) | (0.849) | |
| ln Age | 0.043 | 0.001 | 0.044 | 0.030** | 0.013 |
| (1.473) | (0.096) | (1.325) | (2.037) | (0.392) | |
| ln Size | 0.054*** | 0.017** | 0.053*** | 0.055*** | 0.018* |
| (3.447) | (2.215) | (3.383) | (6.380) | (1.945) | |
| Growth | 0.001 | 0.001** | -0.001 | -0.001 | 0.001*** |
| (0.990) | (2.315) | (-0.386) | (-0.933) | (2.882) | |
| 常数 | 0.386*** | 0.225*** | 0.370* | 0.390*** | 0.266*** |
| (4.238) | (2.767) | (1.931) | (3.989) | (2.638) | |
| AR(1)检验P值 | 0.002 | 0.001 | 0.061 | 0.017 | 0.003 |
| AR(2)检验P值 | 0.135 | 0.117 | 0.369 | 0.387 | 0.268 |
| Sargan检验 | 0.527 | 0.551 | 0.417 | 0.507 | 0.191 |
| 观测值 | 718 | 470 | 248 | 370 | 348 |
注:***、**、*分别表示通过1%、5%和10%的显著水平检验,括号内的值为标准误;使用GMM方法对动态面板估计时,不同工具变量的部分组合通过了AR(2)检验和Sargan检验,最终被解释变量TFP选择二阶或三阶滞后项,核心解释变量GD选择二阶、三阶、四阶滞后项作为“GMM式”工具变量;采用GMM方法增加滞后项做工具变量后会自动减少样本;L.ln TFP、L.ln (GD+1)表示滞后项。下同。 |
表3 经济距离对样本企业TFP影响估计结果Tab.3 Estimated results of the impact of economic distance on the TFP of sample firms |
| 变量 | 所有企业 | 技术密集型企业 | 非技术密集型企业 | 国有企业 | 非国有企业 |
|---|---|---|---|---|---|
| L.ln TFP | 0.510*** | 0.728*** | 0.497** | 0.217 | 0.729*** |
| (3.394) | (6.906) | (2.302) | (1.225) | (8.634) | |
| ED | 0.002** | 0.001* | 0.003* | 0.002* | 0.003** |
| (2.037) | (1.891) | (1.940) | (1.675) | (1.983) | |
| L.ED | 0.001* | 0.000 | 0.002 | 0.001 | -0.001 |
| (1.865) | (0.164) | (1.150) | (1.283) | (-0.469) | |
| Roa | 0.001*** | 0.001* | 0.003** | 0.001* | 0.001 |
| (3.068) | (1.935) | (2.024) | (1.794) | (0.956) | |
| ln Age | 0.003 | 0.020 | 0.030 | 0.041* | 0.021 |
| (0.140) | (1.051) | (1.276) | (1.730) | (0.674) | |
| ln Size | 0.056*** | 0.020** | 0.056** | 0.077*** | 0.019** |
| (3.302) | (2.247) | (2.089) | (3.415) | (2.134) | |
| Growth | 0.001 | 0.001*** | -0.001 | -0.001 | 0.001*** |
| (1.553) | (3.118) | (-0.089) | (-0.175) | (3.385) | |
| 常数 | 0.284*** | 0.246*** | 0.226* | 0.514*** | 0.256*** |
| (2.596) | (2.942) | (1.940) | (3.425) | (3.429) | |
| AR(1)检验P值 | 0.002 | 0.002 | 0.067 | 0.182 | 0.003 |
| AR(2)检验P值 | 0.147 | 0.139 | 0.340 | 0.334 | 0.259 |
| Sargan检验 | 0.558 | 0.403 | 0.354 | 0.266 | 0.367 |
| 观测值 | 718 | 470 | 248 | 370 | 348 |
| [1] |
李小建. 经济地理学[M]. 北京: 高等教育出版社, 2006.
[
|
| [2] |
王辑慈. 关于企业地理学研究价值的探讨[J]. 经济地理, 1992, 12(4):11-14.
[
|
| [3] |
|
| [4] |
费洪平. 多厂企业空间演化模式研究[J]. 地理科学, 1993, 13(4):322-330, 391.
[
|
| [5] |
|
| [6] |
|
| [7] |
|
| [8] |
|
| [9] |
|
| [10] |
|
| [11] |
|
| [12] |
费洪平. 论企业地理研究的理论与方法[J]. 干旱区地理, 1993, 16(1):49-56.
[
|
| [13] |
贺灿飞, 李燕, 尹薇. 跨国零售企业在华区位研究: 以沃尔玛和家乐福为例[J]. 世界地理研究, 2011, 20(1):12-26.
[
|
| [14] |
李金昌, 程开明. 等级扩散抑或传染扩散: 国美连锁店的扩张之路兼与沃尔玛比较[J]. 财贸经济, 2008(3):104-109.
[
|
| [15] |
高士博, 谷人旭, 王春萌, 等. “快时尚”企业空间扩张路径及演化特征研究: 以优衣库为例[J]. 世界地理研究, 2017, 26(1):102-111.
[
|
| [16] |
娄帆, 李小建, 陈晓燕. 大型劳动密集型企业快速扩张的区位分析: 以富士康为例[J]. 经济地理, 2016, 36(2):102-108.
[
|
| [17] |
卢明华, 周悦颜, 刘汉初, 等. 北京企业对河北直接投资的时空动态特征及影响因素[J]. 地理科学进展, 2020, 39(3):389-401.
[
|
| [18] |
胡国建, 陈传明, 陈丽娟, 等. 企业跨区域投资格局及其影响因素: 以福建上市企业为例[J]. 经济地理, 2018, 38(9):138-146.
[
|
| [19] |
徐宁, 李仙德. 上海上市公司对外投资网络演变及其影响因素研究[J]. 地理科学进展, 2020, 39(4):553-566.
[
|
| [20] |
|
| [21] |
|
| [22] |
|
| [23] |
李彬, 郑雯. 母子公司距离、风险承担与公司效率[J]. 经济管理, 2018, 40(4):50-68.
[
|
| [24] |
谢建国. 外商直接投资与中国的出口竞争力: 一个中国的经验研究[J]. 世界经济研究, 2003(7):34-39.
[
|
| [25] |
李强, 郑江淮. 基于产品内分工的我国制造业价值链攀升: 理论假设与实证分析[J]. 财贸经济, 2013(9):95-102.
[
|
| [26] |
曹春方, 贾凡胜. 异地商会与企业跨地区发展[J]. 经济研究, 2020, 55(4):150-166.
[
|
| [27] |
|
| [28] |
|
| [29] |
林毅夫. 发展战略、自生能力和经济收敛[J]. 经济学(季刊), 2002, 1(1):269-300.
[
|
| [30] |
|
| [31] |
张志强. 动态面板模型参数估计方法的比较研究[J]. 统计研究, 2017, 34(9):108-119.
[
|
| [32] |
|
| [33] |
席强敏. 企业迁移促进了全要素生产率提高吗? 基于城市内部制造业迁移的验证[J]. 南开经济研究, 2018(4):176-193.
[
|
| [34] |
李小建. 关于公司地理研究的几个问题[J]. 经济地理, 1991, 11(3):42-46.
[
|
| [35] |
|
| [36] |
陈岩, 翟瑞瑞, 郭牛森. 基于多元距离视角的中国对外直接投资决定因素研究[J]. 系统工程理论与实践, 2014, 34(11):2760-2771.
[
|
| [37] |
|
| [38] |
李国平, 孙铁山. 网络化大都市: 城市空间发展新模式[J]. 城市发展研究, 2013, 20(5):83-89.
[
|
| [39] |
陈立敏, 王小瑕. 中国企业并购绩效的影响因素研究: 基于资源基础观与制度基础观的实证分析[J]. 浙江大学学报(人文社会科学版), 2016, 46(6):162-174.
[
|
| [40] |
|
| [41] |
蔡之兵. 高质量发展的区域经济布局的形成路径: 基于区域优势互补的视角[J]. 改革, 2020(8):132-146.
[
|
| [42] |
李文宇, 刘洪铎. 多维距离视角下的“一带一路”构建—空间、经济、文化与制度[J]. 国际经贸探索, 2016, 32(6):99-112.
[
|
| [43] |
|
| [44] |
|
| [45] |
赵凤, 王铁男, 张良. 多元化战略对企业绩效影响的实证研究[J]. 中国软科学, 2012(11):111-122.
[
|
| [46] |
陈强. 高级计量经济学及Stata应用[M]. 2版. 北京: 高等教育出版社, 2014.
[
|
/
| 〈 |
|
〉 |