
土地利用变化情景下杭州湾北岸极端洪灾风险评估
|
姜丽(1995— ),女,江苏南通人,硕士生,研究方向为自然灾害与土地利用变化模拟。E-mail:jiangli181995@hotmail.com |
收稿日期: 2020-11-03
要求修回日期: 2021-04-18
网络出版日期: 2021-10-28
基金资助
国家自然科学基金项目(72074151)
国家自然科学基金项目(51761135024)
上海自然科学基金项目(20ZR1441500)
国家重点研发计划项目(2017YFC1503001)
版权
Risk assessment of extreme flood in the north bank of the Hangzhou Bay under land use change scenarios
Received date: 2020-11-03
Request revised date: 2021-04-18
Online published: 2021-10-28
Supported by
National Natural Science Foundation of China(72074151)
National Natural Science Foundation of China(51761135024)
Natural Science Foundation of Shanghai(20ZR1441500)
National Key Research and Development Program of China(2017YFC1503001)
Copyright
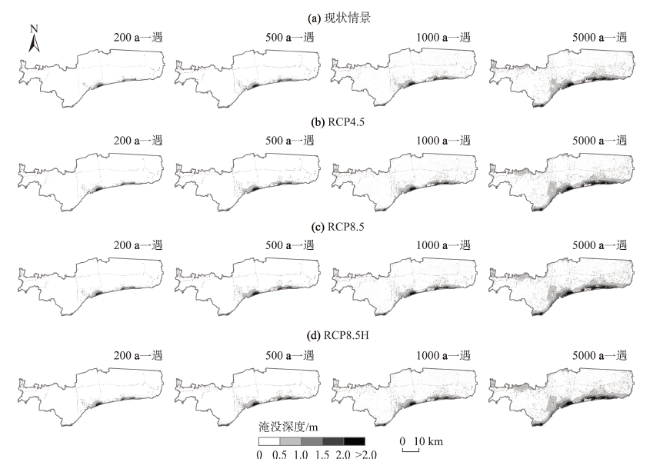
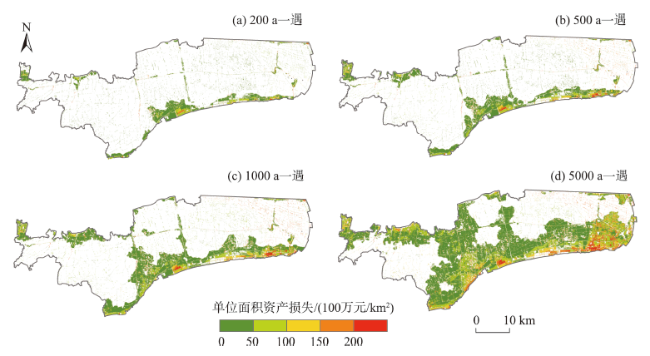
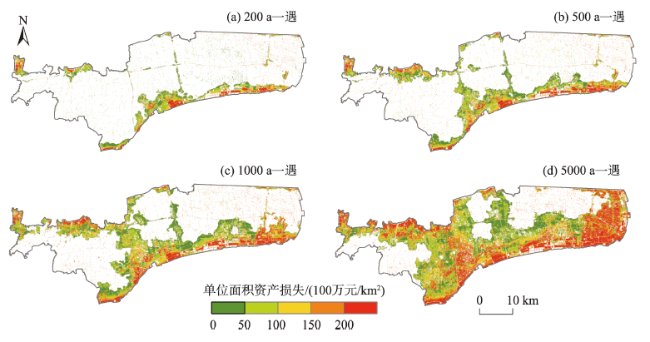
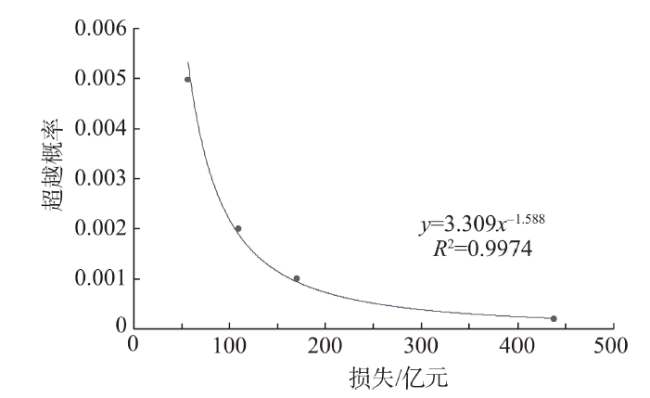
杭州湾位于长三角平原,该区域分布着大量的潮滩与湿地。未来随着海平面不断上升,更易引发自然灾害,尤其是风暴潮灾害,将使该地区社会经济发展面临巨大冲击。论文以多年土地利用与资产数据为基础,基于土地利用和资产的未来变化预测,结合多种未来极端洪灾情景,开展杭州湾北岸承灾体与暴露时空演化模拟,评估了上海市杭州湾北岸洪涝灾害风险。研究结果表明:从空间分布格局上看,现状情景下单位面积损失资产值的高值出现在浦东新区南部,而未来情景下单位面积损失值的高值覆盖整个杭州湾北岸南部沿海区域和金山区北部区域。就整个研究区而言,随着GDP的增长及极端洪灾情景下的暴露和淹没范围的增大,暴露资产和损失资产都在增长,年期望损失从现状情景的0.65亿元增长到未来典型浓度路径(RCP8.5H)情景下的3.04亿元。从风险评估结果来看,杭州湾北岸易遭受特大洪灾,必须实施洪灾风险敏感的城市规划,更新该地区的居民点和基础设施规划标准和规范。同时,应采取综合防范措施,加强杭州湾沿岸防洪能力。论文可为该区域未来城市规划、洪水风险应对措施和城市的韧性建设提供有效参考。研究方法相比传统的仅以当前土地利用及资产价值情景评估未来经济损失的方法更为合理有效,可为其他沿海地区的风险评估提供方法借鉴。
姜丽 , 於家 , 温家洪 , 唐进 , 齐蔓菲 , 王璐阳 , 张敏 . 土地利用变化情景下杭州湾北岸极端洪灾风险评估[J]. 地理科学进展, 2021 , 40(8) : 1355 -1370 . DOI: 10.18306/dlkxjz.2021.08.009
The Hangzhou Bay, located in the Yangtze River Delta, is characterized by broad distribution of tidal flats and wetlands. As sea levels continue to rise in the future, natural hazards, especially storm surges, will be more likely to occur, which will have a great impact on the socioeconomic development of the region. Based on multi-year land use and assets data, this study conducted a simulation of the spatiotemporal change of elements at risk and exposures in the north bank of the Hangzhou Bay. The simulation is based on predictions of future variations in land use and assets and multiple extreme flooding scenarios, in order to assess the losses of flood disasters in the region. The results show that: 1) High values of asset losses per unit area under the current scenario appear in the south of Pudong New District. In future scenarios, high values of asset losses per unit area will cover the entire southern coastal area and the northern Jinshan District in the north bank of the Hangzhou Bay. 2) The entire study area will witness a growth in asset exposure and losses under extreme flooding scenarios as the GDP and the exposed and inundated area increase. The expected annual damage will rise from 65 million yuan under the current scenario to 304 million yuan under the representative concentration pathway (RCP) 8.5H scenario in the future. The risk assessment results indicate that the north bank of the Hangzhou Bay is susceptible to extraordinarily large floods. Thus, risk-sensitive urban planning must be implemented. The standards and specifications on residential communities and infrastructures in the region must be updated. Meanwhile, comprehensive preventive measures must be taken to enhance the flood control capabilities along the banks of the Hangzhou Bay. This study can provide a basis for decision making of risk-based urban planning, flood-risk adaption measures, and resilience improvements within the study area. The proposed research method is more reasonable and effective than the traditional methods of assessing future economic losses, which are often based only on current land use and asset values. It can also provide a methodological reference for risk assessments of other coastal regions.
表1 SLEUTH模型主要参数设置和最终校正结果Tab.1 Main parameter setting and calibration results of the SLEUTH model |
| 控制参数 | 粗校正 | 精校正 | 终校正 | 最优控制系数 | |||||
|---|---|---|---|---|---|---|---|---|---|
| 蒙特卡洛迭代次数=5 | 蒙特卡洛迭代次数=8 | 蒙特卡洛迭代次数=10 | |||||||
| 范围 | 步长 | 范围 | 步长 | 范围 | 步长 | ||||
| 扩散系数 | 0~100 | 20 | 0~20 | 4 | 0~5 | 1 | 1 | ||
| 繁衍系数 | 0~100 | 20 | 1~20 | 4 | 1~17 | 4 | 4 | ||
| 蔓延系数 | 0~100 | 20 | 0~20 | 4 | 0~5 | 1 | 1 | ||
| 坡度阻碍系数 | 1 | 1 | 1 | 1 | 1 | 1 | 1 | ||
| 道路引力系数 | 0~100 | 20 | 1~80 | 8 | 1~20 | 6 | 19 | ||
| Lee-Sallee形状指数 | 0.48 | 0.48 | 0.48 | ||||||
表2 2006年土地利用模拟结果精度Tab.2 Accuracy of land use simulation results of 2006 |
| 土地利用 类型 | 2006年 | ||
|---|---|---|---|
| 实际面积/km2 | 模拟面积/km2 | 精度/% | |
| 农业用地 | 1089.51 | 1121.81 | 97.12 |
| 工矿仓储用地 | 90.26 | 110.06 | 82.01 |
| 公共设施用地 | 58.23 | 47.22 | 81.09 |
| 交通用地 | 46.72 | 26.39 | 56.48 |
| 居住用地 | 178.42 | 166.27 | 93.19 |
| 其他用地 | 98.38 | 90.50 | 91.99 |
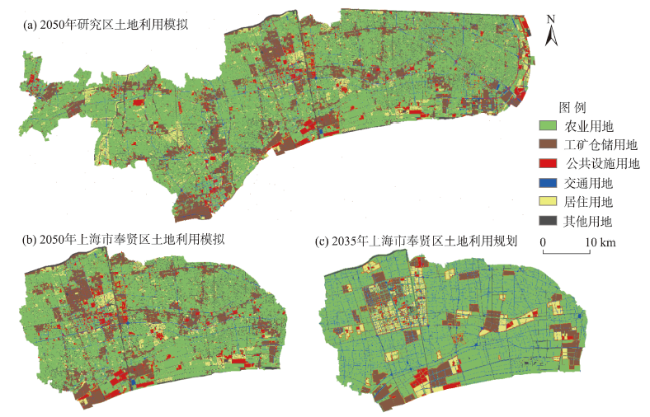
表3 2050年上海市奉贤区各类土地利用模拟面积与2035年规划面积叠合度对比Tab.3 Comparison between overlaps of simulated land use area in 2050 and planning area in 2035 in Fengxian District, Shanghai |
| 土地利用 类型 | 2050年模拟 面积/km2 | 2035年规划 面积/km2 | 叠合度/% |
|---|---|---|---|
| 农业用地 | 438.6276 | 476.6760 | 92.02 |
| 工矿仓储用地 | 105.2388 | 75.1356 | 71.40 |
| 公共设施用地 | 45.4860 | 31.6044 | 69.48 |
| 交通用地 | 22.1328 | 55.8324 | 39.64 |
| 居住用地 | 38.7576 | 44.6148 | 86.87 |
| 其他用地 | 49.6224 | 16.0452 | 32.33 |
表4 现状情景下不同重现期下土地利用暴露资产Tab.4 Exposed assets of different land use types for different return periods under the current scenario |
| 土地利用 类型 | 不同重现期下土地利用暴露资产/亿元 | |||
|---|---|---|---|---|
| 200 a | 500 a | 1000 a | 5000 a | |
| 居住用地 | 81 | 133 | 204 | 517 |
| 工业用地 | 144 | 232 | 387 | 672 |
| 交通用地 | 42 | 68 | 115 | 245 |
| 公共设施用地 | 79 | 112 | 156 | 372 |
| 农业用地 | 306 | 471 | 682 | 1751 |
| 其他用地 | 73 | 100 | 133 | 289 |
| 合计 | 725 | 1116 | 1677 | 3846 |
表5 现状情景不同重现期下土地利用资产损失Tab.5 Asset losses of different land use types for different return periods under the current scenario |
| 土地利用 类型 | 不同重现期下土地利用资产损失/亿元 | |||
|---|---|---|---|---|
| 200 a | 500 a | 1000 a | 5000 a | |
| 居住用地 | 4.7 | 9.0 | 14.3 | 38.4 |
| 工业用地 | 5.6 | 9.7 | 15.9 | 36.2 |
| 交通用地 | 0.6 | 1.1 | 1.9 | 4.9 |
| 公共设施用地 | 6.0 | 8.7 | 11.6 | 24.8 |
| 农业用地 | 37.5 | 76.8 | 121.5 | 321.1 |
| 其他用地 | 2.9 | 4.6 | 6.1 | 12.4 |
| 合计 | 57.2 | 109.9 | 171.3 | 437.9 |
表6 未来多个风暴潮淹没情景不同重现期下土地利用暴露资产Tab.6 Exposed assets of different land use types under various storm surge flood scenarios of different return periods in the future |
| 土地利用 类型 | 未来不同重现期下土地利用暴露资产/亿元 | |||||||||||||
|---|---|---|---|---|---|---|---|---|---|---|---|---|---|---|
| RCP4.5 | RCP8.5 | RCP8.5H | ||||||||||||
| 200 a | 500 a | 1000 a | 5000 a | 200 a | 500 a | 1000 a | 5000 a | 200 a | 500 a | 1000 a | 5000 a | |||
| 居住用地 | 294 | 528 | 849 | 1700 | 310 | 555 | 907 | 1739 | 347 | 603 | 1001 | 1782 | ||
| 工业用地 | 615 | 1083 | 1660 | 2321 | 654 | 1141 | 1704 | 2377 | 691 | 1274 | 1787 | 2417 | ||
| 交通用地 | 160 | 275 | 447 | 769 | 167 | 293 | 471 | 786 | 179 | 329 | 504 | 798 | ||
| 公共设施用地 | 272 | 388 | 615 | 1207 | 283 | 408 | 646 | 1237 | 302 | 456 | 698 | 1260 | ||
| 农业用地 | 1188 | 1889 | 3005 | 6434 | 1258 | 1987 | 3206 | 6673 | 1354 | 2208 | 3514 | 6925 | ||
| 其他用地 | 246 | 343 | 488 | 950 | 255 | 354 | 511 | 980 | 266 | 379 | 549 | 1013 | ||
| 合计 | 2774 | 4506 | 7065 | 13381 | 2926 | 4738 | 7445 | 13792 | 3139 | 5249 | 8053 | 14196 | ||
表7 未来多个风暴潮淹没情景不同重现期下土地利用资产损失Tab.7 Asset losses of different land use types under various storm surge flood scenarios of different return periods in the future |
| 土地利用 类型 | 不同重现期下土地利用资产损失/亿元 | |||||||||||||
|---|---|---|---|---|---|---|---|---|---|---|---|---|---|---|
| RCP4.5 | RCP8.5 | RCP8.5H | ||||||||||||
| 200 a | 500 a | 1000 a | 5000 a | 200 a | 500 a | 1000 a | 5000 a | 200 a | 500 a | 1000 a | 5000 a | |||
| 居住用地 | 18 | 36 | 58 | 142 | 19 | 37 | 61 | 150 | 22 | 41 | 67 | 160 | ||
| 工业用地 | 25 | 44 | 71 | 144 | 26 | 47 | 75 | 151 | 29 | 53 | 81 | 159 | ||
| 交通用地 | 2 | 4 | 7 | 18 | 2 | 5 | 8 | 19 | 3 | 5 | 9 | 20 | ||
| 公共设施用地 | 21 | 30 | 42 | 88 | 21 | 31 | 43 | 92 | 23 | 33 | 46 | 97 | ||
| 农业用地 | 160 | 316 | 518 | 1262 | 173 | 334 | 552 | 1334 | 195 | 373 | 606 | 1427 | ||
| 其他用地 | 10 | 15 | 20 | 41 | 10 | 15 | 21 | 43 | 11 | 16 | 23 | 46 | ||
| 合计 | 236 | 445 | 716 | 1695 | 251 | 469 | 760 | 1789 | 283 | 521 | 832 | 1909 | ||
表8 现状情景和未来情景下暴露资产与损失资产空间分布特征Tab.8 Spatial distribution characteristics of exposed assets and asset losses under the current and future scenarios |
| 资产 | 现状情景 | 未来情景 |
|---|---|---|
| 暴露资产范围 | 小 | 大 |
| 单位面积暴露资产值高值 | 浦东新区南部小范围区域 | 浦东新区大治河以南区域 |
| 资产损失的范围 | 小 | 大 |
| 单位面积资产损失高值 | 沿海岸线的小部分区域,呈零散分布, 主要是浦东新区沿海 | 沿海区域,呈带状分布, 包括金山区北部和整个浦东区南部 |
表9 现状情景和未来3个情景下资产损失评估Tab.9 Asset losses under the current scenario and three future scenarios (亿元) |
| 资产损失 | 现状情景 | RCP4.5情景 | RCP8.5情景 | RCP8.5H情景 |
|---|---|---|---|---|
| 5000 a重现期下暴露资产 | 3846 | 13381 | 13792 | 14196 |
| 5000 a重现期下损失资产 | 437.9 | 1695.0 | 1789.0 | 1909.0 |
| 年期望损失 | 0.65 | 2.62 | 2.78 | 3.04 |
| [1] |
|
| [2] |
|
| [3] |
|
| [4] |
|
| [5] |
|
| [6] |
|
| [7] |
方佳毅, 史培军. 全球气候变化背景下海岸洪水灾害风险评估研究进展与展望[J]. 地理科学进展, 2019,38(5):625-636.
[
|
| [8] |
|
| [9] |
|
| [10] |
|
| [11] |
|
| [12] |
|
| [13] |
|
| [14] |
|
| [15] |
|
| [16] |
|
| [17] |
|
| [18] |
施雅风, 朱季文, 谢志仁, 等. 长江三角洲及毗连地区海平面上升影响预测与防治对策[J]. 中国科学(地球科学), 2000,30(3):225-232.
[
|
| [19] |
|
| [20] |
|
| [21] |
王璐阳, 张敏, 温家洪, 等. 上海复合极端风暴洪水淹没模拟[J]. 水科学进展, 2019,30(4):546-555.
[
|
| [22] |
单薪蒙. 上海住宅建筑和室内财产的极端风暴洪水风险与适应措施研究[D]. 上海: 上海师范大学, 2020.
[
|
| [23] |
|
| [24] |
|
| [25] |
|
| [26] |
刘钦政, 石先武, 国志兴, 等. 风暴潮灾害风险评估和区划技术导则 [M]. 北京: 海洋出版社, 2015.
[
|
| [27] |
|
| [28] |
|
| [29] |
殷杰, 尹占娥, 于大鹏, 等. 风暴洪水主要承灾体脆弱性分析: 黄浦江案例[J]. 地理科学, 2012,32(9):1155-1160.
[
|
| [30] |
|
| [31] |
殷杰. 中国沿海台风风暴潮灾害风险评估研究[D]. 上海: 华东师范大学, 2011.
[
|
| [32] |
李伟峰, 陈求稳, 毛劲乔. 北京奥运村洪水淹没风险模型研究[J]. 科学通报, 2009,54(3):321-328.
[
|
| [33] |
|
| [34] |
|
| [35] |
蔡玉梅, 刘彦随, 宇振荣, 等. 土地利用变化空间模拟的进展: CLUE-S模型及其应用[J]. 地理科学进展, 2004,23(4):63-71, 115.
[
|
| [36] |
黄庆旭, 史培军, 何春阳, 等. 中国北方未来干旱化情景下的土地利用变化模拟[J]. 地理学报, 2006,61(12):1299-1310.
[
|
| [37] |
韩会然, 杨成凤, 宋金平. 北京市土地利用空间格局演化模拟及预测[J]. 地理科学进展, 2015,34(8):976-986.
[
|
| [38] |
吴健生, 冯喆, 高阳, 等. CLUE-S模型应用进展与改进研究[J]. 地理科学进展, 2012,31(1):3-10.
[
|
| [39] |
戴尔阜, 马良. 土地变化模型方法综述[J]. 地理科学进展, 2018,37(1):152-162.
[
|
| [40] |
涂小松, 濮励杰, 吴骏, 等. 基于SLEUTH模型的无锡市区土地利用变化情景模拟[J]. 长江流域资源与环境, 2008,17(6):860-865.
[
|
| [41] |
|
| [42] |
李志英, 刘涵妮, 田金欢, 等. 基于SLEUTH模型的滇池流域城市扩展模拟分析[J]. 长江流域资源与环境, 2014,23(10):1360-1366.
[
|
| [43] |
王丽妍. 生态空间质量约束下的城镇用地增长情景模拟: 以改进的SLEUTH模型为例[D]. 南京: 南京大学, 2016.
[
|
| [44] |
詹云军, 朱捷缘, 严岩. 基于元胞自动机的城市空间动态模拟[J]. 生态学报, 2017,37(14):4864-4872.
[
|
| [45] |
徐杰, 罗震东, 尹海伟, 等. 基于SLEUTH模型的昆山市城市扩展模拟研究[J]. 地理与地理信息科学, 2016,32(5):59-64.
[
|
| [46] |
朱飞鸽, 胡瀚文, 沈兴华, 等. 基于SLEUTH模型的上海城市增长预测[J]. 生态学杂志, 2011,30(9):2107-2114.
[
|
| [47] |
|
| [48] |
|
| [49] |
|
| [50] |
|
| [51] |
|
| [52] |
|
| [53] |
|
| [54] |
李成帅, 杨建思, 田宝峰, 等. 四川芦山7.0级地震直接经济损失快速评估[J]. 自然灾害学报, 2013,22(3):9-17.
[
|
| [55] |
国家统计局. 上海统计年鉴 [M]. 北京: 中国统计出版社, 2018.
[ National Bureau of Statistics of China. Shanghai Statistics Yearbook. Beijing, China: China Statistics Press, 2018. ]
|
| [56] |
姜彤, 赵晶, 曹丽格, 等. 共享社会经济路径下中国及分省经济变化预测[J]. 气候变化研究进展, 2018,14(1):50-58.
[
|
| [57] |
田义超, 任志远. 基于CLUE-S模型的黄土台塬区土地利用变化模拟: 以陕西省咸阳台塬区为例[J]. 地理科学进展, 2012,31(9):1224-1234.
[
|
| [58] |
|
/
| 〈 |
|
〉 |


