
不同交通方式下居民城际出行网络结构特征——以“春运”为例
|
张蓉(1995— ),女,甘肃华池人,硕士生,主要从事空间分析与感知研究。E-mail:zr420728@163.com |
收稿日期: 2020-05-23
要求修回日期: 2020-10-14
网络出版日期: 2021-07-28
基金资助
国家自然科学基金项目(42071216)
国家自然科学基金项目(41661025)
版权
Characteristics of intercity trip network structure of residents under different traffic modes: A case study of Spring Festival travel rush
Received date: 2020-05-23
Request revised date: 2020-10-14
Online published: 2021-07-28
Supported by
National Natural Science Foundation of China(42071216)
National Natural Science Foundation of China(41661025)
Copyright
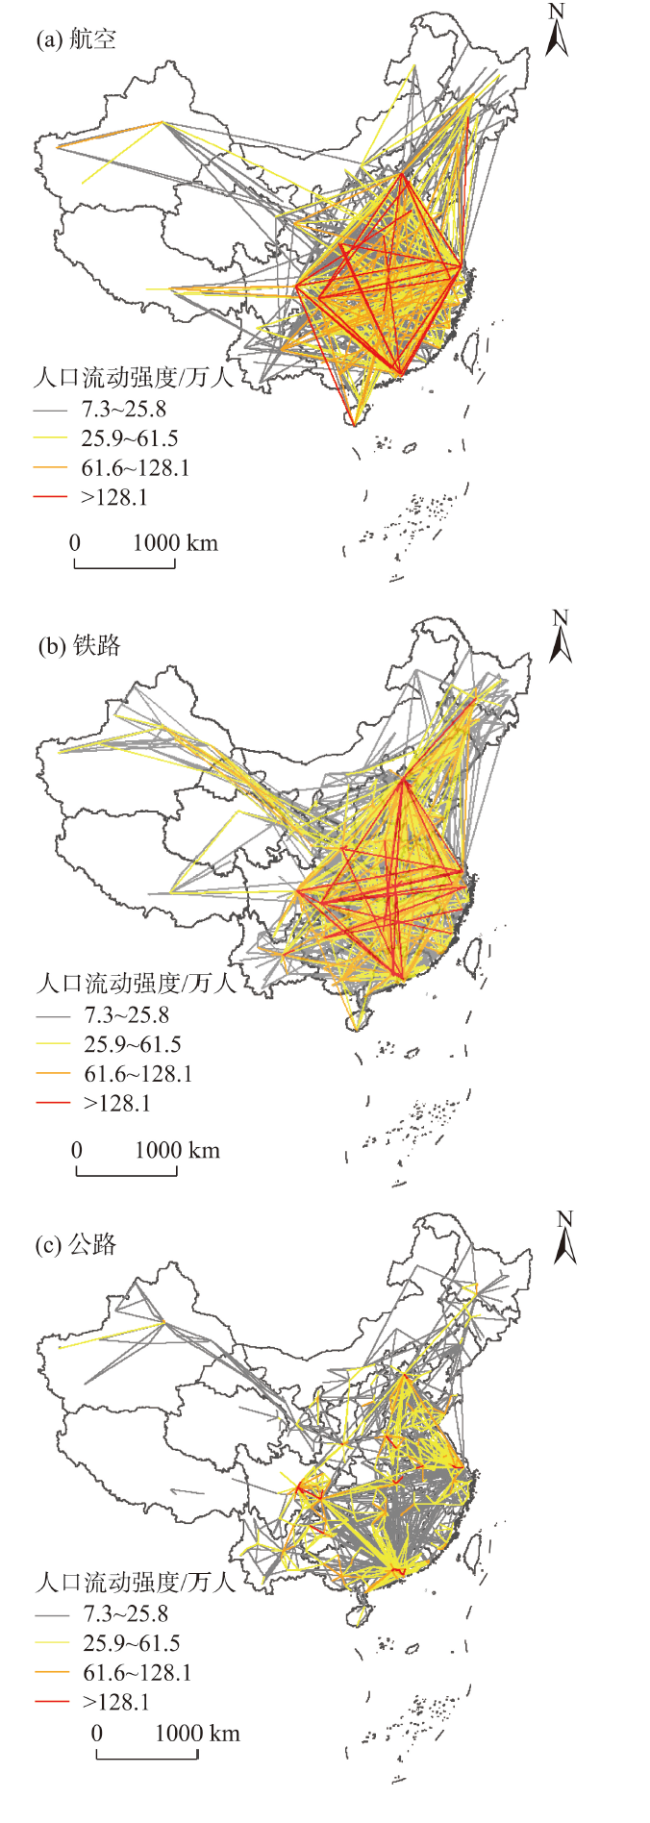
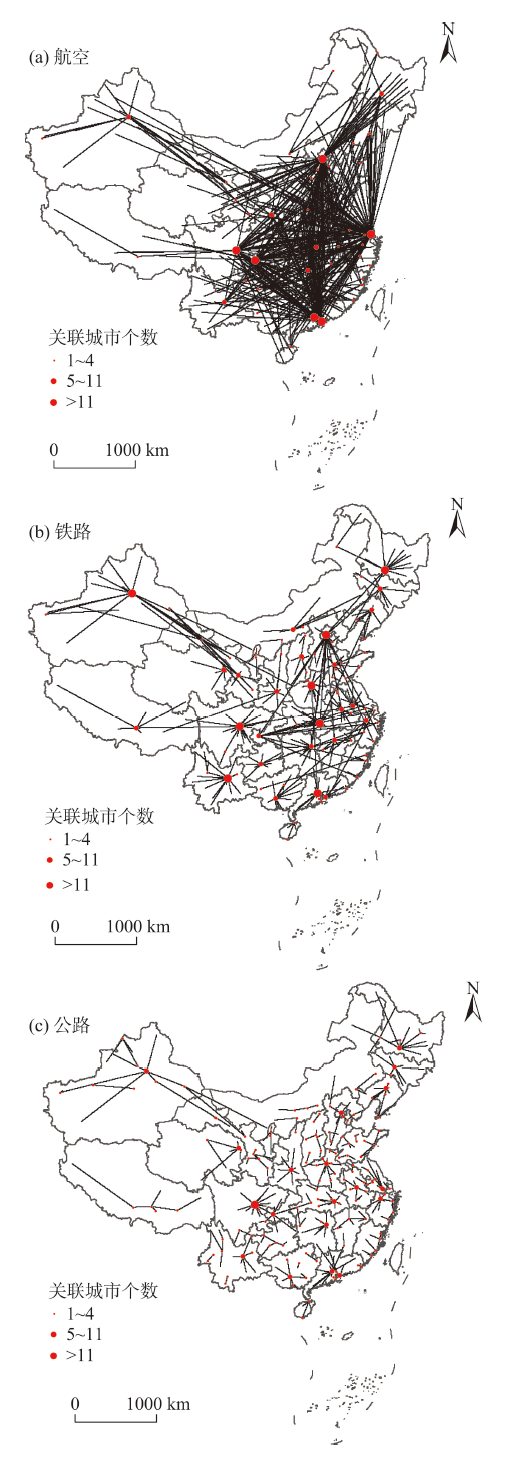
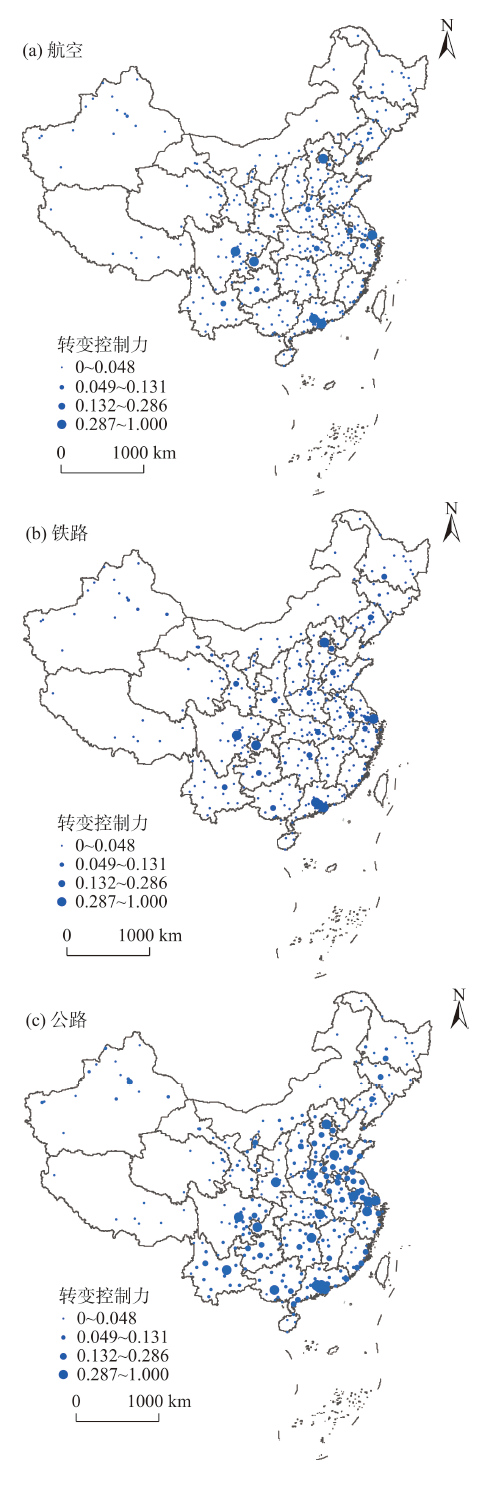
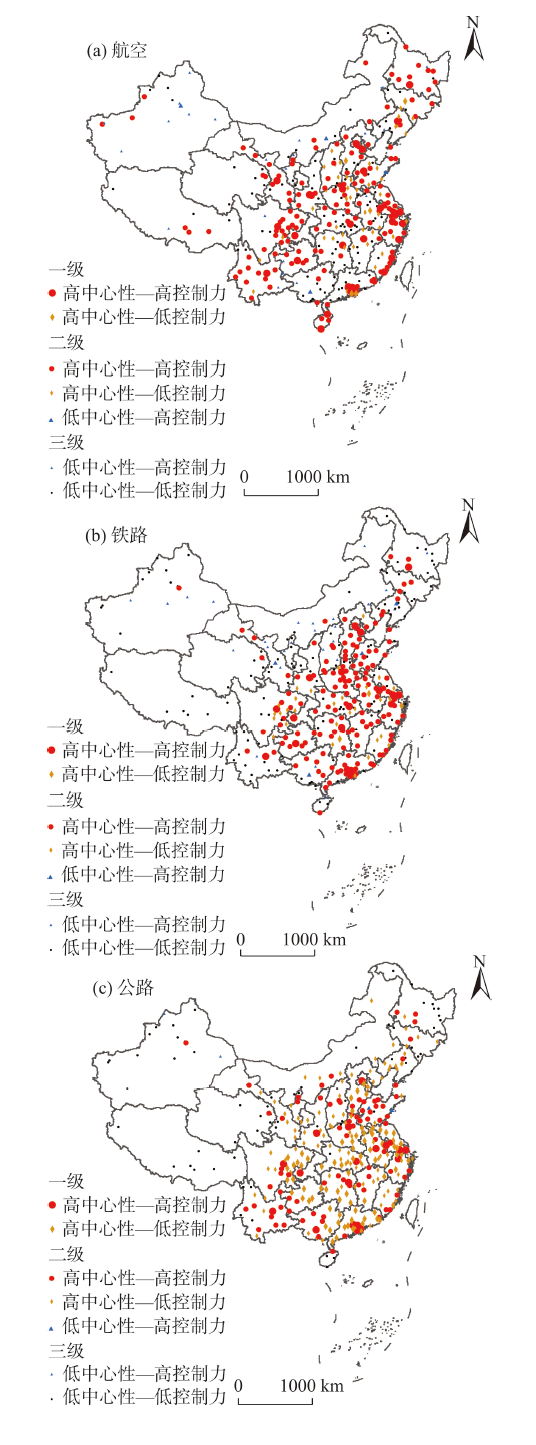
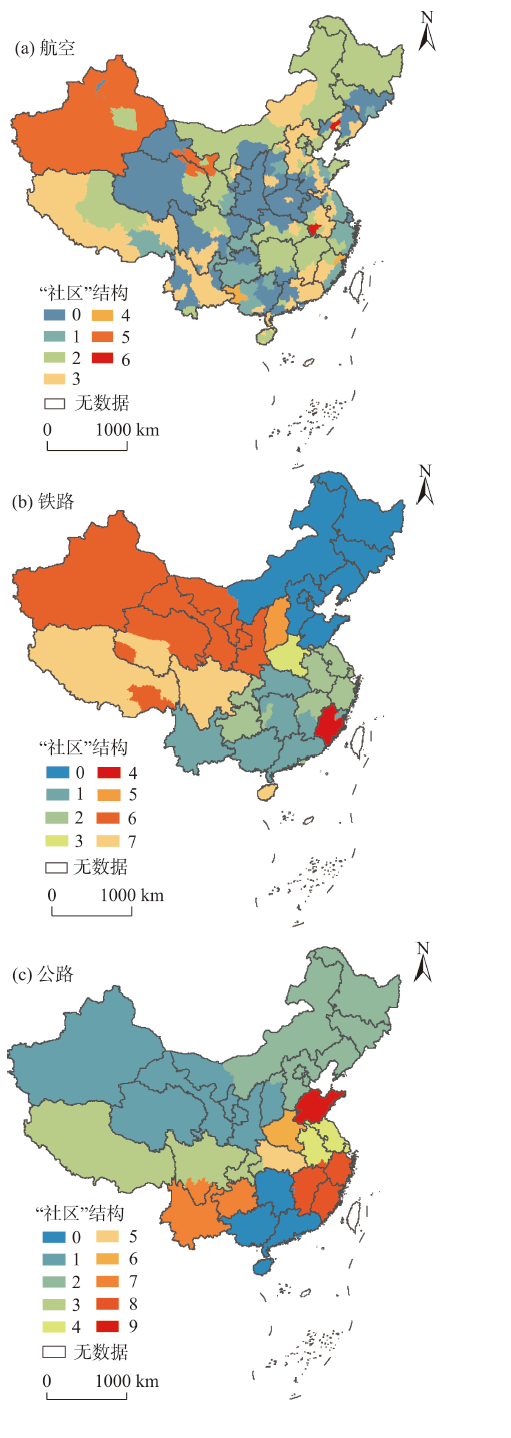
基于多元视角下的居民城际出行网络空间结构测度可以较为全面地刻画出城市间的复杂联系特征。论文利用春运期间腾讯迁徙平台中的人口流动数据,采用复杂网络分析方法以及转变中心性和转变控制力等指标,对比分析了航空、铁路和公路3种交通方式下的中国居民城际出行网络结构特征。结果表明:3种出行方式下,航空联系的线路最少,平均出行距离最长;铁路出行人数最多,其次是公路,航空最少。最大优势流中,北京和上海在国内航空出行联系中起着最重要的控制作用,其次是成都和重庆;铁路出行中,北京和成都占据绝对优势;公路多表现为省级行政中心与周边城市的关联。根据转变中心性和转变控制力划分城市类型,在航空和铁路出行网络中,高中心性—高控制力城市较多;公路出行网络中以高中心性—低控制力城市为主。不同出行方式下的城市聚类得到的网络集群“社区”数量有一定差异,航空、铁路和公路出行依次聚类为7、8和10个“社区”。不同类型出行方式透视的城市网络特征存在较明显的差异:航空出行的城际人口流体现出以全国性枢纽城市为核心分布的核心—边缘结构;铁路表现出以国家铁路大动脉沿线城市为核心,向腹地城市逐渐递减的核心—边缘结构;公路出行的城际人口流则表现为与人口规模匹配的局域强聚集的空间格局。
张蓉 , 潘竟虎 , 赖建波 . 不同交通方式下居民城际出行网络结构特征——以“春运”为例[J]. 地理科学进展, 2021 , 40(5) : 759 -773 . DOI: 10.18306/dlkxjz.2021.05.004
Spatial structure measurement of residents' intercity trip network based on multiple perspectives can be used to comprehensively describe the complex connection between cities. Based on the data of population flow from Tencent migration platform in 2018 during the Spring Festival in China and using the complex network analysis method and taking alter-based centrality and alter-based power as indicators, the structural characteristics of Chinese intercity trip network under the three traffic modes of aviation, railway, and highway were compared and analyzed. The results show that: 1) The number of routes connected by aviation is the smallest among the three modes of travel, and the average trip distance is the longest; the number of passengers by railway is the largest, followed by highway and aviation. 2) With regard to the maximum dominant flow, Beijing and Shanghai play the most important controlling role in the domestic aviation trip connection, followed by Chengdu and Chongqing. With regard to the railway trips, Beijing and Chengdu occupy absolute advantageous positions, and the highways mostly connect provincial administrative centers and the surrounding cities. 3) There are four types of cities based on the alter-based centrality and alter-based power: high alter-based centrality-high alter-based power cities, high alter-based centrality-low alter-based power cities, low alter-based centrality-high alter-based power cities, and low alter-based centrality-low alter-based power cities. The number of high alter-based centrality-high alter-based power cities is the largest in the aviation and railway travel network. The number of high alter-based centrality-low alter-based power cities is dominant in the highway travel network. 4) There are differences in the number of urban community detection clustering structures under different travel modes. Aviation, railway, and highway were clustered into 7, 8 and 10 urban communities respectively. Under the aviation travel mode, discontinuity between "communities" is clear. Under the mode of railway travel, agglomeration appears, and an obvious block distribution appears under the mode of highway travel. From the perspective of travel modes, the characteristics of urban network are also significantly different. The intercity flow of aviation travel showed a core-periphery structure with national hub cities as the core; train travel showed a core-periphery structure with the cities along the national railway artery as the core, and gradually decreasing to the hinterland cities; and the intercity flow of highway travel indicates the spatial pattern of local strong aggregation matching the population scale. The study of spatial structure of residents' intercity trip network under different travel modes can reveal the multiple spatial characteristics of population migration, residents' trip, and urban network from different perspectives, complement the results of existing studies based on single travel modes, and enrich the regional understanding of spatial relationships of Chinese cities.
表1 不同出行方式下的网络规模统计Tab.1 Statistics of network scale under different travel modes |
| 出行方式 | 线路/条 | 联系总值/人 | 线路客流平均值/人 | 线路最大客流/人 | 线路最小客流/人 | 平均出行距离/km |
|---|---|---|---|---|---|---|
| 航空 | 8451 | 395906143 | 46852.80 | 5619745 | 2 | 1232.73 |
| 铁路 | 13746 | 1151459633 | 83772.98 | 3989590 | 1 | 842.99 |
| 公路 | 10222 | 802326637 | 78497.86 | 3774504 | 11 | 580.26 |
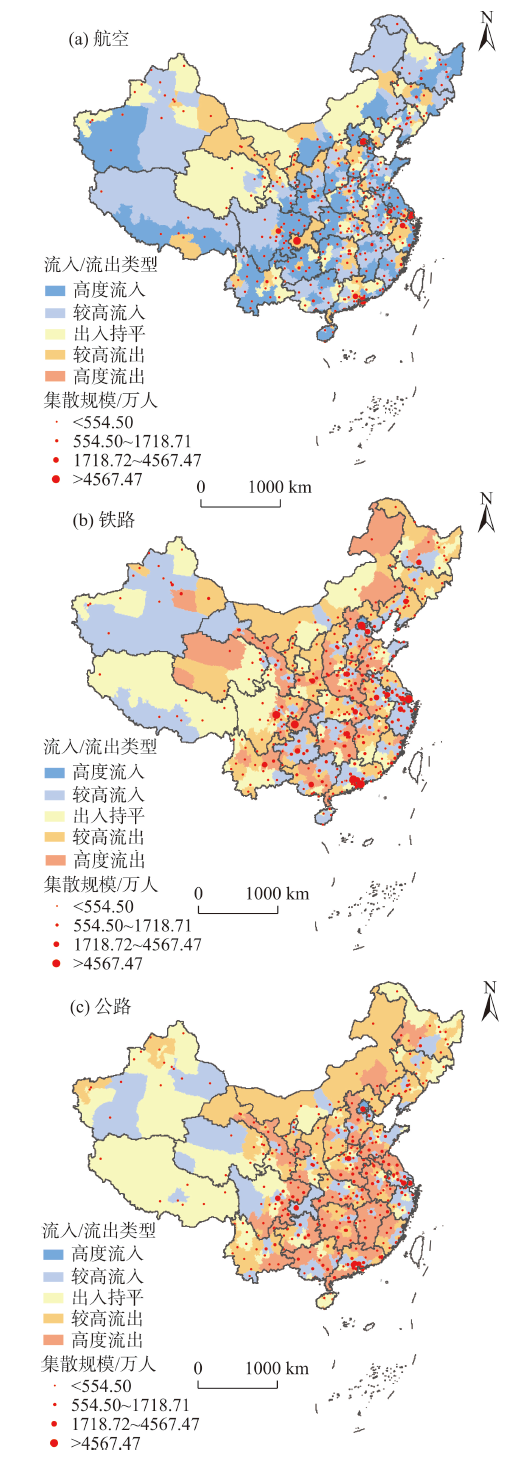
表2 不同出行方式下的人口流动集散层级排名前10位的城市和流动线路Tab.2 Top 10 cities and flow routes by the level of population flow distribution under different travel modes |
| 方式 | 集散规模前10名城市(人数/万人) | 集散人数占比 | 出行前10位路线(承载人数/万人) | 承载人口占比 |
|---|---|---|---|---|
| 航空 | 上海(7189.50)、重庆(6774.25)、北京(5769.37)、深圳(4682.73)、成都(4456.12)、广州(3540.94)、杭州(1969.88)、南京(1875.26)、西安(1566.18)、贵阳(1541.59) | 总计39365.82万人,占航空集散总人数的49.72% | 上海至重庆(561.97)、重庆至上海(561.79)、重庆至北京(531.66)、北京至重庆(495.89)、深圳至成都(391.39)、成都至深圳(353.64)、上海至北京(335.05)、北京至上海(330.75)、深圳至上海(326.07)、广州至上海(286.53) | 总计4174.76万人,占航空承载总量的10.54% |
| 铁路 | 北京(13411.76)广州(8839.29)、上海(8239.52)、重庆(7946.69)、深圳(7470.20)、成都(6847.17)、武汉(4567.47)、西安(4170.78)、郑州(3553.10)、南京(3377.23) | 总计68423.22万人,占铁路集散总人数的29.71% | 上海至重庆(398.96)、重庆至上海(384.79)、佛山至广州(309.32)、广州至佛山(307.67)、重庆至北京(296.40)、长沙至北京(296.39)、北京至重庆(260.11)、武汉至北京(246.53)、北京至上海(244.27)、成都至南京(238.58) | 总计2983.01万人,占铁路承载总量的2.60% |
| 公路 | 广州(4524.70)、深圳(4298.90)、重庆(3947.29)、北京(3685.43)、成都(3496.08)、东莞(3490.96)、上海(3489.91)、苏州(2917.86)、佛山(2101.89)、郑州(1858.93) | 总计33811.94万人,占公路集散总人数的21.07% | 深圳至东莞(377.45)、东莞至深圳(374.35)、上海至苏州(270.93)、苏州至上海(263.99)、佛山至广州(256.25)、广州至佛山(250.17)、咸阳至西安(203.18)、北京至廊坊(202.05)、西安至咸阳(201.19)、深圳至惠州(188.14) | 总计2587.72万人,占公路承载总量的3.23% |
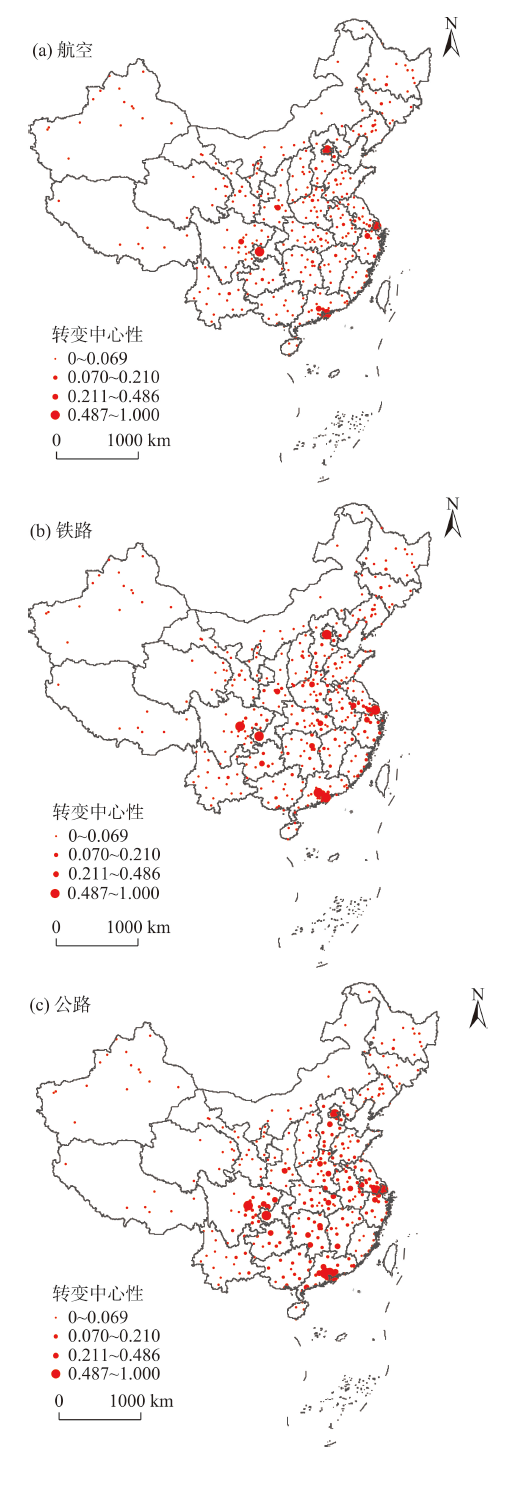
表3 不同出行方式下转变中心性(AC)、转变控制力(AP)前10名和后10名城市Tab.3 Top 10 and bottom 10 cities of alter-based centrality (AC) and alter-based power (AP) under different travel modes |
| 位序 | 航空 | 铁路 | 公路 | ||||||||
|---|---|---|---|---|---|---|---|---|---|---|---|
| 城市 | AC | AP | 城市 | AC | AP | 城市 | AC | AP | |||
| 1 | 重庆 | 1.000 | 0.808 | 北京 | 1.000 | 1.000 | 深圳 | 1.000 | 0.932 | ||
| 2 | 上海 | 0.938 | 1.000 | 重庆 | 0.941 | 0.481 | 广州 | 0.977 | 0.951 | ||
| 3 | 北京 | 0.656 | 0.778 | 上海 | 0.801 | 0.559 | 东莞 | 0.960 | 0.644 | ||
| 4 | 深圳 | 0.630 | 0.716 | 广州 | 0.720 | 0.643 | 重庆 | 0.812 | 0.891 | ||
| 5 | 广州 | 0.464 | 0.545 | 深圳 | 0.645 | 0.564 | 上海 | 0.774 | 0.733 | ||
| 6 | 成都 | 0.443 | 0.741 | 成都 | 0.633 | 0.564 | 苏州 | 0.717 | 0.680 | ||
| 7 | 杭州 | 0.270 | 0.261 | 武汉 | 0.486 | 0.286 | 北京 | 0.697 | 0.856 | ||
| 8 | 西安 | 0.241 | 0.118 | 西安 | 0.441 | 0.273 | 成都 | 0.597 | 1.000 | ||
| 9 | 南京 | 0.203 | 0.163 | 郑州 | 0.329 | 0.261 | 佛山 | 0.566 | 0.390 | ||
| 10 | 咸阳 | 0.185 | 0.085 | 杭州 | 0.324 | 0.209 | 惠州 | 0.419 | 0.155 | ||
| … | … | … | … | … | … | … | … | … | … | ||
| 337 | 淮北 | <0.001 | <0.001 | 大兴安岭 | 0.001 | 0.002 | 果洛 | 0.002 | 0.006 | ||
| 338 | 郴州 | <0.001 | <0.001 | 克州 | 0.001 | 0.004 | 山南 | 0.002 | 0.004 | ||
| 339 | 玉树州 | <0.001 | <0.001 | 怒江 | 0.001 | 0.001 | 玉树州 | 0.002 | 0.005 | ||
| 340 | 云浮 | <0.001 | <0.001 | 和田 | 0.001 | 0.002 | 阿勒泰 | 0.002 | 0.011 | ||
| 341 | 韶关 | <0.001 | <0.001 | 黄南州 | 0.001 | 0.001 | 琼海 | 0.002 | 0.017 | ||
| 342 | 贺州 | <0.001 | <0.001 | 神农架 | 0.001 | 0.001 | 克州 | 0.002 | 0.013 | ||
| 343 | 亳州 | <0.001 | <0.001 | 昌都 | 0.001 | <0.001 | 大兴安岭 | 0.001 | 0.002 | ||
| 344 | 神农架 | <0.001 | <0.001 | 阿勒泰 | <0.001 | 0.001 | 那曲 | 0.001 | 0.003 | ||
| 345 | 果洛 | <0.001 | <0.001 | 果洛 | <0.001 | 0.001 | 日喀则 | 0.001 | 0.005 | ||
| 346 | 梧州 | <0.001 | <0.001 | 阿里 | <0.001 | <0.001 | 阿里 | <0.001 | 0.002 | ||
表4 不同出行方式下的城市“社区发现”统计Tab.4 Statistical table of urban community detection under different travel modes |
| 航空 | 铁路 | 公路 | |||||
|---|---|---|---|---|---|---|---|
| “社区” | 数量/个 | “社区” | 数量/个 | “社区” | 数量/个 | ||
| 0 | 113 | 0 | 77 | 0 | 56 | ||
| 1 | 44 | 1 | 84 | 1 | 62 | ||
| 2 | 98 | 2 | 63 | 2 | 62 | ||
| 3 | 72 | 3 | 18 | 3 | 28 | ||
| 4 | 2 | 4 | 8 | 4 | 29 | ||
| 5 | 15 | 5 | 11 | 5 | 16 | ||
| 6 | 2 | 6 | 53 | 6 | 18 | ||
| 7 | 32 | 7 | 27 | ||||
| 8 | 31 | ||||||
| 9 | 17 | ||||||
| [1] |
|
| [2] |
陈伟. 多元客流视角下的中国城市网络格局[D]. 长春: 东北师范大学, 2015.
[
|
| [3] |
钟业喜, 冯兴华, 文玉钊. 长江经济带经济网络结构演变及其驱动机制研究[J]. 地理科学, 2016,36(1):10-19.
[
|
| [4] |
|
| [5] |
郭倩倩, 张志斌, 师晶, 等. 中国西北地区城市网络结构的时空演变: 基于铁路客运流视角的分析[J]. 城市问题, 2019(9):19-27.
[
|
| [6] |
|
| [7] |
|
| [8] |
|
| [9] |
|
| [10] |
|
| [11] |
薛俊菲. 基于航空网络的中国城市体系等级结构与分布格局[J]. 地理研究, 2008,27(1):23-32, 242.
[
|
| [12] |
宋伟, 李秀伟, 修春亮. 基于航空客流的中国城市层级结构分析[J]. 地理研究, 2008,27(4):917-926.
[
|
| [13] |
钟业喜, 陆玉麒. 基于铁路网络的中国城市等级体系与分布格局[J]. 地理研究, 2011,30(5):785-794.
[
|
| [14] |
马学广, 鹿宇. 基于航空客运流的中国城市空间格局与空间联系[J]. 经济地理, 2018,38(8):47-57.
[
|
| [15] |
孟德友, 冯兴华, 文玉钊. 铁路客运视角下东北地区城市网络结构演变及组织模式探讨[J]. 地理研究, 2017,36(7):1339-1352.
[
|
| [16] |
王姣娥, 景悦. 中国城市网络等级结构特征及组织模式: 基于铁路和航空流的比较[J]. 地理学报, 2017,72(8):1508-1519.
[
|
| [17] |
赵梓渝, 魏冶, 庞瑞秋, 等. 中国春运人口省际流动的时空与结构特征[J]. 地理科学进展, 2017,36(8):952-964.
[
|
| [18] |
|
| [19] |
魏冶, 修春亮, 刘志敏, 等. 春运人口流动透视的转型期中国城市网络结构[J]. 地理科学, 2016,36(11):1654-1660.
[
|
| [20] |
尹宏玲, 吴志强, 杨婷. 扎克瑞·尼尔世界城市网络测度方法评述及其启示[J]. 国际城市规划, 2014,29(6):110-113.
[
|
| [21] |
|
| [22] |
赵梓渝, 魏冶, 庞瑞秋, 等. 基于人口省际流动的中国城市网络转变中心性与控制力研究: 兼论递归理论用于城市网络研究的条件性[J]. 地理学报, 2017,72(6):1032-1048.
[
|
| [23] |
赵梓渝, 魏冶, 王士君, 等. 有向加权城市网络的转变中心性与控制力测度: 以中国春运人口流动网络为例[J]. 地理研究, 2017,36(4):647-660.
[
|
| [24] |
|
| [25] |
赖建波, 潘竟虎. 基于腾讯迁徙数据的中国“春运”城市间人口流动空间格局[J]. 人文地理, 2019,34(3):108-117.
[
|
| [26] |
陈伟, 修春亮, 柯文前, 等. 多元交通流视角下的中国城市网络层级特征[J]. 地理研究, 2015,34(11):2073-2083.
[
|
| [27] |
赵梓渝, 王士君. 2015年我国春运人口省际流动的时空格局[J]. 人口研究, 2017,41(3):101-112.
[
|
| [28] |
|
| [29] |
周强. 复杂网络社区发现算法研究[D]. 成都: 电子科技大学, 2020.
[
|
| [30] |
|
| [31] |
|
| [32] |
|
/
| 〈 |
|
〉 |