
基于EOF分解的辽宁省城市化气候效应检测
|
敖雪(1986— ),女,重庆人,硕士,工程师,主要从事气候变化研究。E-mail: aoxuefyh@163.com |
收稿日期: 2019-09-20
要求修回日期: 2019-12-12
网络出版日期: 2020-11-28
基金资助
2018年辽宁省气象局科研课题(BA201803)
2018年辽宁省气象局科研课题(201818)
辽宁省科学技术计划项目(2019-MZ-199)
辽宁省科学技术计划项目(2019-ZD-0859)
版权
Detection of urbanization effect on the climate change in Liaoning Province based on empirical orthogonal function methods
Received date: 2019-09-20
Request revised date: 2019-12-12
Online published: 2020-11-28
Supported by
Scientific Research Project of Liaoning Meteorological Bureau in 2018(BA201803)
Scientific Research Project of Liaoning Meteorological Bureau in 2018(201818)
Science and technology Plan Project in Liaoning Province(2019-MZ-199)
Science and technology Plan Project in Liaoning Province(2019-ZD-0859)
Copyright
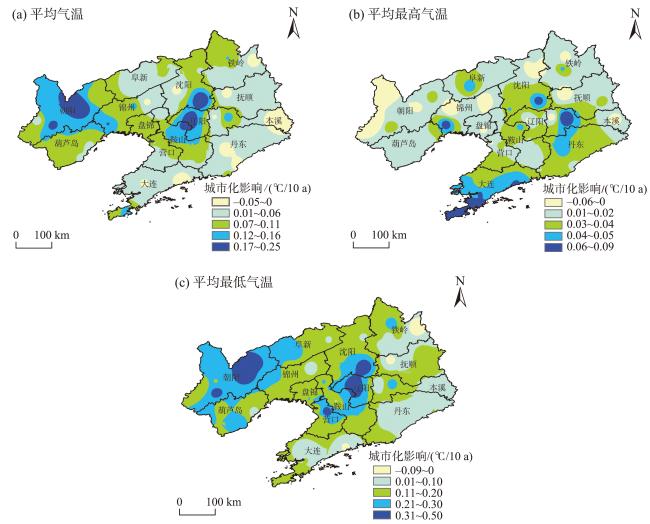
论文利用1961—2017年逐日气象数据以及社会经济数据,构建新的城市化指标,分析了城市化对辽宁气候变化的影响。研究表明:辽宁省气温呈显著增加趋势,国家站增温速率明显快于乡村站;城市化对平均最低气温影响最显著,平均气温次之,平均最高气温相对较弱;就四季而言,秋季城市化影响贡献率最大,冬季和夏季次之,春季相对较小。空间分布上,城市化影响高值区位于辽宁中部和西部地区,与辽宁省城市化发展水平基本吻合,城市化对气温的影响不是单一的,对于多数地区尤其是沈阳、大连等经济发展水平较高的地区,起到增温作用,但也对少数台站的升温起到了抑制作用。气温指标中,城市化对年和四季平均气温的影响最显著,对应模态均是第一模态,方差贡献率均在89%以上,空间相关性均通过显著性检验,其次是平均最低气温和日较差;季节变化特征上,冬季和春季的增温相对于秋季和夏季明显。降水指标基本对应第二模态,方差贡献率在9%~18%之间,城市化对气温的影响强于降水;结合时间系数,城市化效应表现为春季和冬季降水、大雨和暴雨日数略有增加,年、夏季、秋季降水、小雨、中雨日数减少。城市化对降水的影响表现出两面性,一方面使年降水和小量级降水减少,另一方面又使极端降水事件增多。
敖雪 , 翟晴飞 , 崔妍 , 周晓宇 , 沈历都 , 赵春雨 , 宁喜龙 . 基于EOF分解的辽宁省城市化气候效应检测[J]. 地理科学进展, 2020 , 39(9) : 1532 -1543 . DOI: 10.18306/dlkxjz.2020.09.010
Based on the daily climate data and socioeconomic data from 1961 to 2017, a new urbanization index was established and the influence of urbanization on climate change of Liaoning Province was analyzed. The results show that the temperature in Liaoning Province exhibits a significant warming trend, and the rate of warming at the national stations is obviously faster than at the rural stations. The influence of urbanization from large to small are in the following order: The average minimum temperature > the average temperature > the average maximum temperature. The contributions of urbanization in the four seasons are as follows: Autumn > winter > summer > spring. In terms of spatial distribution, the high-value areas affected by urbanization are located in the central and western regions of Liaoning Province, which are basically in line with the urbanization development level of the province. Urbanization does not have a spatially consistent influence on temperature—it plays a warming role in most areas, especially in areas with high economic development level such as Shenyang and Dalian, but it also has a restraining effect on the warming of a few stations. Among the temperature indices, urbanization has the most significant influence on the annual and four-season average temperature, with corresponding first mode, and contribution rate over 89%. The spatial correlation of the annual and four-season average temperature has passed the significance test. In addition, urbanization has influence on the mean minimum air temperature and the daily range. In terms of seasonal variation characteristics, the temperature increase in winter and spring is more obvious than that in autumn and summer. The precipitation index basically corresponds to the second mode, and the contribution rate is between 9% and 18%. The influence of urbanization on temperature is stronger than that on precipitation. Combined with the time coefficient, the urbanization effect shows that the precipitation in the spring and winter and the number of days of heavy rain and rainstorm increased slightly, but the number of days of light rain and moderate rain and the precipitation in the summer and autumn decreased. Urbanization has a two-sided influence on precipitation. On the one hand, urbanization reduces annual precipitation and precipitation of small magnitude; on the other hand, it increases extreme precipitation events.
Key words: urbanization; EOF; climate change; Liaoning Province
表1 1961—2017年辽宁省国家站和乡村站平均增温率及城市化影响贡献率Tab.1 Average rate of increase of temperature of the four seasons between the national stations and the rural stations and the contribution of urbanization effect on the trends of temperature in Liaoning Province, 1961-2017 |
| 温度要素 | 增温率与城市化影响 | 春季 | 夏季 | 秋季 | 冬季 |
|---|---|---|---|---|---|
| 平均气温增温率 | 国家站增温率/(℃/10 a) | 0.322* | 0.189* | 0.196* | 0.397* |
| 乡村站增温率/(℃/10 a) | 0.267* | 0.146* | 0.124* | 0.261* | |
| 城市化影响/(℃/10 a) | 0.055* | 0.043* | 0.072* | 0.136* | |
| 城市化影响贡献率/% | 17.1 | 22.8 | 36.7 | 34.3 | |
| 平均最高气温增温率 | 国家站增温率/(℃/10 a) | 0.284* | 0.204* | 0.163* | 0.274* |
| 乡村站增温率/(℃/10 a) | 0.275* | 0.192* | 0.148* | 0.264* | |
| 城市化影响/(℃/10 a) | 0.009 | 0.012* | 0.015* | 0.01 | |
| 城市化影响贡献率/% | — | 5.9 | 9.2 | — | |
| 平均最低气温增温率 | 国家站增温率/(℃/10 a) | 0.472* | 0.266* | 0.369* | 0.541* |
| 乡村站增温率/(℃/10 a) | 0.268* | 0.141* | 0.182* | 0.294* | |
| 城市化影响/(℃/10 a) | 0.204* | 0.125* | 0.187* | 0.247* | |
| 城市化影响贡献率/% | 43.2 | 47.0 | 50.7 | 45.7 |
注:*表示通过0.05显著性水平检验;“—”表示城市化影响未通过0.05显著性检验,则不计算城市化影响贡献率。下同。 |
表2 1961—2017年辽宁省城市化影响及城市化影响贡献率Tab.2 Effects of urbanization on the trends of temperature and contribution rate of urbanization effect on the trends of temperature for Liaoning Province, 1961-2017 |
| 温度要素 | 国家站趋势/(℃/10 a) | 乡村站趋势/(℃/10 a) | 城市化影响/(℃/10 a) | 城市化影响贡献率/% |
|---|---|---|---|---|
| 平均气温 | 0.281* | 0.194* | 0.087* | 31.0 |
| 平均最高气温 | 0.238* | 0.225* | 0.013 | — |
| 平均最低气温 | 0.459* | 0.236* | 0.223* | 48.6 |
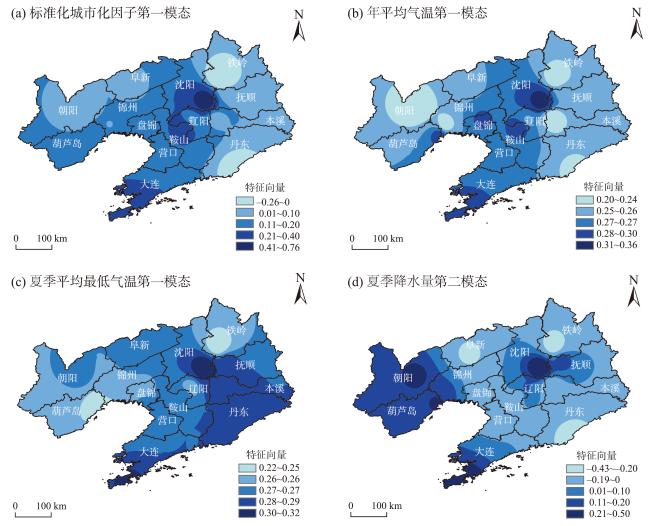
图3 1985—2017年辽宁省标准化城市化因子第一模态特征向量空间分布(a)、年平均气温第一模态特征向量空间分布(b)、夏季平均最低气温第一模态特征向量空间分布(c)和夏季降水量第二模态特征向量空间分布(d)Fig.3 The first empirical orthogonal function (EOF) mode of standardized urbanization index (a), the first EOF mode of average temperature (b), the first EOF mode of summer average minimum temperature (c) and the second EOF mode of summer precipitation (d) in Liaoning Province, 1985-2017 |
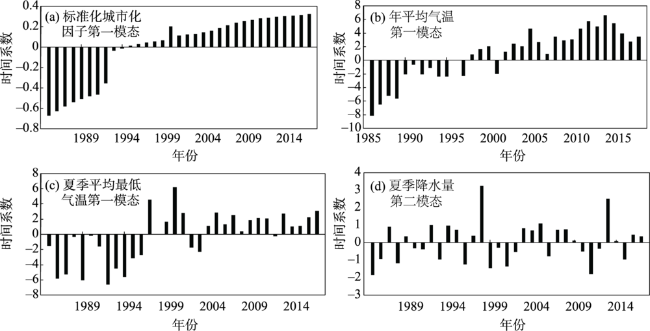
图4 1985—2017年辽宁省标准化城市化因子第一模态特征向量时间系数(a)、年平均气温第一模态特征向量时间系数(b)、夏季平均最低气温第一模态特征向量时间系数(c)和夏季降水量第二模态特征向量时间系数(d)Fig.4 The time factor of the first empirical orthogonal function (EOF) mode of standardized urbanization index (a), the time factor of the first EOF mode of average temperature (b), the time factor of the first EOF mode of summer average minimum temperature (c) and the time factor of the second EOF mode of summer precipitation (d) in Liaoning Province, 1985-2017 |
表3 辽宁省气候指标对应的EOF模态与标准化城市化因子的空间相关性Tab.3 Gray threshold of night light in different years in cities of Liaoning Province |
| 气候指标 | 对应 模态 | 方差 贡献率/% | 空间相关 系数 |
|---|---|---|---|
| 年平均气温 | 1 | 89.6 | 0.79** |
| 春季平均气温 | 1 | 93.4 | 0.36* |
| 夏季平均气温 | 1 | 89.2 | 0.65** |
| 秋季平均气温 | 1 | 90.8 | 0.45* |
| 冬季平均气温 | 1 | 92.9 | 0.71** |
| 年平均最高气温 | 5 | 0.82 | 0.42* |
| 春季平均最高气温 | 无 | 无 | 无 |
| 夏季平均最高气温 | 1 | 88.7 | 0.35* |
| 秋季平均最高气温 | 3 | 1.71 | 0.36* |
| 冬季平均最高气温 | 5 | 0.36 | 0.49* |
| 年平均最低气温 | 1 | 88.2 | 0.47* |
| 春季平均最低气温 | 3 | 1.14 | 0.33* |
| 夏季平均最低气温 | 1 | 81.2 | 0.54** |
| 秋季平均最低气温 | 3 | 1.71 | 0.37* |
| 冬季平均最低气温 | 1 | 87.9 | 0.48* |
| 气温日较差 | 1 | 86.4 | 0.44* |
| 年降水量 | 3 | 7.42 | 0.46* |
| 春季降水量 | 无 | 无 | 无 |
| 夏季降水量 | 2 | 9.08 | 0.59** |
| 秋季降水量 | 2 | 10.7 | 0.44* |
| 冬季降水量 | 2 | 11.5 | 0.38* |
| 小雨日数 | 2 | 16.4 | 0.41* |
| 中雨日数 | 2 | 17.3 | 0.43* |
| 大雨日数 | 2 | 19.6 | 0.47* |
| 暴雨日数 | 2 | 14.1 | 0.49* |
注:*、**分别表示通过0.05、0.001显著性水平检验。 |
| [1] |
|
| [2] |
|
| [3] |
|
| [4] |
|
| [5] |
|
| [6] |
|
| [7] |
|
| [8] |
|
| [9] |
|
| [10] |
初子莹, 任国玉. 北京地区城市热岛强度变化对区域温度序列的影响[J]. 气象学报, 2005,63(4):534-540.
[
|
| [11] |
|
| [12] |
周雅清, 任国玉. 城市化对华北地区最高、最低气温和日较差变化趋势的影响[J]. 高原气象, 2009,28(5):1158-1166.
[
|
| [13] |
张爱英, 任国玉, 周江兴, 等. 中国地面气温变化趋势中的城市化影响偏差[J]. 气象学报, 2010,68(6):957-966.
[
|
| [14] |
|
| [15] |
任国玉, 张雷, 卞韬, 等. 城市化对石家庄站日气温变化的影响[J]. 地球物理学报, 2015,58(2):398-410.
[
|
| [16] |
金凯, 王飞, 夏磊, 等. 华北地区均一化地面气温序列中的城市化影响检测[J]. 地球环境学报, 2015,6(3):180-187.
[
|
| [17] |
|
| [18] |
|
| [19] |
吴继华, 马慧强, 韩增林. 辽宁沿海经济带城市化对气候影响的实证分析[J]. 资源开发与市场, 2012,28(10):897-899.
[
|
| [20] |
沈志超. 东北冬季极端气温趋势变化及其城市化影响[J]. 安徽农业科学, 2013,41(31):12387-12391.
[
|
| [21] |
司鹏, 李庆祥, 李伟. 城市化进程对中国东北部气温增暖的贡献检测[J]. 气象, 2010,36(2):13-21.
[
|
| [22] |
任国玉, 张爱英, 初子莹, 等. 我国地面气温参考站点遴选的依据、原则和方法[J]. 气象科技, 2010,38(1):78-85.
[
|
| [23] |
|
| [24] |
|
| [25] |
聂安祺, 陈星, 冯志刚. 中国三大城市带城市化气候效应的检测与对比[J]. 气象科学, 2011,31(4):372-383.
[
|
| [26] |
吉莉, 李强, 张爽, 等. 城市化进程对重庆北碚城郊气温变化的影响[J]. 气象科技, 2015,43(2):320-325.
[
|
| [27] |
|
| [28] |
曹巍, 邵全琴, 刘纪远, 等. 北京地区土地利用/覆盖及其变化对气温升高的影响分析[J]. 气候与环境研究, 2013,18(4):451-460.
[
|
| [29] |
张雷, 任国玉, 任玉玉. 单次极端高温过程中城市热岛效应的识别[J]. 气候与环境研究, 2015,20(2):167-176.
[
|
| [30] |
李娇, 任国玉, 任玉玉, 等. 资料均一化对沈阳站气温趋势和城市化偏差分析的影响[J]. 大气科学学报, 2014,37(3):297-303.
[
|
| [31] |
温康民, 任国玉, 李娇, 等. 国家基本/基准站地面气温资料城市化偏差订正[J]. 地理科学进展, 2019,38(4):600-611.
[
|
| [32] |
郑有飞, 傅颖, 尹继福, 等. 大气环流背景下城市化对长江中下游夏季温度的影响研究[J]. 热带气象学报, 2014,30(2):293-301.
[
|
| [33] |
高静, 龚健, 李靖业. “源—汇”景观格局的热岛效应研究: 以武汉市为例[J]. 地理科学进展, 2019,38(11):1770-1782.
[
|
| [34] |
吴息, 王晓云, 曾宪宁, 等. 城市化效应对北京市短历时降水特征的影响[J]. 南京气象学院学报, 2000,23(1):68-72.
[
|
| [35] |
|
| [36] |
|
| [37] |
王萃萃, 翟盘茂. 中国大城市极端强降水事件变化的初步分析[J]. 气候与环境研究, 2009,14(5):553-560.
[
|
| [38] |
廖镜彪, 王雪梅, 李玉欣, 等. 城市化对广州降水的影响分析[J]. 气象科学, 2011,31(4):384-390.
[
|
| [39] |
赵酉龙, 周顺武, 郑丹, 等. 城市化对南京气候影响的数值模拟研究[J]. 气象与环境科学, 2019,42(2):1-9.
[
|
/
| 〈 |
|
〉 |