
中国与OECD在非援助国别分配的空间关系研究
|
邵静(1990— ),女,山东临沂人,博士生,主要从事经济地理研究。E-mail:shaojing9027@163.com |
收稿日期: 2019-03-07
要求修回日期: 2019-06-16
网络出版日期: 2020-07-28
基金资助
国家自然科学基金项目(41571154)
国家自然科学基金项目(41771183)
版权
Spatial relationship of country allocation of aid to Africa between China and OECD
Received date: 2019-03-07
Request revised date: 2019-06-16
Online published: 2020-07-28
Supported by
National Natural Science Foundation of China(41571154)
National Natural Science Foundation of China(41771183)
Copyright
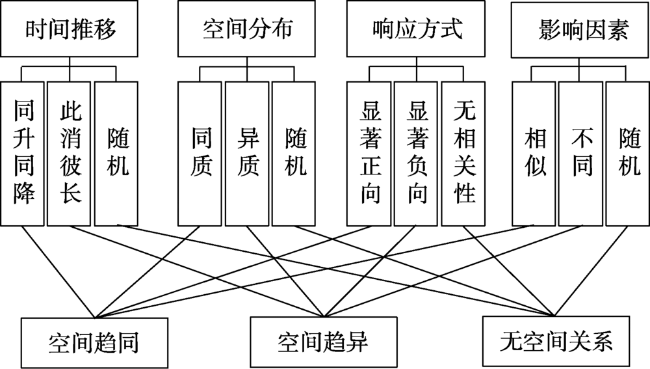
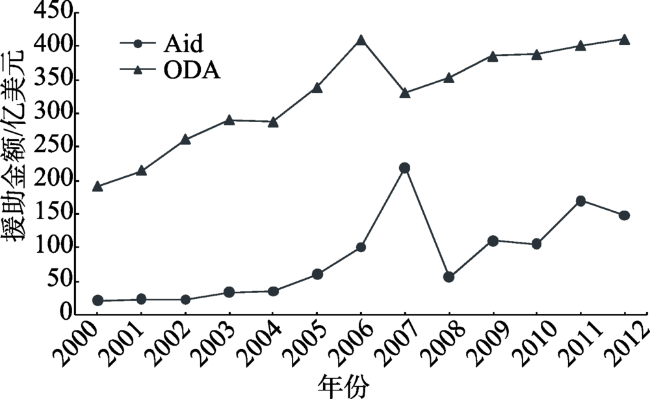
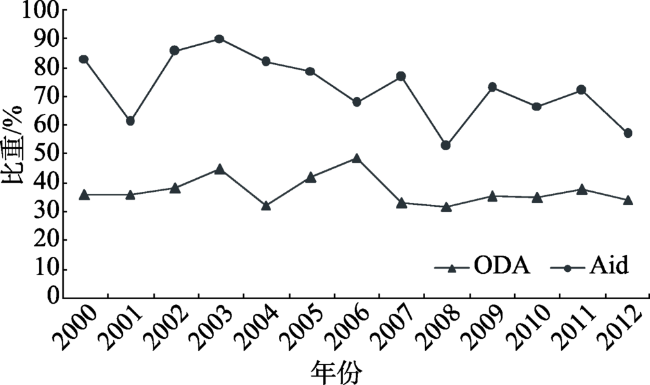
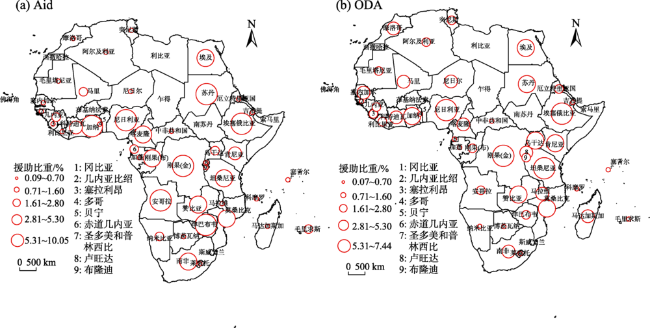
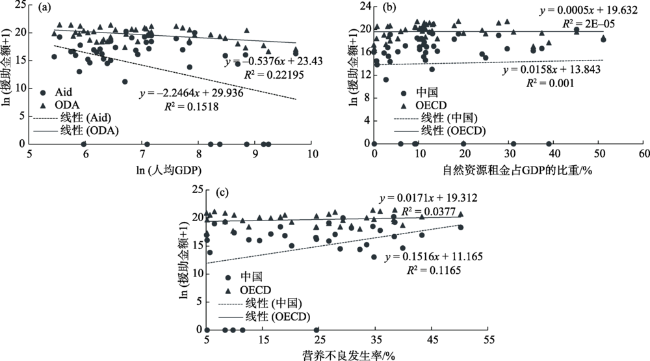
中国在非援助规模持续扩大,在打破原有援助格局的同时,其援助行为日益受到国际社会的关注,但现有研究较少关注中国和经济合作与发展组织(Organization for Economic Co-operation and Development,OECD)之间的空间关系。论文利用2000—2012年中国对非援助(Aid)与OECD对非援助(ODA)在非洲44个国家的数据,对比分析了二者的时间推移及国别分配特征,构建Aid和ODA静态面板模型,定量识别了二者的空间趋同关系。主要结论如下:① 援助金额大幅增加,时序相关性明显,受援国规模位序升降趋同,时间推移上呈同步性;② 地理匹配度高,重点援助国高度雷同,空间分布上呈同质性;③ Aid与ODA间存在稳健、显著的正向关系,响应方式具有一致性,但Aid对ODA响应程度更为敏感、强烈;④ 人均GDP和营养不良发生率是影响援助的2个强有力的因素,影响机制具有相似性。
邵静 , 王茂军 . 中国与OECD在非援助国别分配的空间关系研究[J]. 地理科学进展, 2020 , 39(5) : 766 -778 . DOI: 10.18306/dlkxjz.2020.05.006
China's aid to Africa (Aid) has received increasing attention from the international community as this aid is breaking the original aid pattern in this continent, but existing literatures paid little attention to the spatial relationship of aid to Africa between China and the OECD (Organization for Economic Co-operation and Development). Based on the data of Aid from China and ODA (Official Development Assistance) from OECD to 44 countries in Africa from 2001 to 2012, this study analyzed the geographical distribution features and the spatial evolution of the Aid and the ODA, and identified quantitatively their spatial convergence relationship by constructing a static panel regression model. The results show that: 1) The temporal change was synchronistic with significant increase in the amount of aid, and timing correlation was obvious as the changes of rank-size distribution of African countries tended to converge. 2) There exited homogeneity in spatial distribution, the degree of spatial match was high, and the main recipient countries were similar. 3) In addition to the consistency of response mode, there was a steady and significant positive relationship between the Aid and the ODA, and the degree of response to the ODA from the Aid was more sensitive and marked. 4) The influencing factors were similar, especially manifested in terms of GDP per capita and the incidence of malnutrition.
Key words: Aid; ODA; spatial convergence; static panel regression model
表1 模型变量、数据来源及描述性统计Tab.1 Model variables, data sources, and descriptive statistics |
| 指标 | 操作层 | 数据来源 | 最小值 | 最大值 | 中值 | 均值 | 标准差 | 偏度 | 峰度 |
|---|---|---|---|---|---|---|---|---|---|
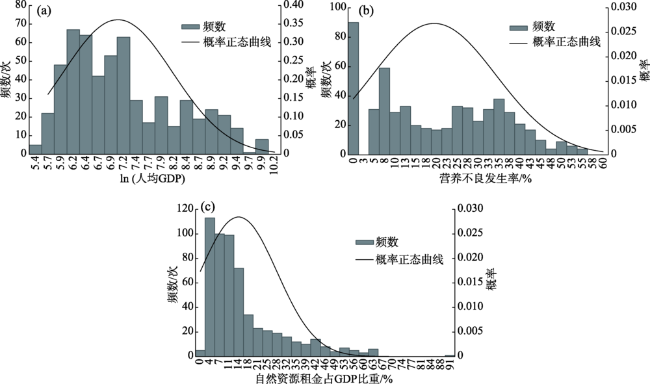
| 自然资源 | 非洲i国在t年的自然资源租金总额占GDP的百分比 | 世界银行 | 0 | 89.17 | 9.17 | 13.93 | 14.02 | 1.67 | 2.83 |
| 经济发展水平 | 非洲i国在t年的人均GDP | 世界银行 | 5.29 | 9.94 | 6.86 | 7.04 | 1.08 | 0.63 | -0.53 |
| 人道主义需求 | 非洲i国在t年的营养不良的发生率(占人口的百分比) | 世界银行 | 0 | 54.90 | 18.15 | 19.43 | 14.87 | 0.27 | -1.12 |
表2 政治权力指数数值分布Tab.2 Numerical distribution of political power index |
| 等级 | 数量/个 | 百分比/% | 累计百分比/% | 等级 | 数量/个 | 百分比/% | 累计百分比/% |
|---|---|---|---|---|---|---|---|
| 1 | 27 | 4.72 | 4.72 | 5 | 93 | 16.26 | 61.89 |
| 2 | 64 | 11.19 | 15.91 | 6 | 159 | 27.80 | 89.69 |
| 3 | 89 | 15.56 | 31.47 | 7 | 59 | 10.31 | 100.00 |
| 4 | 81 | 14.16 | 45.63 | 合计 | 572 | 100 |
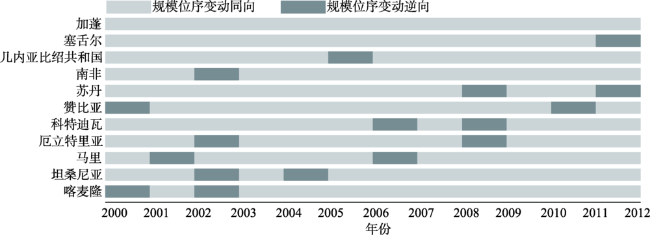
表3 2000—2012年受援国接收Aid、ODA规模位序变动同步次数Tab.3 Synchronized times of rank-size change ofrecipient countries of Aid and ODA, 2000-2012 |
| 同步次数/次 | 国家数量/个 | 国家名称 |
|---|---|---|
| 12 | 1 | 加蓬 |
| 11 | 3 | 塞舌尔、几内亚比绍共和国、南非 |
| 10 | 7 | 苏丹、赞比亚、科特迪瓦、厄立特里亚、马里、坦桑尼亚、喀麦隆 |
| 9 | 7 | 纳米比亚、刚果(布)、塞内加尔、毛里塔尼亚、布隆迪、几内亚、埃塞俄比亚 |
| 8 | 14 | 博茨瓦纳、尼日利亚、马拉维、利比里亚、安哥拉、尼日尔、科摩罗、莫桑比克、阿拉伯埃及共和国、塞拉利昂、阿尔及利亚、中非共和国、刚果(金)、突尼斯 |
| 7 | 7 | 肯尼亚、赤道几内亚、马达加斯加、摩洛哥、吉布提、津巴布韦、加纳 |
| 6 | 4 | 卢旺达、多哥、乌干达、莱索托 |
| 5 | 1 | 毛里求斯 |
表5 2000—2012年非洲国家援助稳健性结果Tab.5 Robustness of aid to African countries, 2000-2012 |
| 援助稳健性/% | Aid | ODA |
|---|---|---|
| >50 | 加纳(62%)、苏丹(62%)、尼日利亚(54%)、安哥拉(54%) | 坦桑尼亚(100%)、埃塞俄比亚(92%)、刚果(金)(77%) |
| 20~50 | 埃塞俄比亚(46%)、津巴布韦(38%)、刚果布(31%)、埃及(23%) | 苏丹(46%)、莫桑比克(46%)、埃及(38%)、尼日利亚(31%) |
| <20 | 科特迪瓦(15%)、肯尼亚(15%)、赞比亚(15%)、南非(15%)、坦桑尼亚(15%)、刚果(金)(8%)、莫桑比克(8%)、乌干达(8%)、喀麦隆(8%)、毛里求斯(8%)、赤道几内亚(8%)、博茨瓦纳(8%) | 科特迪瓦(15%)、肯尼亚(15%)、乌干达(15%)、加纳(8%)、喀麦隆(8%)、乌干达(8%) |
表6 单位根检验结果Tab.6 Result of unit root test |
| 变量 | LLC | IPS | ADF | 结论 |
|---|---|---|---|---|
| ln(中国援助额+1) | -14.810*** | -7.761*** | 217.543*** | 平稳 |
| ln(世界援助额+1) | -8.689*** | -2.873*** | 129.302*** | 平稳 |
| 自然资源租金占GDP比重 | -9.513*** | -2.868*** | 127.142*** | 平稳 |
| ln(人均GDP) | -14.122*** | -2.063** | 111.847** | 平稳 |
| 政治权利指数 | -8.855*** | -1.977** | 96.757** | 平稳 |
| 营养不良发生率 | -8.750*** | -3.797*** | 163.841*** | 平稳 |
注:*、**、***分别表示P<0.1、P<0.05、P<0.01。下同。 |
表7 静态面板回归结果Tab.7 Results of static panel regression model |
| 变量 | Aid模型 | 变量 | ODA模型 | |||||||||
|---|---|---|---|---|---|---|---|---|---|---|---|---|
| (1) | (2) | (3) | (4) | (5) | (6) | (7) | (8) | (9) | (10) | (11) | ||
| 常量 | -18.650*** (-2.61) | -42.096*** (-4.48) | -42.207*** (-4.31) | -27.782*** (-2.62) | -27.719*** (-2.56) | -27.341*** (-2.64) | 常量 | 19.541*** (716.00) | 13.302*** (23.49) | 13.228*** (23.34) | 14.158*** (20.79) | 14.373*** (21.14) |
| ln(ODA+1) | 1.592*** (4.39) | 1.127*** (2.89) | 1.130*** (2.81) | 0.841** (2.07) | 0.833** (2.04) | 0.833** (2.08) | ln(Aid+1) | 0.010*** (5.45) | 0.007*** (4.02) | 0.007*** (4.28) | 0.007*** (4.02) | 0.007*** (3.96) |
| ln(人均GDP) | 4.619*** (3.93) | 4.612*** (3.85) | 3.882*** (3.09) | 3.904*** (3.10) | 3.847** (3.12) | ln(人均GDP) | 0.891*** (11.02) | 0.888*** (10.89) | 0.783*** (8.46) | 0.782*** (8.52) | ||
| 自然资源租金占GDP比重/% | 0.007 (0.18) | 0.004 (0.10) | 0.005 (0.11) | 自然资源租金占GDP比重/% | 0.006** (2.29) | 0.006** (2.23) | 0.005* (1.83) | |||||
| 营养不良发生率/% | -0.182*** (-4.16) | -0.183*** (-4.13) | -0.181*** (-4.15) | 营养不良发生率/% | -0.009*** (-2.82) | -0.010*** (-3.06) | ||||||
| 政治权利指数 | -0.014 (-0.05) | 政治权利指数 | -0.041** (-2.25) | |||||||||
| N | 572 | 572 | 572 | 572 | 572 | 572 | N | 572 | 572 | 572 | 572 | 572 |
| R2 | 0.438 | 0.450 | 0.445 | 0.456 | 0.456 | 0.461 | R2 | 0.922 | 0.938 | 0.939 | 0.939 | 0.941 |
| 校正R2 | 0.391 | 0.403 | 0.396 | 0.408 | 0.406 | 0.414 | 校正R2 | 0.916 | 0.933 | 0.933 | 0.933 | 0.935 |
| Prob(Quasi-LR stat) | <0.001 | <0.001 | <0.001 | <0.001 | <0.001 | <0.001 | Prob(Quasi-LR stat) | <0.001 | <0.001 | <0.001 | <0.001 | <0.001 |
| Hausman P值 | 0.147 | 0.042 | 0.110 | 0.001 | 0.002 | 0.002 | Hausman P值 | 0.004 | <0.001 | <0.001 | <0.001 | <0.001 |
注:括号中数据为标准误差。 |
| [1] |
|
| [2] |
|
| [3] |
|
| [4] |
赵金合 . 新世纪中国对非洲援助的特点、动因和影响[D]. 石家庄: 河北师范大学, 2009.
[
|
| [5] |
|
| [6] |
张海冰 . 关于中国对非洲援助能源导向的观点分析 [J]. 世界经济研究, 2007(10):76-80, 88.
[
|
| [7] |
安宁, 梁邦兴, 朱竑 . “走出去”的地理学: 从人文地理学视角看中非合作研究 [J]. 地理科学进展, 2018,37(11):1521-1532.
[
|
| [8] |
罗建波 . 中国与西方国家的对非洲外交: 在分歧中寻求共识与合作 [J]. 世界经济与政治, 2009(4):26-35, 3.
[
|
| [9] |
冯喆颖 . 二十一世纪初中美对非洲援助的比较研究[D]. 北京: 外交学院, 2010.
[
|
| [10] |
金玲. 对非援助: 中国与欧盟能否经验共享 [J]. 国际问题研究, 2010(1):53-61.
[
|
| [11] |
李伟涛 . 中国与欧盟对非洲援助比较研究[D]. 武汉: 华中师范大学, 2011.
[
|
| [12] |
王新影 . 欧盟与中国对非援助政策比较研究 [J]. 亚非纵横, 2011 (1): 50-54,56, 58.
[
|
| [13] |
王丽娟, 姜新茹 . 美国对非援助的影响及实质评价 [J]. 太平洋学报, 2014,22(2):52.
[
|
| [14] |
|
| [15] |
|
| [16] |
|
| [17] |
|
| [18] |
|
| [19] |
|
| [20] |
|
| [21] |
|
| [22] |
|
| [23] |
|
| [24] |
|
| [25] |
|
| [26] |
|
| [27] |
|
| [28] |
|
| [29] |
|
| [30] |
|
| [31] |
|
| [32] |
|
| [33] |
刘晴, 王伊欢 . 中国对外援助时空变迁与新时代援助策略 [J]. 经济地理, 2018,38(2):36-42.
[
|
| [34] |
|
| [35] |
|
| [36] |
|
| [37] |
董艳, 樊此君 . 援助会促进投资吗? 基于中国对非洲援助及直接投资的实证研究 [J]. 国际贸易问题, 2016(3):59-69.
[
|
| [38] |
朱丹丹, 黄梅波 . 中国对外援助能够促进受援国的经济增长吗? 兼论“促贸援助”方式的有效性 [J]. 中国经济问题, 2018(2):24-33.
[
|
| [39] |
杨亚平, 李琳琳 . 对非援助会减轻腐败对投资的“摩擦效应”吗? 兼论“一带一路”倡议下中非经贸合作策略 [J]. 财贸经济, 2018,39(3):95-108, 122.
[
|
| [40] |
刘爱兰, 王智烜, 黄梅波 . 中国对非援助是“新殖民主义”吗: 来自中国和欧盟对非援助贸易效应对比的经验证据 [J]. 国际贸易问题, 2018(3):163-174.
[
|
| [41] |
|
| [42] |
|
| [43] |
李连弟 . 对外援助的动机分析: 经验研究与中国对策[D]. 天津: 河北工业大学, 2015.
[
|
| [44] |
|
| [45] |
|
| [46] |
|
| [47] |
|
| [48] |
魏雪梅 . 冷战后中美对非洲援助比较研究[D]. 北京: 中共中央党校, 2011.
[
|
| [49] |
王国庆 . 国际官方发展援助分配研究[D]. 北京: 中国社会科学院研究生院, 2012.
[
|
| [50] |
|
| [51] |
|
| [52] |
|
| [53] |
|
| [54] |
|
| [55] |
|
| [56] |
|
| [57] |
|
/
| 〈 |
|
〉 |