
基于CLM模型的月尺度中亚陆表蒸散和土壤水分模拟估算
|
姜勃(1990— ),男,江苏淮安人,博士生,主要从事陆面过程及定量遥感研究。E-mail: jiangb. 17b@igsnrr.ac.cn |
收稿日期: 2019-02-18
要求修回日期: 2019-09-29
网络出版日期: 2020-05-28
基金资助
中国科学院战略先导研究项目(XDA2004030201)
国家自然科学基金项目(41671354)
版权
Estimation of monthly evapotranspiration and soil moisture in the Central Asia
Received date: 2019-02-18
Request revised date: 2019-09-29
Online published: 2020-05-28
Supported by
Strategic Priority Research Program of Chinese Academy of Sciences(XDA2004030201)
National Natural Science Foundation of China(41671354)
Copyright
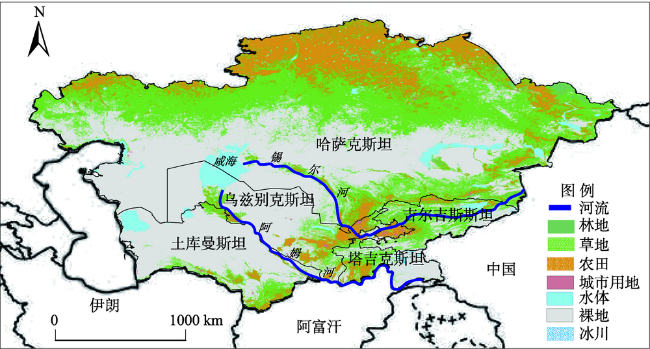
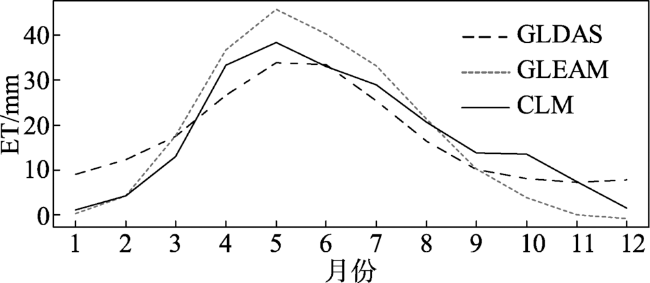
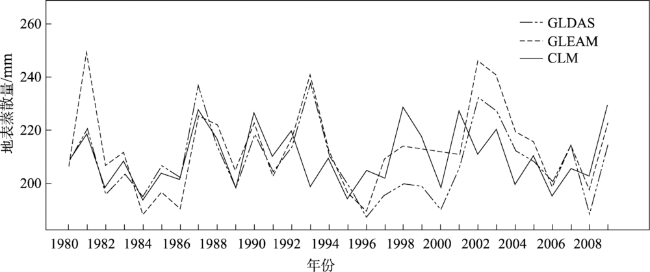
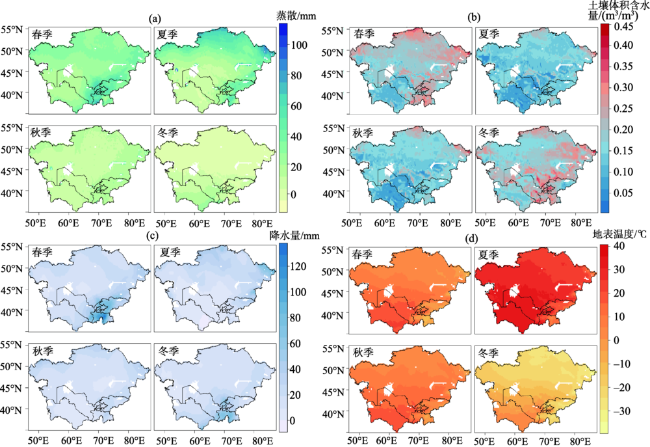
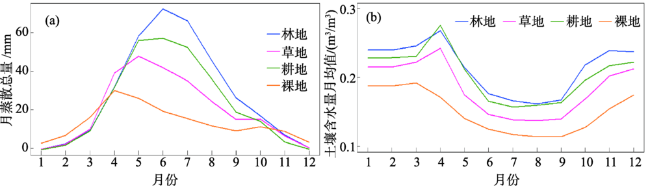
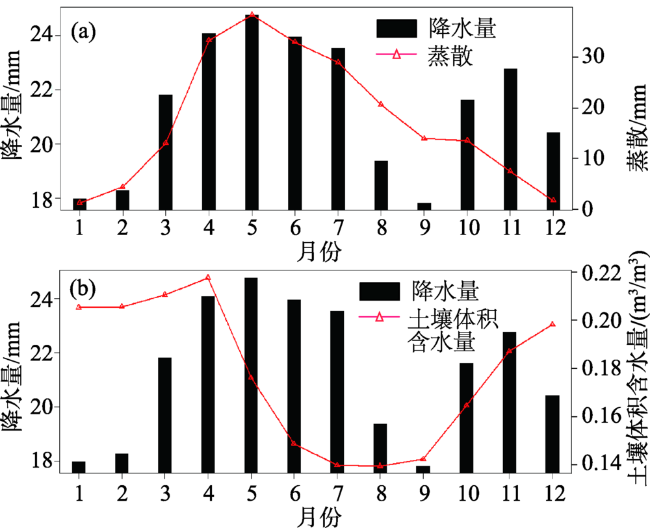
论文基于CLM 4.5模拟1980—2009年月尺度中亚陆表蒸散发和土壤水分,并和GLDAS、GLEAM数据产品进行对比,结果表明CLM 4.5模拟的蒸散和土壤水分区域平均值和其他产品具有较好的一致性。从CLM 4.5模拟的陆表蒸散结果分析可知:全年蒸散大部分集中于春夏2季,在5月达到一年的最大值,夏季中亚的蒸散高值区集中在哈萨克斯坦北部和东北部、东南部的山地区,对应主要的农田区和林地区,植被蒸腾占主导因素;春季东南部天山山脉和帕米尔高原是蒸散高值区,主要因为该地区春季降水量较大,且积雪开始融化,水量充足,地表蒸散发充分;蒸散低值区主要在西南的土库曼斯坦和乌兹别克斯坦,地表覆盖以荒漠为主,植被覆盖较少,降水也较少,导致地面蒸散量较低。模拟的表层土壤水分结果表明:冬季陆面蒸散低,降水大多储存在表层土壤内或者以积雪的形式覆盖在地面上,春季气温升高,积雪融化下渗到土壤中,土壤水分持续增加,4月份达到峰值;夏季蒸散增加,降水减少,土壤水分持续下降,9月份达到最低值;进入秋冬季后蒸散降低,土壤水分呈上升趋势。中亚土壤水分高值区集中在北部和东北部的林地、农田区,以及天山山脉和下游的阿姆河、锡尔河流域区,西南部的荒漠区依然是低值区。一年中,夏季降水较少,由于地面蒸发的作用,土壤水分持续较少,蒸散也随之降低。三者之间相关性很高;冬季降水和土壤之间的相关性较高,尤其是裸地区;在植被覆盖较大的情况下,春季降水和蒸散相关性较高,土壤水分和降水、蒸散之间相关性较低,会出现负相关情况。CLM 4.5模拟的结果为进一步中亚地区的水问题研究奠定基础。
姜勃 , 田静 , 苏红波 . 基于CLM模型的月尺度中亚陆表蒸散和土壤水分模拟估算[J]. 地理科学进展, 2020 , 39(3) : 433 -442 . DOI: 10.18306/dlkxjz.2020.03.008
There is insufficient study of evapotranspiration (ET) and soil moisture (SM) in arid ecosystems such as the Central Asia. To address this issue, we applied the land surface model (CLM 4.5) to simulate monthly ET and SM in the Central Asia from 1980 to 2009. Other products including GLDAS (Global Land Data Assimilation System), GLEAM (Global Land-surface Evaporation Amsterdam methodology), and AMSR-E (Advanced Microwave Scanning Radiometer for EOS) were used to compare with the simulated results. The comparison indicates that the simulated results agree favorably with other products. Most of the annual evapotranspiration concentrates in spring and summer, reaching its maximum in May. In summer, the high evapotranspiration areas in the Central Asia are concentrated in the northern and northeastern corner of Kazakhstan, and in the southeastern mountainous areas. Vegetation transpiration plays a leading role in the main farmland and forest areas. In spring, the Tianshan Mountains and the Pamir Plateau in the southeast are the high value areas of evapotranspiration, mainly because with the high rainfall and the beginning of snow melting, there is sufficient water for evapotranspiration. The spatial patterns of annual ET and SM in the Central Asia show that the areas with high ET are distributed in the northern and northeastern corner of Kazakhstan and in the southeastern mountainous areas, and the low ET areas are mainly located in Turkmenistan and Uzbekistan, where desert is the main land cover type. The results of simulated surface soil moisture show that in winter, land surface evapotranspiration is low, and precipitation is mostly stored in the surface soil or in snow cover. In spring, air temperature rises, snow melts, and water seeps into the soil. Soil moisture increases continuously, reaching its peak in April. In summer soil moisture continues to decrease, and reaches its lowest value in September. In autumn and winter, evapotranspiration decreases and soil moisture increases. The high value areas of soil moisture in the Central Asia are concentrated in the woodland and farmland areas in the northern and northeastern part, as well as the Amu River and Sir River basins in the Tianshan Mountains and downstream, while the desert areas in the southwest are low value areas. In summer rainfall, evapotranspiration, and soil moisture are low, so the correlation between them is very high; winter precipitaton and soil moisture are highly correlated, especially in barren areas; in the case of high vegetation coverage, spring rainfall and evapotranspiration are highly correlated, and the correlation between soil moisture and rainfall, evapotranspiration is low, and a negative correlation can be observed. Overall, the result of this study will lay foundation for further research on water issues in the Central Asia.
Key words: evapotranspiration; soil moisture; CLM 4.5; the Central Asia
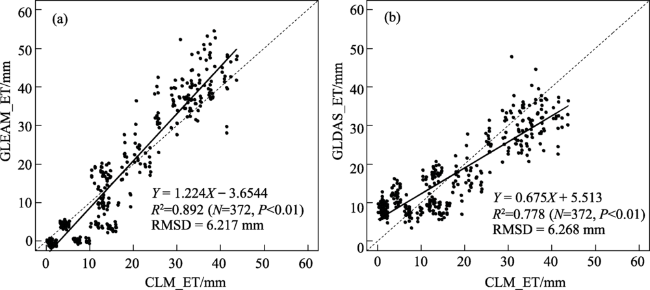
图2 1980—2009年CLM模拟的月平均地表蒸散(ET)与GLEAM和GLDAS地表蒸散产品的对比Fig.2 Scatter plot of monthly evapotranspiration (ET) between common land model (CLM) simulations and GLEAM, GLDAS products, 1980-2009 |
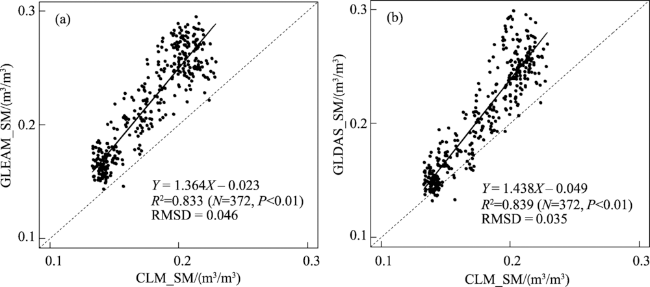
图5 1980—2009年CLM模拟月平均土壤水分含量(SM)与GLEAM和GLDAS土壤水分产品的对比Fig.5 Scatter plot of monthly mean soil moisture (SM) between common land model (CLM) simulations and GLEAM, GLDAS products, 1980-2009 |
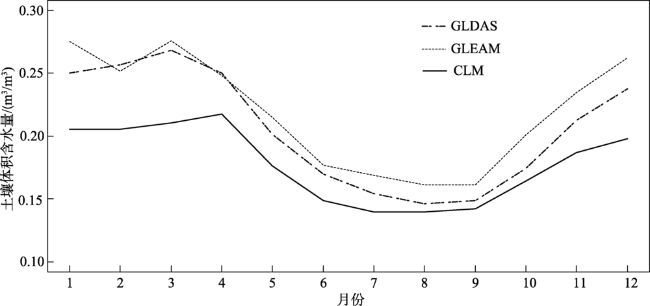
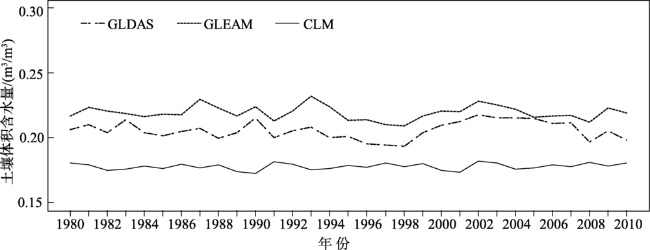
图6 3种数据土壤体积含水量的月均值对比Fig.6 Time series of monthly mean volumetric soil water content of the three products |
图10 不同月份降雨和地表蒸散、土壤含水量的对比Fig.10 Comparison between monthly precipitation and evapotranspiration (ET), soil moisture |
表1 不同植被覆盖、季节情况下蒸散和降水、土壤水之间相关性Tab.1 Correlation between evapotranspiration and rainfall, soil water under different vegetation cover and in different seasons |
| 季节 | 林地 | 草地 | 耕地 | 裸地 | |
|---|---|---|---|---|---|
| 蒸散 与降水 相关性 | 春季 | 0.480 | 0.790* | 0.640* | 0.900* |
| 夏季 | 0.870* | 0.920* | 0.950* | 0.970* | |
| 秋季 | 0.026 | 0.658* | 0.482 | 0.773* | |
| 冬季 | -0.230 | -0.510 | -0.590 | 0.430 | |
| 季节 | 林地 | 草地 | 耕地 | 裸地 | |
| 蒸散与土壤水相关性 | 春季 | 0.150 | 0.756* | 0.721* | 0.713* |
| 夏季 | 0.985* | 0.842* | 0.897* | 0.946* | |
| 秋季 | 0.558 | 0.657* | 0.405 | 0.894* | |
| 冬季 | -0.260 | 0.130 | -0.470 | 0.450 |
注:*表示P<0.05。 |
| [1] |
马明清, 袁武, 葛全胜 , 等. “一带一路”若干区域社会发展态势大数据分析[J]. 地理科学进展, 2019,38(7):1009-1020.
[
|
| [2] |
陈艺文, 李二玲 . “一带一路”国家粮食贸易网络空间格局及其演化机制[J]. 地理科学进展, 2019,38(10):1643-1654.
[
|
| [3] |
杨胜天, 于心怡, 丁建丽 , 等. 中亚地区水问题研究综述[J]. 地理学报, 2017,72(1):79-93.
[
|
| [4] |
|
| [5] |
李琴, 陈曦, 包安明 , 等. 基于SEBS模型干旱区蒸散发量研究[J]. 遥感技术与应用, 2014,29(2):195-201.
[
|
| [6] |
李超凡, 罗格平, 李均力 , 等. 近20 a中亚净初级生产力与实际蒸散发特征分析[J]. 干旱区地理, 2012,35(6):919-927.
[
|
| [7] |
张建财, 张丽, 郑艺 , 等. 基于LPJ模型的中亚地区植被净初级生产力与蒸散模拟[J]. 草业科学, 2015,32(11):1721-1729.
[
|
| [8] |
|
| [9] |
|
| [10] |
|
| [11] |
|
| [12] |
|
| [13] |
|
| [14] |
|
| [15] |
|
| [16] |
|
| [17] |
|
| [18] |
|
| [19] |
|
| [20] |
赖欣, 文军, 岑思弦 , 等. CLM 4.0模式对中国区域土壤湿度的数值模拟及评估研究[J]. 大气科学, 2014,38(3):499-512.
[
|
| [21] |
孟现勇 . 基于改进的CLDAS驱动CLM 3.5及SWAT模式的陆分量模拟及验证[D]. 乌鲁木齐: 新疆大学, 2016.
[
|
| [22] |
李正泉, 于贵瑞, 温学发 , 等. 中国通量观测网络(ChinaFLUX)能量平衡闭合状况的评价[J]. 中国科学: 地球科学, 2004,34(S2):46-56.
[
|
| [23] |
|
| [24] |
|
| [25] |
|
/
| 〈 |
|
〉 |