
基于MRIO的中国省区和产业灰水足迹测算及转移分析
|
孙才志(1970— ),男,山东烟台人,教授,博士生导师,主要从事水资源与海洋经济研究。E-mail:suncaizhi@lnnu.edu.cn |
收稿日期: 2019-02-18
要求修回日期: 2019-05-23
网络出版日期: 2020-04-28
基金资助
国家社会科学重点基金项目(19AJY010)
版权
Measurement and transfer analysis of grey water footprint of Chinese provinces and industries based on a multi-regional input-output model
Received date: 2019-02-18
Request revised date: 2019-05-23
Online published: 2020-04-28
Supported by
Key Project of National Social Science Foundation of China(19AJY010)
Copyright
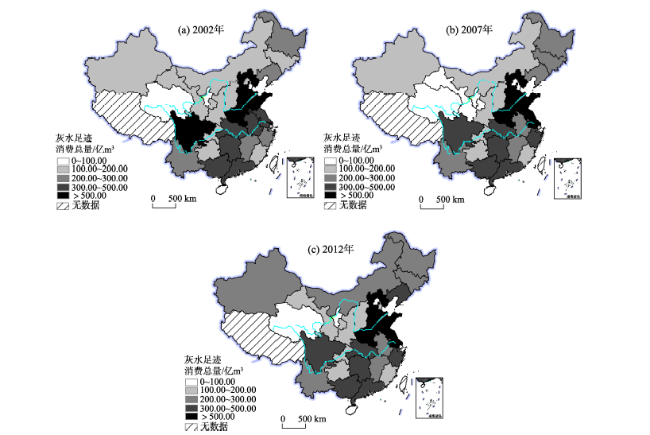
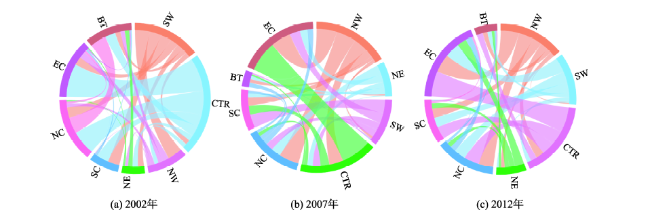
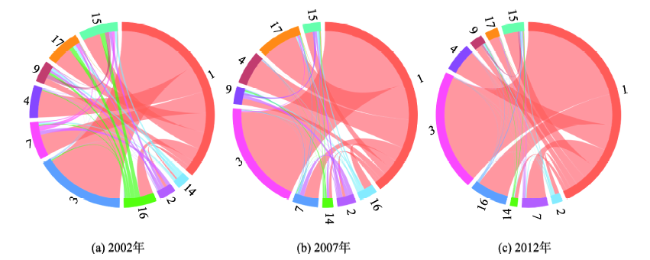
水资源短缺与水资源污染已经严重影响到人类的生存与中国的可持续发展,分析各地区与各产业水资源污染情况是解决中国环境可持续发展的关键。论文在对传统灰水足迹研究的基础上,利用2002、2007和2012年多区域投入产出表,计算中国30个省份(因数据所限,未分析西藏、香港、澳门和台湾地区)和17个产业2002—2012年中间消费和最终消费灰水足迹,以及合并后的8大区域和17个产业的总灰水足迹转移。结果表明:① 山东、河南和河北等经济规模较大的地区灰水足迹一直处于相对较高的状态,青海、宁夏和海南等经济规模较小的地区灰水足迹一直处于相对较少的状态。② 农业是灰水足迹产生的最大部门,商业及运输业等4个产业部门灰水足迹较大,但其总和却远小于农业灰水足迹;其他制造业等5个产业部门灰水足迹一直相对较少。③ 灰水足迹净输入区域为京津区域、北部沿海区域、东部沿海区域和南部沿海区域;灰水足迹转移量最大的2条路径之和呈现先增加后减少的趋势,识别出的主要灰水足迹流出—流入关系区域为中部区域—东部沿海区域。④ 农业和采选业为灰水足迹净输出部门,大部分轻工业及第三产业为灰水足迹净输入部门;识别出的主要灰水足迹流出—流入关系部门包括农业—食品制造及烟草加工业、农业—纺织服务业、农业—化学工业。各地区和产业产生的灰水足迹以及区域和产业识别出的灰水足迹路径可为减少灰水产生提供理论依据,同时为地区和产业水资源合理利用提供理论支持。
孙才志 , 阎晓东 . 基于MRIO的中国省区和产业灰水足迹测算及转移分析[J]. 地理科学进展, 2020 , 39(2) : 207 -218 . DOI: 10.18306/dlkxjz.2020.02.003
Water shortage and water pollution have seriously affected human survival and China's sustainable development. Analysis of water pollution in various regions and industries is the key for addressing China's environmental sustainability problem. This study used multiregional input-output tables for 2002, 2007, and 2012 on the basis of traditional greywater footprint research, calculated the process and final consumption grey water footprints of China's 30 provinces, municipalities, and autonomous regions (not including Tibet, Hong Kong, Macao and Tianwan) and 17 industries during 2002-2012, and the total grey water footprint transfer of the eight regions and 17 industries. The results show that: 1) The grey water footprints of large economic areas such as Shandong, Henan, and Hebei have been relatively high, and the grey water footprints of relatively small economies such as Qinghai, Ningxia, and Hainan have been relatively small. 2) Agriculture is the largest sector contributing to grey water footprint. The four industries in the commercial and transportation sectors have large grey water footprints, but their total is far less than the agricultural grey water footprint. The grey water footprints of five industrial sectors, such as other manufacturing industries, have been relatively small. 3) The net input area of grey water footprint is the Beijing-Tianjin region, northern coastal region, eastern coastal region, and southern coastal region. The sum of the two paths with the largest amount of grey water footprint transfer increases first and then decreases. The identified main grey water footprint outflow-inflow area is the central area-the eastern coastal area. 4) Agriculture and mining industry are the net export sectors of grey water footprints. Most light industries and tertiary industries are the net input sectors of grey water footprints. The identified major grey water footprint outflow-inflow sectors include agriculture-food manufacturing and tobacco processing, agriculture-textile services, and agriculture-chemical industries. The grey water footprints generated by various regions and industries and the grey water footprint paths identified for the regions and industries can provide a theoretical basis for reducing grey water production, and provide theoretical support for the rational use of regional and industrial water resources.
表1 区域间灰水足迹投入产出表Tab.1 Inter-regional grey water footprint input-output table (万元) |
| 投入 | 中间使用 | 最终使用 | 出口 | 总产出 | |||||||||||
|---|---|---|---|---|---|---|---|---|---|---|---|---|---|---|---|
| 区域 | … | 区域 | 区域 | … | 区域 | ||||||||||
| 部门 | … | 部门 | 部门 | … | 部门 | ||||||||||
| 中间投入 | 区域 | 部门 | … | … | … | … | |||||||||
| … | … | … | … | … | … | … | … | … | … | … | … | … | |||
| 部门 | … | … | … | … | |||||||||||
| … | … | … | … | … | … | … | … | … | … | ||||||
| 区域 | 部门 | … | … | … | … | ||||||||||
| … | … | … | … | … | … | … | … | … | … | … | … | … | |||
| 部门 | … | … | … | … | |||||||||||
| 进口 | … | … | … | ||||||||||||
| 增加值 | … | … | … | ||||||||||||
| 总投入 | … | … | … | ||||||||||||
| 灰水足迹 | |||||||||||||||
表2 产业分类Tab.2 Industry classification |
| 代码 | 产业 | 代码 | 产业 |
|---|---|---|---|
| 1 | 农业 | 10 | 机械工业 |
| 2 | 采选业 | 11 | 交通运输设备制造业 |
| 3 | 食品制造及烟草加工业 | 12 | 电器机械及电子通信设备制造业 |
| 4 | 纺织服务业 | 13 | 其他制造业 |
| 5 | 木材加工及家具制造业 | 14 | 电力、热力及水的生产与供应业 |
| 6 | 造纸印刷及文教用品制造业 | 15 | 建筑业 |
| 7 | 化学工业 | 16 | 商业及运输业 |
| 8 | 非金属矿物制品业 | 17 | 其他服务业 |
| 9 | 金属冶炼及制品业 |
表3 中国30个省份2002—2012年灰水足迹消费计算结果Tab.3 Calculation results of grey water footprint consumption in 30 provinces of China, 2002-2012 (亿m3) |
| 省份 | 2002年 | 2007年 | 2012年 | ||||||||
|---|---|---|---|---|---|---|---|---|---|---|---|
| 北京 | 71.96 | 59.39 | 131.35 | 53.44 | 27.75 | 81.19 | 5.00 | 43.17 | 48.17 | ||
| 天津 | 36.75 | 31.51 | 68.26 | 66.14 | 14.37 | 80.51 | 109.53 | 34.65 | 144.18 | ||
| 河北 | 377.04 | 128.17 | 505.21 | 499.53 | 109.45 | 608.99 | 468.23 | 116.65 | 584.88 | ||
| 山西 | 82.08 | 80.50 | 162.58 | 105.52 | 72.53 | 178.06 | 102.85 | 74.68 | 177.53 | ||
| 内蒙古 | 88.42 | 81.98 | 170.40 | 107.17 | 61.25 | 168.42 | 113.82 | 108.28 | 222.09 | ||
| 辽宁 | 114.98 | 130.60 | 245.59 | 184.03 | 110.40 | 294.43 | 198.53 | 111.74 | 310.26 | ||
| 吉林 | 121.19 | 63.60 | 184.80 | 171.29 | 68.56 | 239.85 | 172.89 | 63.06 | 235.95 | ||
| 黑龙江 | 115.24 | 96.60 | 211.84 | 175.65 | 66.48 | 242.14 | 213.59 | 67.09 | 280.69 | ||
| 上海 | 71.96 | 67.27 | 139.24 | 65.95 | 69.36 | 135.31 | 13.08 | 56.28 | 69.36 | ||
| 江苏 | 267.51 | 123.03 | 390.54 | 369.33 | 140.57 | 509.90 | 372.79 | 149.13 | 521.92 | ||
| 浙江 | 197.13 | 97.86 | 294.99 | 242.10 | 105.71 | 347.82 | 216.43 | 94.45 | 310.88 | ||
| 安徽 | 192.30 | 134.05 | 326.34 | 147.56 | 96.71 | 244.27 | 169.25 | 97.08 | 266.32 | ||
| 福建 | 71.99 | 66.84 | 138.83 | 106.00 | 53.53 | 159.53 | 96.50 | 62.75 | 159.24 | ||
| 江西 | 134.39 | 94.38 | 228.78 | 129.62 | 72.34 | 201.96 | 141.12 | 71.53 | 212.65 | ||
| 山东 | 444.27 | 236.14 | 680.41 | 472.34 | 207.80 | 680.14 | 446.03 | 211.07 | 657.10 | ||
| 河南 | 419.28 | 215.96 | 635.24 | 384.22 | 196.30 | 580.52 | 457.03 | 198.50 | 655.52 | ||
| 湖北 | 183.93 | 172.45 | 356.38 | 219.04 | 123.67 | 342.71 | 264.95 | 125.02 | 389.97 | ||
| 湖南 | 269.41 | 163.55 | 432.95 | 311.78 | 122.46 | 434.24 | 320.86 | 125.64 | 446.49 | ||
| 广东 | 178.96 | 182.62 | 361.58 | 240.86 | 155.91 | 396.77 | 220.36 | 177.31 | 397.67 | ||
| 广西 | 205.81 | 143.17 | 348.97 | 268.89 | 97.45 | 366.33 | 267.13 | 137.42 | 404.55 | ||
| 海南 | 50.12 | 9.57 | 59.69 | 77.79 | 7.14 | 84.93 | 76.76 | 11.52 | 88.28 | ||
| 重庆 | 45.43 | 121.71 | 167.14 | 45.56 | 80.45 | 126.01 | 59.63 | 92.07 | 151.70 | ||
| 四川 | 263.46 | 265.53 | 528.99 | 282.72 | 170.15 | 452.87 | 294.06 | 193.44 | 487.50 | ||
| 贵州 | 97.76 | 87.82 | 185.58 | 80.99 | 55.72 | 136.71 | 77.31 | 64.56 | 141.87 | ||
| 云南 | 127.61 | 132.73 | 260.34 | 138.45 | 88.05 | 226.49 | 167.35 | 114.80 | 282.15 | ||
| 陕西 | 83.58 | 96.42 | 180.00 | 88.47 | 49.29 | 137.76 | 100.36 | 90.73 | 191.09 | ||
| 甘肃 | 52.44 | 51.97 | 104.40 | 62.22 | 24.87 | 87.09 | 85.19 | 36.41 | 121.61 | ||
| 青海 | 34.34 | 21.11 | 55.45 | 38.96 | 8.68 | 47.63 | 53.30 | 16.32 | 69.61 | ||
| 宁夏 | 27.34 | 21.77 | 49.11 | 39.65 | 10.08 | 49.73 | 41.23 | 17.77 | 59.00 | ||
| 新疆 | 78.20 | 81.89 | 160.09 | 115.80 | 34.49 | 150.29 | 180.34 | 54.93 | 235.27 | ||
| 总和 | 4504.90 | 3260.18 | 7765.08 | 5291.07 | 2501.51 | 7792.59 | 5505.49 | 2818.04 | 8323.53 | ||
表4 中国17个产业2002—2012年灰水足迹消费计算结果Tab.4 Calculation results of grey water footprint consumption of 17 industries in China, 2002-2012 (亿m3) |
| 产业代码 | 2002年 | 2007年 | 2012年 | ||||||||
|---|---|---|---|---|---|---|---|---|---|---|---|
| 1 | 3122.59 | 2440.12 | 5562.71 | 3924.90 | 1947.89 | 5872.79 | 4572.00 | 2344.31 | 6916.31 | ||
| 2 | 178.42 | 57.58 | 236.00 | 285.91 | 54.15 | 340.07 | 139.58 | 30.11 | 169.69 | ||
| 3 | 70.34 | 79.62 | 149.96 | 76.48 | 59.02 | 135.50 | 64.51 | 40.00 | 104.50 | ||
| 4 | 26.84 | 18.35 | 45.19 | 29.75 | 8.54 | 38.29 | 27.33 | 10.67 | 38.00 | ||
| 5 | 6.85 | 4.24 | 11.10 | 11.33 | 4.49 | 15.82 | 9.42 | 5.13 | 14.55 | ||
| 6 | 28.55 | 11.55 | 40.10 | 22.11 | 5.88 | 27.99 | 17.30 | 6.13 | 23.43 | ||
| 7 | 185.03 | 71.26 | 256.29 | 157.97 | 38.21 | 196.19 | 142.21 | 43.72 | 185.94 | ||
| 8 | 35.64 | 23.80 | 59.43 | 45.38 | 18.12 | 63.50 | 36.12 | 20.57 | 56.68 | ||
| 9 | 131.69 | 57.13 | 188.82 | 160.15 | 45.18 | 205.33 | 129.90 | 47.03 | 176.93 | ||
| 10 | 41.57 | 36.14 | 77.71 | 39.18 | 25.60 | 64.78 | 28.36 | 21.79 | 50.15 | ||
| 11 | 57.10 | 28.68 | 85.77 | 41.06 | 18.23 | 59.30 | 22.40 | 27.18 | 49.57 | ||
| 12 | 34.51 | 33.26 | 67.78 | 29.62 | 16.40 | 46.01 | 38.26 | 22.34 | 60.60 | ||
| 13 | 9.81 | 5.08 | 14.89 | 10.52 | 3.55 | 14.07 | 8.89 | 2.94 | 11.83 | ||
| 14 | 162.91 | 69.37 | 232.27 | 133.59 | 37.38 | 170.97 | 80.79 | 23.63 | 104.42 | ||
| 15 | 8.67 | 58.53 | 67.19 | 3.05 | 31.65 | 34.70 | 2.54 | 29.73 | 32.28 | ||
| 16 | 320.09 | 159.71 | 479.80 | 234.54 | 102.18 | 336.71 | 144.24 | 84.06 | 228.30 | ||
| 17 | 84.30 | 105.77 | 190.07 | 85.53 | 85.05 | 170.58 | 41.65 | 58.70 | 100.35 | ||
| 总和 | 4504.90 | 3260.18 | 7765.08 | 5291.07 | 2501.51 | 7792.59 | 5505.49 | 2818.04 | 8323.53 | ||
| [1] |
孙才志, 韩琴, 郑德凤 . 中国省际灰水足迹测度及荷载系数的空间关联分析[J]. 生态学报, 2016,36(1):86-97.
[
|
| [2] |
国家环境保护部. 中国环境年鉴 [M]. 北京: 中国环境出版社, 2017.
[ The Ministry of Environmental Protection of the People's Republic of China. China Environment Yearbook. Beijing, China: China Environment Press, 2017. ]
|
| [3] |
|
| [4] |
孙才志, 白天骄, 韩琴 . 基于基尼系数的中国灰水足迹区域与结构均衡性分析[J]. 自然资源学报, 2016,31(12):2047-2059.
[
|
| [5] |
张楠, 李春晖, 杨志峰 , 等. 基于灰水足迹理论的河北省水资源评价[J]. 北京师范大学学报(自然科学版), 2017,53(1):75-79.
[
|
| [6] |
冯浩源, 石培基, 周文霞 , 等. 水资源管理 “三条红线” 约束下的城镇化水平阈值分析: 以张掖市为例[J]. 自然资源学报, 2018,33(2):287-301.
[
|
| [7] |
|
| [8] |
|
| [9] |
|
| [10] |
|
| [11] |
|
| [12] |
|
| [13] |
袁野, 胡聃 . 基于投入产出方法的中国居民虚拟水消费研究[J]. 中国人口·资源与环境, 2011,21(3):415-418.
[
|
| [14] |
李方一, 刘卫东, 刘红光 . 区域间虚拟水贸易模型及其在山西省的应用[J]. 资源科学, 2012,34(5):802-810.
[
|
| [15] |
谭圣林, 邱玉国, 熊育久 . 投入产出法在虚拟水消费与贸易研究中的新应用[J]. 自然资源学报, 2014,29(2):355-364.
[
|
| [16] |
马忠, 张晓霞 . 基于投入产出分析的虚拟水研究综述及展望[J]. 环境科学与管理, 2015,40(9):20-24.
[
|
| [17] |
吴兆丹, 赵敏,
[
|
| [18] |
曹涛, 王塞鸽, 陈彬 . 基于多区域投入产出分析的京津冀地区虚拟水核算[J]. 生态学报, 2018,38(3):788-799.
[
|
| [19] |
蔡振华, 沈来新, 刘俊国 , 等. 基于投入产出方法的甘肃省水足迹及虚拟水贸易研究[J]. 生态学报, 2012,32(20):6481-6488.
[
|
| [20] |
王艳阳, 王会肖, 张昕 . 基于投入产出表的中国水足迹走势分析[J]. 生态学报, 2013,33(11):3488-3498.
[
|
| [21] |
王晓萌, 黄凯, 杨顺顺 , 等. 中国产业部门水足迹演变及其影响因素分析[J]. 自然资源学报, 2014,29(12):2114-2126.
[
|
| [22] |
吴兆丹, 王张琪,
[
|
| [23] |
吴兆丹, 赵敏, 田泽 , 等. 多区域投入产出分析下中国水足迹地区间比较: 基于 “总量-相关指标-结构” 分析框架[J]. 自然资源学报, 2017,32(1):76-87.
[
|
| [24] |
郑翔益, 孙思奥, 鲍超 . 中国城乡居民食物消费水足迹变化及影响因素[J]. 干旱区资源与环境, 2019,33(1):17-22.
[
|
| [25] |
曾静静, 张志强, 曲建升 , 等. 家庭碳排放计算方法分析评价[J]. 地理科学进展, 2012,31(10):1341-1352.
[
|
| [26] |
秦耀辰, 李旭, 荣培君 . 基于改进EiO-LCA模型的城市旅游业碳排放核算研究: 以开封市为例[J]. 地理科学进展, 2015,34(2):132-140.
[
|
| [27] |
刘莉娜, 曲建升, 黄雨生 , 等. 中国居民生活碳排放的区域差异及影响因素分析[J]. 自然资源学报, 2016,31(8):1364-1377.
[
|
| [28] |
张红丽, 沈镭, 李艳梅 . 京津冀经济活动隐含的碳排放转移: 基于多区域投入产出模型的分析[J]. 资源科学, 2017,39(12):2287-2298.
[
|
| [29] |
李富佳 . 区域贸易隐含碳排放转移研究进展与展望[J]. 地理科学进展, 2018,37(10):1303-1313.
[
|
| [30] |
赵忠秀, 闫云凤, 裴建锁 . 生产分割、区域间贸易与CO2排放: 基于IRIO模型的研究[J]. 管理评论, 2018,30(5):47-57.
[
|
| [31] |
韩琴, 孙才志, 邹玮 . 1998—2012年中国省际灰水足迹效率测度与驱动模式分析[J]. 资源科学, 2016,38(6):1179-1191.
[
|
| [32] |
李丽莉, 肖洪浪, 邹松兵 , 等. 甘肃省产业部门用水结构及其效率分析[J]. 兰州大学学报(自然科学版), 2014,50(4):501-507.
[
|
| [33] |
|
| [34] |
|
| [35] |
马忠, 张继良 . 张掖市虚拟水投入产出分析[J]. 统计研究, 2008,25(5):65-70.
[
|
| [36] |
张亚雄, 齐舒畅 . 2002、2007年中国区域间投入产出表 [M]. 北京: 中国统计出版社, 2012.
[
|
| [37] |
刘卫东, 唐志鹏, 韩梦瑶 , 等. 2012年中国31省区市区域间投入产出表 [M]. 北京: 中国统计出版社, 2018.
[
|
| [38] |
刘雅婷, 王塞鸽, 陈彬 . 基于投入产出分析的北京市虚拟水核算[J]. 生态学报, 2018,38(6):1930-1940.
[
|
/
| 〈 |
|
〉 |