
基于文化产业企业网络视角的中国城市网络空间结构研究
|
张旭(1986— ),男,河南驻马店人,讲师,主要从事城市网络、城市空间结构、文化创意产业等方面的研究。E-mail: x. zhang86@hotmail.com |
收稿日期: 2019-01-21
要求修回日期: 2019-05-30
网络出版日期: 2020-03-28
基金资助
国家自然科学基金项目(41601163)
版权
Spatial structure of urban networks in China based on the perspective of cultural industry enterprise networks
Received date: 2019-01-21
Request revised date: 2019-05-30
Online published: 2020-03-28
Supported by
National Natural Science Foundation of China(41601163)
Copyright
论文通过对230家“新三板”文化产业挂牌企业总部—分支机构关联数据的收集、整理和分析,对文化产业视角下中国城市网络的空间结构特征进行研究,比较文化产业城市网络与其他类型城市网络的差异性,并探索影响文化产业城市网络空间格局的经济社会因素。结果表明:① 中国文化产业挂牌企业地理分布呈现出地域分散但数量集中的特点,城市网络空间分布高度不均衡,并未表现出常见的“菱形结构”;② 网络核心节点以东中部发达城市以及少数具有特殊资源的城市为主,多数城市的对外输出能力有限;③ 城市网络扩散以核心节点城市间的等级扩散为主,邻近城市间的扩散效应不明显,同时本地网络(即城市内部网络)对文化企业组织结构的贡献度低于跨地域网络;④ 不同类型文化产业在网络结构上表现出较为明显的差异,反映其市场需求和发展条件的不同;⑤ 地方政府作用和城市产业结构是影响中国文化产业企业布局和网络格局形成的重要因素,其他社会经济因素的作用则较为不明显,反映出中国文化产业的独特性。
张旭 , 余方正 , 徐良佳 . 基于文化产业企业网络视角的中国城市网络空间结构研究[J]. 地理科学进展, 2020 , 39(1) : 78 -90 . DOI: 10.18306/dlkxjz.2020.01.008
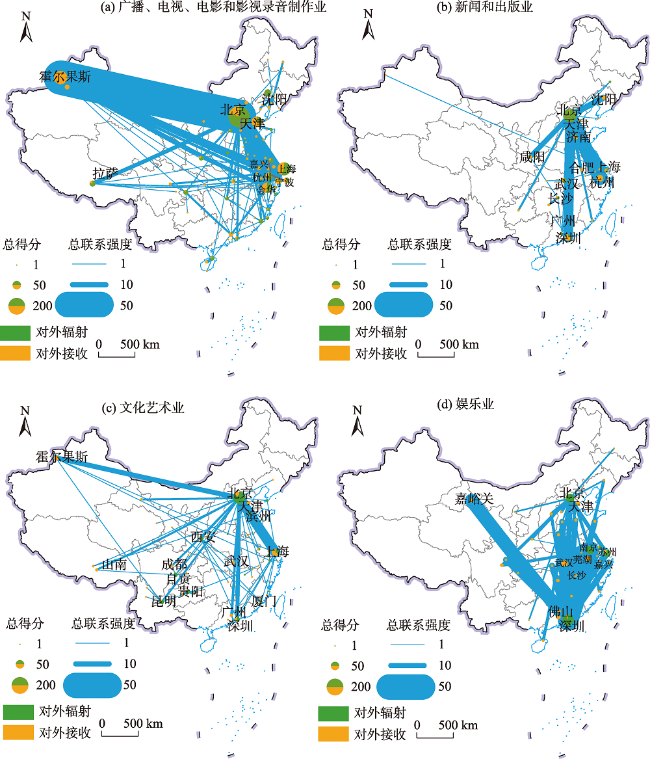
In recent years, urban networks have become a focus of research in geography, urban studies, and other related disciplines. While previous research has examined the urban networks in China from different perspectives, the networks generated by cultural industries have remained a largely unexplored area. This article aims to fill this gap by presenting a comprehensive analysis of the spatial structures of the cultural industry-generated urban networks in China's mainland and compares the disparities between these networks and the urban networks created by other types of economic activities. Data of the headquarter-affiliation connections of 230 NEEQ (National Equities Exchange and Quotations)-listed cultural firms in 2017 were collected and analyzed using social network analysis method. In addition, the article also explores the economic and social factors that shape the formation of the spatial patterns of China's cultural industry urban networks drawing on the method of multiple linear regression (MLR). The outcomes reveal that: First, shaped by both market mechanisms and the interventions of local governments, the distribution of the NEEQ-listed cultural firms demonstrates a geographically dispersive, but quantitatively concentrated pattern in China. The spatial structure of the cultural industry urban networks is highly uneven, with most inter-city connections concentrated in the eastern part of the country. The cultural industry urban networks do not exhibit the typical diamond-shaped structure that has been observed in many other urban networks in China. Second, the core nodes of the cultural industry urban networks are mainly economically advanced metropolises in the eastern and central areas, as well as a few minor cities that possess some special local assets, including large film and television studios, unque natural or humanistic environment, and preferential tax policies. Most cities are receivers instead of exporters of cultural industry functions. Third, the expansion of the cultural industry urban networks is mainly between the core nodes of different hierarchies instead of between geographically proximate cities. The contribution of local (intra-urban) networks to the formation of intra-firm relationships of cultural industries is weaker than that of trans-local networks, which indicates that, compared with the advantages of geographical proximity, the complementarity of market or resources is the primary factor considered by cultural firms during their expansion. Fourth, the urban networks of different subsets of cultural industries have rather diverse spatial structures, which reflect the varied market demands and development conditions of different cultural industry activities. Fifth, according to the outcome of MLR analysis, the function of local governments and urban industrial structure are two important factors that shape the location strategy of cultural firms and the pattern of cultural industry urban networks in China, whereas the impacts of other economic and social factors are not significant. The article enriches our understanding of the spatial organization of cultural industries and the diversity of modern urban networks. It also sheds light on cultural industry development policies in the Chinese context.
Key words: cultural industries; urban network; firm network; industrial cluster; China
表1 新三板文化企业数量及行业分布Tab.1 The number and sector distribution of cultural industry firms listed on the National Equities Exchange and Quotations |
| 行业 | 企业总部 | 分支机构 | |||
|---|---|---|---|---|---|
| 数量 | 占比/% | 数量 | 占比/% | ||
| 广播、电视、电影和 影视录音制作业 | 130 | 56.5 | 485 | 51.4 | |
| 文化艺术业 | 53 | 23.0 | 166 | 17.6 | |
| 新闻和出版业 | 30 | 13.0 | 126 | 13.4 | |
| 娱乐业 | 17 | 7.4 | 166 | 17.6 | |
| 合计 | 230 | 100.0 | 943 | 100.0 | |
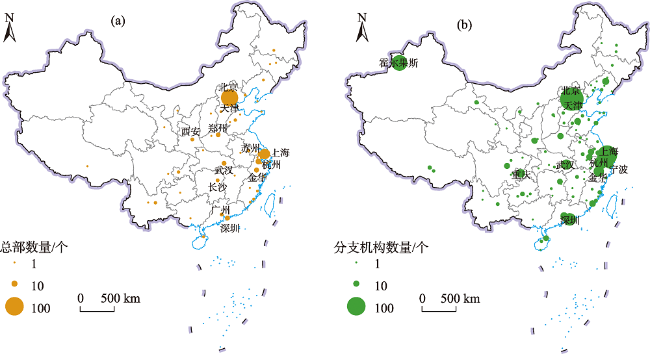
图1 新三板文化产业挂牌企业总部及分支机构分布注:本图基于自然资源部标准地图服务网站下载的审图号为GS(2019)1697号的标准地图制作,底图无修改,下同。圆的大小与城市总部/分支机构数量成正比;仅对排名前10的城市进行标注。 Fig.1 Distribution of the headquarters and affiliations of listed cultural industry firms |
表2 前12名城市企业总部及分支机构数量Tab.2 Top 12 cities with the largest concentration of headquarters and affiliations of cultural industry firms |
| 城市 | 总部数量 | 占比/% | 城市 | 分支机构数量 | 占比/% |
|---|---|---|---|---|---|
| 北京 | 86 | 37.4 | 北京 | 161 | 17.1 |
| 上海 | 31 | 13.5 | 上海 | 115 | 12.2 |
| 杭州 | 9 | 3.9 | 霍尔果斯 | 71 | 7.5 |
| 深圳 | 7 7 7 | 3.0 | 杭州 | 48 | 5.1 |
| 金华 | 3.0 | 深圳 | 45 | 4.8 | |
| 苏州 | 3.0 | 天津 | 45 | 4.8 | |
| 武汉 | 6 | 2.6 | 金华 | 31 | 3.3 |
| 郑州 | 6 | 2.6 | 武汉 | 30 | 3.2 |
| 天津 广州 西安 长沙 | 4 4 4 4 | 1.7 | 重庆 | 21 | 2.2 |
| 1.7 | 宁波 | 18 | 1.9 | ||
| 1.7 | 广州 | 15 | 1.6 | ||
| 1.7 | 沈阳 | 14 | 1.5 | ||
| 合计 | 175 | 75.8 | 合计 | 614 | 65.1 |
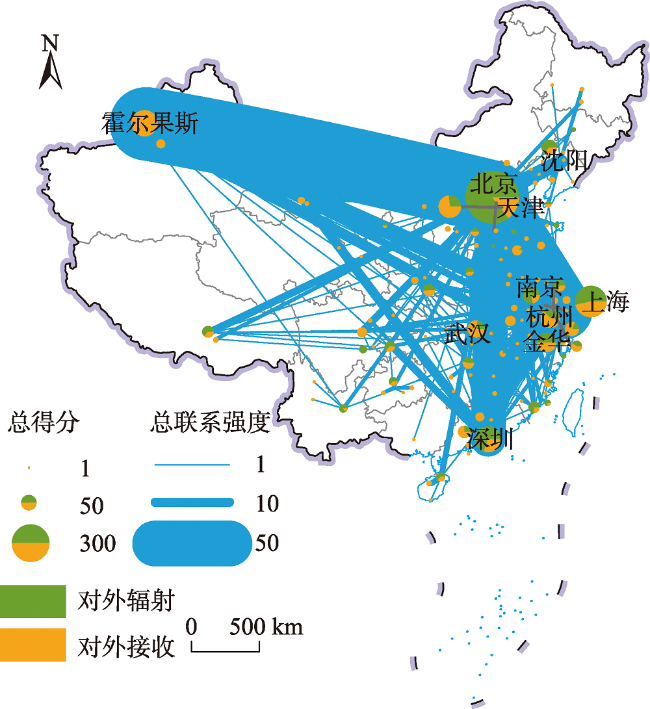
图2 城市外部功能得分及联系强度注:圆的大小与城市外部功能总得分成正比,仅对总得分排名前10的城市进行标注。 Fig.2 External function scores and connection strengths of all cities |
表3 前10名城市对外功能得分Tab.3 Top 10 cities with the highest external function scores |
| 城市 | 对外辐射功能得分 | 城市 | 对外接收功能得分 | 城市 | 对外功能净得分 |
|---|---|---|---|---|---|
| 北京 | 100.0 | 霍尔果斯 | 100.0 | 北京 | 100.0 |
| 上海 | 22.1 | 上海 | 67.6 | 深圳 | 13.3 |
| 深圳 | 19.4 | 北京 | 59.2 | 南京 | 8.1 |
| 南京 | 9.1 | 天津 | 53.5 | 上海 | 3.8 |
| 金华 | 7.9 | 杭州 | 35.2 | 沈阳 | 3.3 |
| 沈阳 | 6.3 | 武汉 | 32.4 | 厦门 | 3.3 |
| 杭州 | 5.9 | 深圳 | 29.6 | 苏州 | 2.8 |
| 天津 | 5.5 | 金华 | 26.8 | 自贡 | 2.8 |
| 厦门 | 4.0 | 宁波 | 23.9 | 昆明 | 2.4 |
| 苏州 | 4.0 | 广州 | 16.9 | 拉萨 | 1.9 |
注:所有城市得分均以排名首位城市的分值为标准进行了百分制处理。 |
表4 内部功能与对外辐射功能总得分前10名城市Tab.4 Top 10 cities with the highest gross scores of internal function and external radiation function |
| 城市 | 内部功能 | 对外辐射功能 得分 | 总得分 | |
|---|---|---|---|---|
| 得分 | 占比 | |||
| 北京 | 238 | 32 | 506 | 744 |
| 上海 | 134 | 54 | 112 | 246 |
| 深圳 | 48 | 33 | 98 | 146 |
| 杭州 | 46 | 61 | 30 | 76 |
| 金华 | 24 | 38 | 40 | 64 |
| 南京 | 10 | 18 | 46 | 56 |
| 重庆 | 34 | 71 | 14 | 48 |
| 天津 | 14 | 24 | 28 | 42 |
| 沈阳 | 10 | 33 | 32 | 42 |
| 苏州/厦门 | 18 | 47 | 20 | 38 |
| 所有城市 | 750 | 40 | 1136 | 1826 |
表5 文化产业城市网络空间结构影响因素回归分析结果Tab.5 Regression analysis results of the factors impacting the spatial pattern of cultural industry urban networks |
| 影响因子 | 指标 | 标准化回归系数 | |
|---|---|---|---|
| 城市网络功能总得分 | 城市总部与分支机构总数 | ||
| 经济发展水平(X1) | 人均地区生产总值 | -0.135 | -0.122 |
| 产业结构(X2) | 第三产业产值占GDP比重 | 0.203** | 0.178** |
| 地方政府作用(X3) | 地方财政支出 | 0.839** | 0.839** |
| 对外开放程度(X4) | 实际外商直接投资 | 0.138 | 0.139 |
| 人力资源水平(X5) | 每万人在校大学生数 | -0.096 | -0.089 |
| 地方消费水平(X6) | 社会消费品零售总额 | -0.147 | -0.093 |
| 基础设施状况(X7) | 人均公园绿地面积 | 0.083 | 0.048 |
注:**表示在1%的水平上显著。 |
| [1] |
|
| [2] |
|
| [3] |
|
| [4] |
|
| [5] |
汪明峰, 宁越敏 . 城市的网络优势: 中国互联网骨干网络结构与节点可达性分析[J]. 地理研究, 2006,25(2):193-203.
[
|
| [6] |
冷炳荣, 杨永春, 李英杰 , 等. 中国城市经济网络结构空间特征及其复杂性分析[J]. 地理学报, 2011,66(2):199-211.
[
|
| [7] |
汤放华, 汤慧, 孙倩 , 等. 长江中游城市集群经济网络结构分析[J]. 地理学报, 2013,68(10):1357-1366.
[
|
| [8] |
|
| [9] |
|
| [10] |
吴康, 方创琳, 赵渺希 . 中国城市网络的空间组织及其复杂性结构特征[J]. 地理研究, 2015,34(4):711-728.
[
|
| [11] |
|
| [12] |
金凤君 . 我国航空客流网络发展及其地域系统研究[J]. 地理研究, 2001,20(1):31-39.
[
|
| [13] |
|
| [14] |
陈伟, 刘卫东, 柯文前 , 等. 基于公路客流的中国城市网络结构与空间组织模式[J]. 地理学报, 2017,72(2):224-241.
[
|
| [15] |
王姣娥, 景悦 . 中国城市网络等级结构特征及组织模式: 基于铁路和航空流的比较[J]. 地理学报, 2017,72(8):1508-1519.
[
|
| [16] |
马学广, 唐承辉 . 中国城市网络化空间联系与格局: 基于高铁客运流的大数据分析[J]. 经济地理, 2018,38(4):55-64.
[
|
| [17] |
甄峰, 王波, 陈映雪 . 基于网络社会空间的中国城市网络特征: 以新浪微博为例[J]. 地理学报, 2012,67(8):1031-1043.
[
|
| [18] |
陈映雪, 甄峰, 王波 , 等. 基于社会网络分析的中国城市网络信息空间结构[J]. 经济地理, 2013,33(4):56-63.
[
|
| [19] |
|
| [20] |
|
| [21] |
|
| [22] |
|
| [23] |
马海涛 . 基于知识流动的中国城市网络研究进展与展望[J]. 经济地理, 2016,36(11):207-213.
[
|
| [24] |
马学广, 李贵才 . 西方城市网络研究进展和应用实践[J]. 国际城市规划, 2012,27(4):65-70.
[
|
| [25] |
盛科荣, 张红霞, 佀丹丹 . 基于企业网络视角的城市网络研究进展与展望[J]. 人文地理, 2018,33(2):11-17.
[
|
| [26] |
赵渺希, 刘铮 . 基于生产性服务业的中国城市网络研究[J]. 城市规划, 2012(9):23-28.
[
|
| [27] |
|
| [28] |
李仙德 . 基于上市公司网络的长三角城市网络空间结构研究[J]. 地理科学进展, 2014,33(12):1587-1600.
[
|
| [29] |
赵渺希, 魏冀明, 吴康 . 京津冀城市群的功能联系及其复杂网络演化[J]. 城市规划学刊, 2014(1):46-52.
[
|
| [30] |
|
| [31] |
|
| [32] |
|
| [33] |
马海涛, 方创琳 . 基于企业微观视角的城市区域生产网络空间组织研究: 以粤东城镇群服装生产为例[J]. 地理科学, 2011,31(10):1172-1180.
[
|
| [34] |
|
| [35] |
叶雅玲, 杨博飞, 何紫云 , 等. 中国城市网络空间结构研究: 基于 A 股上市医药公司网络[J]. 地理科学进展, 2018,37(8):1096-1105.
[
|
| [36] |
尹俊, 甄峰, 王春慧 . 基于金融企业布局的中国城市网络格局研究[J]. 经济地理, 2011,31(5):754-759.
[
|
| [37] |
|
| [38] |
马学广, 李鲁奇 . 中国城市网络化空间联系结构: 基于银行网点数据的研究[J]. 地理科学进展, 2017,36(4):393-403.
[
|
| [39] |
武前波, 宁越敏 . 中国城市空间网络分析: 基于电子信息企业生产网络视角[J]. 地理研究, 2012,31(2):207-219.
[
|
| [40] |
|
| [41] |
程玉鸿, 孟俊华 . 基于高端消费文化视角的中国城市中心性及其网络结构的实证分析[J]. 经济地理, 2014,34(2):28-34.
[
|
| [42] |
董琦, 甄峰 . 基于物流企业网络的中国城市网络空间结构特征研究[J]. 人文地理, 2013,28(4):71-76.
[
|
| [43] |
叶磊, 段学军 . 基于物流企业的长三角地区城市网络结构[J]. 地理科学进展, 2016,35(5):622-631.
[
|
| [44] |
曹前, 沈丽珍, 甄峰 . 中国互联网企业空间演化与城市网络特征研究[J]. 人文地理, 2018,33(5):97-105.
[
|
| [45] |
|
| [46] |
|
| [47] |
|
| [48] |
|
| [49] |
|
| [50] |
|
| [51] |
邱金龙, 潘爱玲, 张国珍 . 政府在文化产业发展中的角色解析: 定位与补位[J]. 经济问题探索, 2018(4):73-79.
[
|
| [52] |
|
| [53] |
刘洋 . 地方政府支持企业上市的鼓励政策分析[J]. 湖北工业大学学报, 2016,31(3):60-63.
[
|
| [54] |
素淡 . 霍尔果斯与中国影视圈[N]. 中国文化报, 2017 -03-21.
[
|
| [55] |
|
| [56] |
|
| [57] |
|
/
| 〈 |
|
〉 |