
个体与环境交互作用下中国成人超重肥胖情况变化趋势及影响因素研究
|
王依茹(1994— ),女,浙江温州人,研究方向为健康地理。E-mail: 1963704128@qq.com |
收稿日期: 2019-03-18
要求修回日期: 2019-12-18
网络出版日期: 2020-03-28
基金资助
国家自然科学基金项目(41871106)
国家自然科学基金项目(41471101)
版权
Study on the trend and influencing factors of overweight and obesity in Chinese adults under interactions of individual and environment
Received date: 2019-03-18
Request revised date: 2019-12-18
Online published: 2020-03-28
Supported by
National Natural Science Foundation of China(41871106)
National Natural Science Foundation of China(41471101)
Copyright
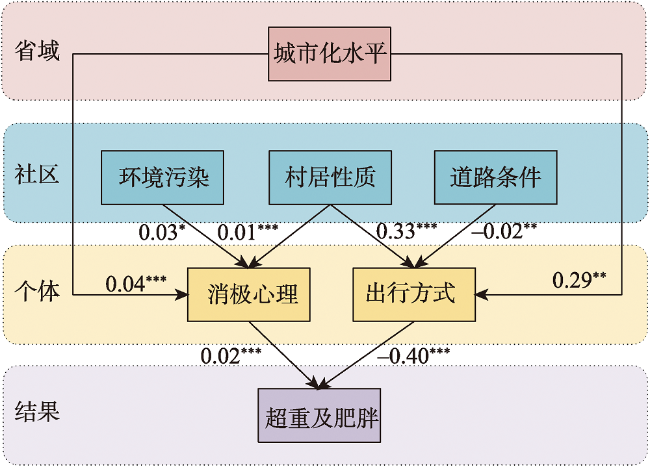
论文基于中国25个省份内635个社区的29586个成年居民2010—2016年的纵向追踪调查数据,分别利用非线性发展模型和多层Logistic回归模型,阐释中国居民超重肥胖情况的变化趋势,同时探究其在个体与环境交互作用下的影响机制。研究发现:① 以身体质量指数衡量的中国成人超重肥胖发生风险逐年增加,其中女性、年龄、有配偶人群、日均锻炼时长负向作用于成人身体质量指数增长速率;② 中国成人超重肥胖差异具有多层级性,个体层面社会经济属性、饮食习惯和行为方式,社区层面建成环境和自然环境,省域层面城市化水平,均能影响成人超重肥胖发生;③ 不同层级间超重肥胖影响因子具有交互作用关系,环境能通过影响个体心理状态及行为选择对个体健康结果的作用,间接作用于居民超重肥胖结果。研究结果旨在帮助中国成人居民达到更好的健康状态,以及为相关政府部门制定促进人口健康的政策提供理论依据。
王依茹 , 王琛 , 曾金迪 . 个体与环境交互作用下中国成人超重肥胖情况变化趋势及影响因素研究[J]. 地理科学进展, 2020 , 39(1) : 100 -110 . DOI: 10.18306/dlkxjz.2020.01.010
In recent years, with the rapid development of socio-economy and acceleration of urbanization, China has entered the stage of a health transition, which means a shift to low fiber, high sugar and cholesterol diet, as well as a sedentary lifestyle. During the health transition, Chinese residents are facing severe obesity and the problems caused by metabolic system-related diseases. So it is significantly important to find the factors which influencing the physical health of Chinese residents during the special period. This study is based on longitudinal tracking survey data of 29586 adult residents from 635 communities in 25 provinces across the country from 2010 to 2016, using non-linear development models and multi-level logistic regression models to explain the trends of overweight or obesity in Chinese residents, and explore the mechanism under the interaction of individuals and the environment. The results show that the risk of overweight and obesity in Chinese adults measured by body mass index increased year by year, in which women, age, spouses, and average daily exercise time negatively affect the growth rate of Chinese body mass index. Moreover, the differences in overweight and obesity among Chinese adults are multilayered. Socioeconomic attributes, dietary habits, and behavioral patterns at the individual level, the built environment and natural environment at the community level, and the level of urbanization at the provincial level can all affect the occurrence of overweight and obesity in China. Finally, the influence factors of overweight and obesity between different levels have an interactive relationship, and the environment can indirectly affect the residents' overweight and obesity results by affecting the individual's psychological state and behavior choices. The purpose of this research is to help residents achieve better health and to provide theoretical basis for government agencies to formulate policies to promote population health.
Key words: adult; urbanization; overweight or obesity; multilevel model; Chinese family; panel studies
表1 变量的描述性统计Tab.1 Descriptive statistics of variables |
| 影响因素 | 描述 | 最小值 | 最大值 | 平均值 |
|---|---|---|---|---|
| 个体层面 | ||||
| 性别 | 男=1;女=0 | 0 | 1 | 0.48 |
| 年龄 | 2010年个体年龄(岁) | 16 | 110 | 45.51 |
| 教育年限 | 2010年个体接受教育年限(a) | 0 | 22 | 7 |
| 城乡属性 | 城镇=1;乡村=0 | 0 | 1 | 0.46 |
| 工作性质 | 没有工作=0;农业工作=1;非农工作=2 | 0 | 2 | 0.76 |
| 有无配偶 | 有配偶=1;无配偶=0 | 0 | 1 | 0.8 |
| 是否吸烟 | 吸烟=1;不吸烟=0 | 0 | 1 | 0.3 |
| 是否酗酒 | 一周饮酒3次以上=1;一周饮酒未超过3次=0 | 0 | 1 | 0.16 |
| 出行方式 | 步行或自行车=1;其他=0 | 0 | 1 | 0.71 |
| 有无确诊慢性病 | 近半年有确诊慢性病=1;无确诊慢性病=0 | 0 | 1 | 0.15 |
| 抑郁得分 | 家庭追踪调查综合指标,用以衡量成人抑郁程度 | 6 | 30 | 26.93 |
| 工作日睡眠时间 | 工作日均睡眠时间(h) | 0 | 20 | 8.1 |
| 工作日锻炼时间 | 工作日均锻炼健身时间(h) | 0 | 8 | 0.27 |
| 工作日吃饭时间 | 工作日均用餐及其他饮食活动时间(h) | 0 | 10 | 1.46 |
| 工作日看电视时间 | 工作日均观看电视包括其他音频设备时间(h) | 0 | 16 | 1.66 |
| 休息日睡眠时间 | 节假日均睡眠时间(h) | 0 | 20 | 8.49 |
| 休息日锻炼时间 | 节假日均锻炼健身时间(h) | 0 | 15 | 0.3 |
| 休息日吃饭时间 | 节假日均用餐及其他饮食活动时间(h) | 0 | 10 | 1.49 |
| 休息日看电视时间 | 节假日均观看电视包括其他音频设备时间(h) | 0 | 16 | 2.03 |
| 肉类频次 | 最近一个月每周食用肉类次数(次) | 0 | 43 | 3.94 |
| 奶制频次 | 最近一个月每周食用奶制品次数(次) | 0 | 45 | 1.31 |
| 豆制频次 | 最近一个月每周食用豆制品次数(次) | 0 | 34 | 2.02 |
| 蛋类频次 | 最近一个月每周食用蛋类次数(次) | 0 | 43 | 3.05 |
| 油炸食物频次 | 最近一个月每周食用膨化/油炸食品次数(次) | 0 | 21 | 0.53 |
| 腌制食物频次 | 最近一个月每周食用腌制食品的次数(次) | 0 | 50 | 2.35 |
| 社区层面 | ||||
| 社区属性 | 居委会=1;村委会=0 | 0 | 1 | 0.35 |
| 环境污染 | 方圆5 km内是否有化工厂、造纸厂等高污染企业 | 0 | 1 | 0.21 |
| 道路条件 | 社区内土路占比(%) | 0 | 100 | 41.22 |
| 省域层面 | ||||
| 人口城市化率 | 城镇人口占常住人口的百分比(%) | 34 | 89 | 53 |
表2 旋转后的因子载荷矩阵Tab.2 Rotated component matrix |
| 个体层面变量 | 因子1 | 因子2 | 因子3 | 因子4 | 因子5 | 因子6 |
|---|---|---|---|---|---|---|
| 工作日吃饭时间 | 0.957 | |||||
| 节假日吃饭时间 | 0.955 | |||||
| 工作日锻炼时间 | 0.942 | |||||
| 节假日锻炼时间 | 0.939 | |||||
| 工作日看电视时间 | 0.934 | |||||
| 节假日看电视时间 | 0.931 | |||||
| 工作日睡眠时间 | 0.930 | |||||
| 节假日睡眠时间 | 0.930 | |||||
| 食用肉类频次 | 0.670 | |||||
| 食用奶制品频次 | 0.650 | |||||
| 食用豆制品频次 | 0.650 | |||||
| 食用蛋类频次 | 0.650 | |||||
| 食用油炸食品频次 | 0.480 | |||||
| 食用腌制食品频次 | 0.931 |
表3 2010—2016年全国居民超重率和肥胖率Tab.3 Overweight and obesity rates of residents in China from 2010 to 2016 (%) |
| 年份 | 超重BMI≥24 | 肥胖BMI≥28 |
|---|---|---|
| 2010 | 27.8 | 5.4 |
| 2012 | 29.6 | 6.1 |
| 2014 | 32.4 | 6.8 |
| 2016 | 33.5 | 7.0 |
表4 发展模型结果Tab.4 Development model results |
| 参数 | 空模型 | 线性发展模型 | 非线性发展模型 | |||||
|---|---|---|---|---|---|---|---|---|
| 估计值 | 标准误 | 估计值 | 标准误 | 估计值 | 标准误 | |||
| 第一层 | ||||||||
| 身体质量指数 | 22.719*** | 0.018 | 22.454*** | 0.019 | 22.430*** | 0.019 | ||
| 时间编码 | 0.177*** | 0.004 | 0.247*** | 0.013 | ||||
| 时间编码的平方 | -0.023*** | 0.004 | ||||||
| 随机部分ε | 2.124 | 1.458 | 2.072 | 1.440 | 2.071 | 1.439 | ||
| 第二层 | ||||||||
| 随机部分γ | 9.185 | 3.031 | 9.198 | 3.033 | 9.198 | 3.033 | ||
| 偏差度 | 508029 | 505839 | 505815 | |||||
注:***、**、*分别表示在0.01、0.05、0.1水平上显著。下同。 |
表5 完整非线性发展模型结果Tab.5 Full nonlinear development model results |
| 第一层 | |||||
|---|---|---|---|---|---|
| 估计值 | 标准误 | ||||
| 身体质量指数 | 19.259*** | 0.158 | |||
| 时间编码 | 0.679*** | 0.037 | |||
| 时间编码的平方 | -0.023*** | 0.004 | |||
| 第二层 | |||||
| 第一层截距 | 第一层增长斜率 | ||||
| 估计值 | 标准误 | 估计值 | 标准误 | ||
| 城乡属性 | 0.499*** | 0.042 | -0.007 | 0.009 | |
| 性别 | 0.518*** | 0.049 | 0.033** | 0.011 | |
| 年龄 | 0.020*** | 0.002 | -0.008*** | 0.000 | |
| 是否有配偶 | 1.203*** | 0.054 | -0.051*** | 0.012 | |
| 教育年限 | 0.012** | 0.005 | 0.001 | 0.001 | |
| 是否有确诊慢性病 | 0.310*** | 0.054 | -0.013 | 0.012 | |
| 是否抽烟 | -0.368*** | 0.050 | -0.018 | 0.011 | |
| 是否酗酒 | 0.120** | 0.053 | -0.024 | 0.012 | |
| 抑郁得分 | 0.040*** | 0.005 | -0.002 | 0.001 | |
| 出行方式 | -0.507*** | 0.041 | 0.005 | 0.009 | |
| 没有工作 | |||||
| 农业工作 | -0.064 | 0.047 | 0.027** | 0.011 | |
| 非农工作 | 0.342*** | 0.048 | -0.006 | 0.011 | |
| 日均吃饭时间 | -0.022 | 0.018 | 0.008* | 0.004 | |
| 日均锻炼时间 | 0.244*** | 0.021 | -0.018*** | 0.005 | |
| 食用易胖食品频次 | -0.024 | 0.020 | -0.007 | 0.005 | |
| 日均看电视时间 | 0.203*** | 0.019 | -0.004 | 0.004 | |
| 日均睡眠时间 | -0.081*** | 0.019 | 0.002 | 0.004 | |
| 食用不健康食品频次 | 0.159*** | 0.018 | 0.003 | 0.004 | |
| 偏差度 | 502025 | ||||
表6 完整Logistic回归模型结果Tab.6 Complete Logistic Regression Model Results |
| 空模型 | 模型1 | 模型2 | 模型3 | 模型4 | 模型5 | |||||||
|---|---|---|---|---|---|---|---|---|---|---|---|---|
| 估计值 | 标准误 | 估计值 | 标准误 | 估计值 | 标准误 | 估计值 | 标准误 | 估计值 | 标准误 | 估计值 | 标准误 | |
| 个体层面 | ||||||||||||
| 城乡属性 | 0.444*** | 0.065 | 0.386*** | 0.058 | 0.281*** | 0.053 | 0.440*** | 0.063 | 0.276*** | 0.053 | ||
| 性别 | 0.276*** | 0.041 | 0.236*** | 0.047 | 0.275*** | 0.042 | 0.275*** | 0.041 | 0.245*** | 0.047 | ||
| 年龄 | 0.013*** | 0.002 | 0.013*** | 0.002 | 0.013*** | 0.002 | 0.013*** | 0.002 | 0.013*** | 0.002 | ||
| 是否有配偶 | 0.686*** | 0.048 | 0.674*** | 0.045 | 0.687*** | 0.048 | 0.684*** | 0.047 | 0.691*** | 0.046 | ||
| 是否有确诊慢性病 | 0.205*** | 0.044 | 0.223*** | 0.046 | 0.204*** | 0.044 | 0.204*** | 0.045 | 0.229*** | 0.047 | ||
| 是否吸烟 | -0.224*** | 0.034 | -0.237*** | 0.033 | -0.221*** | 0.034 | -0.223*** | 0.035 | -0.243*** | 0.033 | ||
| 是否酗酒 | 0.125** | 0.041 | 0.106** | 0.038 | 0.126** | 0.041 | 0.125** | 0.041 | 0.111** | 0.039 | ||
| 抑郁得分 | 0.015*** | 0.004 | 0.016*** | 0.004 | ||||||||
| 出行方式 | -0.222*** | 0.036 | -0.230*** | 0.036 | ||||||||
| 吃饭时间 | -0.051* | 0.016 | -0.048** | 0.015 | ||||||||
| 锻炼时间 | 0.073*** | 0.018 | 0.070*** | 0.017 | ||||||||
| 食用易胖食品频次 | 0.021 | 0.021 | 0.016 | 0.021 | ||||||||
| 看电视时间 | 0.103*** | 0.018 | 0.104*** | 0.017 | ||||||||
| 睡眠时间 | -0.034** | 0.017 | -0.032** | 0.016 | ||||||||
| 食用不健康食品频次 | 0.050** | 0.019 | 0.053** | 0.020 | ||||||||
| 社区层面 | ||||||||||||
| 社区性质 | 0.138** | 0.053 | 0.114** | 0.055 | ||||||||
| 环境污染 | 0.049* | 0.031 | 0.048* | 0.032 | ||||||||
| 道路条件 | -0.002** | 0.001 | -0.002* | 0.001 | ||||||||
| 省级层面 | ||||||||||||
| 城市化水平 | 1.064** | 0.368 | 0.725* | 0.381 | ||||||||
| 偏差度 | 85600 | 84415 | 83813 | 84390 | 84410 | 82597 | ||||||
| [1] |
|
| [2] |
|
| [3] |
|
| [4] |
|
| [5] |
于晓薇, 胡宏伟, 吴振华 , 等. 我国城市居民健康状况及影响因素研究[J]. 中国人口·资源与环境, 2010,20(2):151-156.
[
|
| [6] |
孙斌栋, 阎宏, 张婷麟 . 社区建成环境对健康的影响: 基于居民个体超重的实证研究[J]. 地理学报, 2016,71(10):1721-1730.
[
|
| [7] |
张延吉, 秦波, 唐杰 . 基于倾向值匹配法的城市建成环境对居民生理健康的影响[J]. 地理学报, 2018,73(2):333-345.
[
|
| [8] |
|
| [9] |
|
| [10] |
|
| [11] |
|
| [12] |
|
| [13] |
|
| [14] |
杨振, 丁启燕, 王念 , 等. 中国人口健康脆弱性地区差异与影响因素分析[J]. 地理科学, 2018,38(1):135-142.
[
|
| [15] |
王晓蕾, 王惠君, 苏畅 . 中国九省城市化水平对儿童青少年超重肥胖影响的多水平研究[J]. 卫生研究, 2016,45(6):888-896.
[
|
| [16] |
|
| [17] |
顾丽娟,
[
|
| [18] |
|
| [19] |
马静, 柴彦威, 符婷婷 . 居民时空行为与环境污染暴露对健康影响的研究进展[J]. 地理科学进展, 2017,36(10):1260-1269.
[
|
| [20] |
|
| [21] |
|
| [22] |
李红娟, 杨柳, 张楠 . 身体质量指数作为肥胖筛查标准的判别准确性评价[J]. 中国预防医学杂志, 2014,15(6):571-575.
[
|
| [23] |
中国肥胖问题工作组数据汇总分析协作组. 我国成人体重指数和腰围对相关疾病危险因素异常的预测价值:适宜体重指数和腰围切点的研究[J]. 中华流行病学杂志, 2002,23(1):5-10.
[ Coorperative Meta-analysis Group of China Obesity Task Force. Predictive values of body mass index and waist circumference to risk factors of related diseases in Chinese adult population. Chinese Journal of Epidemiology, 2002,23(1):5-10. ]
|
| [24] |
盖笑松, 张向葵 . 多层线性模型在纵向研究中的运用[J]. 心理科学, 2005(2):429-431.
[
|
| [25] |
|
| [26] |
|
| [27] |
周洁, 柴彦威 . 中国老年人空间行为研究进展[J]. 地理科学进展, 2013,32(5):722-732.
[
|
| [28] |
敖荣军, 李浩慈, 杨振 , 等. 老年人口健康的空间分异及影响因素研究: 以湖北省为例[J]. 地理科学进展, 2017,36(10):1218-1228.
[
|
| [29] |
|
| [30] |
鲁斐栋, 谭少华 . 建成环境对体力活动的影响研究: 进展与思考[J]. 国际城市规划, 2015,30(2):62-70.
[
|
| [31] |
|
| [32] |
|
| [33] |
|
/
| 〈 |
|
〉 |