
1986—2017年呼伦湖湖冰物候特征变化
|
吴其慧(1992— ),男,内蒙古包头人,硕士生,主要从事从事于湖冰遥感及湖泊水质的研究。E-mail: WQHeart@126.com |
收稿日期: 2018-08-27
要求修回日期: 2019-06-06
网络出版日期: 2019-12-28
基金资助
国家自然科学基金项目(51869020)
国家自然科学基金项目(51779118)
内蒙古自然科学基金项目(2017BS0510)
版权
Change of ice phenology in the Hulun Lake from 1986 to 2017
Received date: 2018-08-27
Request revised date: 2019-06-06
Online published: 2019-12-28
Supported by
National Natural Science Foundation of China(51869020)
National Natural Science Foundation of China(51779118)
Natural Science Foundation of Neimenggu Province(2017BS0510)
Copyright
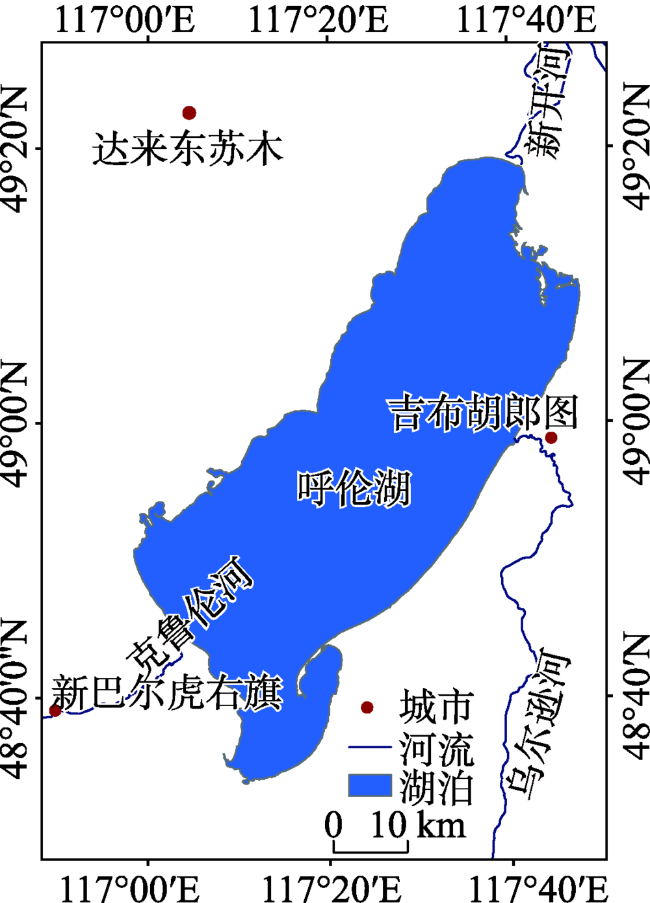
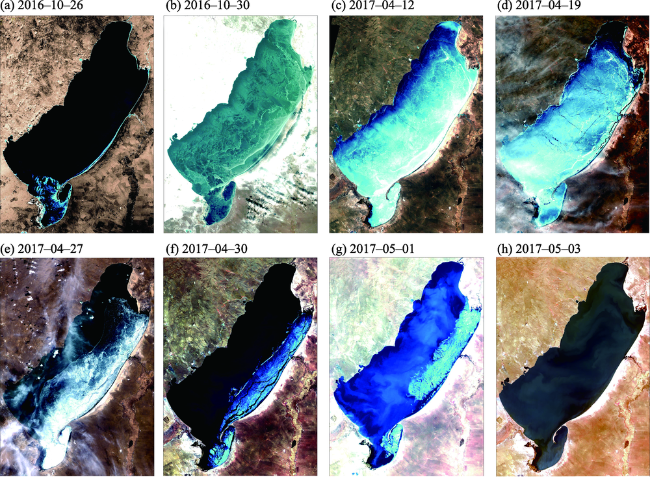
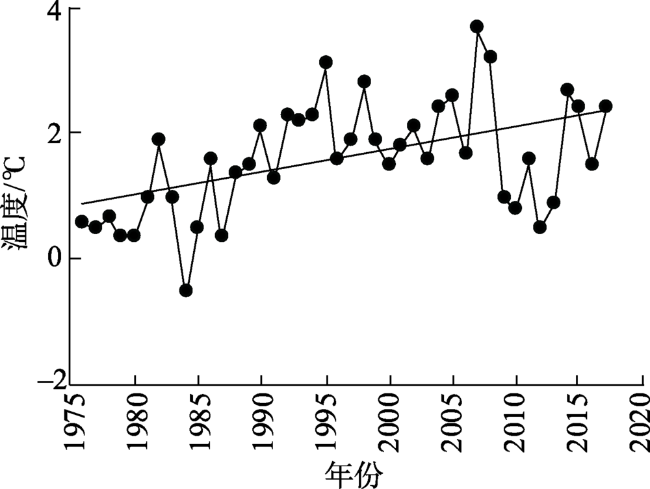
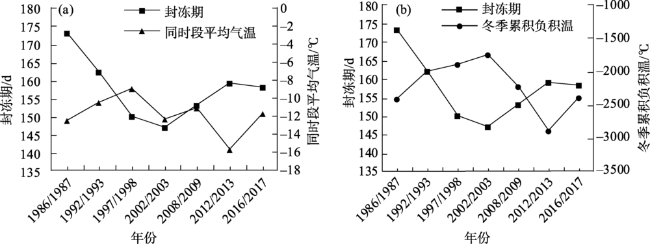
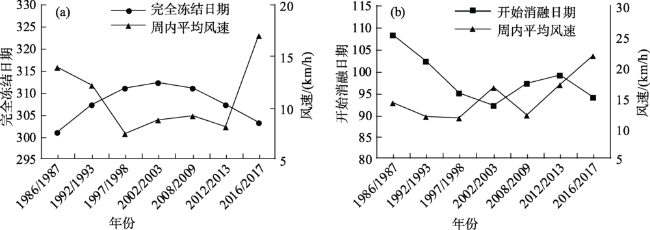
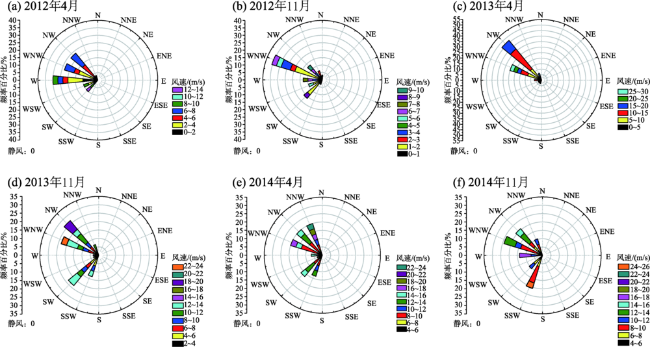
湖冰冰情物候特征是气候变化的敏感指示器之一。论文以呼伦湖为研究对象,基于MODIS、Landsat、GF-1、HJ-1等多源遥感影像及气象数据,利用RS和GIS技术综合分析了1986—2017年呼伦湖冰情物候特征及其对区域气候的响应。结果表明:① 呼伦湖年均开始冻结时间在10月下旬至11月上旬,从结冰开始到完全封冻的时间平均只有6.4 d;开始融冰时间在次年的4月上旬,消融期平均为32 d左右,到5月初或5月上旬湖冰完全融化。② 1986—2017年,在整个研究期呼伦湖完全封冻期呈现显著缩短趋势,平均缩短18.5 d;完全结冰时间有一定延迟现象,平均延后8.4 d;冰全部融化时间呈现提前趋势,平均提前了11.2 d。③ 湖冰冻结消融空间特征表现不同,冻结时先从湖岸形态较复杂地区结冰,然后由东岸向西岸迅速封冻,消融时先从湖泊西北岸开始,逐渐向东岸融化。④ 在影响因素方面,呼伦湖冰情特征主要受到区域气温、风速、风向等因素的影响。
吴其慧 , 李畅游 , 孙标 , 史小红 , 赵胜男 , 韩知明 . 1986—2017年呼伦湖湖冰物候特征变化[J]. 地理科学进展, 2019 , 38(12) : 1933 -1943 . DOI: 10.18306/dlkxjz.2019.12.009
Lake ice phenology is a sensitive indicator of climate change. This study examined lake ice phenology of the Hulun Lake in Inner Mongolia, China based on multi-source remote sensing imageries including MODIS, Landsat, GF-1, and HJ-1 and meteorological data. We used GIS technology to comprehensively analyze the phenological characteristics of ice in the Hulun Lake and its response to regional climate from 1986 to 2017. The results show that: 1) The average freezing time of the Hulun Lake began in late October to early November, and the average time from freezing to complete freezing was 6.4 days. The melting start was usually in early April of the following year, and the ablation period averaged about 32 days. At the beginning of early May, the lake ice completely melted. 2) From 1986 to 2017, the complete freezing period of the Hulun Lake showed a significant shortening trend, with an average shortening of 18.5 days. The complete freezing time showed some delay, with an average delay of 8.4 days. The complete ice melting time advanced, with an average advancement of 11.2 days. 3) The spatial characteristics of freezing and melting of lake ice are different. Freezing starts from the complex shoreline areas of the lake, then rapidly propagate from the east coast to the west coast, but melting starts from the northwest coast of the lake and gradually spread toward the east shore. 4) The characteristics of ice conditions in the Hulun Lake are mainly affected by regional air temperature, wind speed, wind direction, among other factors.
表1 遥感数据统计Tab.1 Remote sensing data used in the study |
| 遥感卫星 | 传感器 | 轨道号 | 空间分辨率/m | 回归周期/d | 过境时间 | 波段数 | 使用景数 |
|---|---|---|---|---|---|---|---|
| Landsat | TM/ETM+/OLI | 124/26 | 30 | 16 | 7~11 | 91 | |
| TERRA/AQUA | MODIS | h25v04 | 250 | 1 | 10:30 am, 1:30 pm | 2 | 33 |
| GF-1 | WFV | 4/72 | 16 | 2 | 10:30 am | 4 | 6 |
| HJ-1A/B | CCD | 9/52 | 30 | 4 | 10:30 am ±30 min | 4 | 45 |
表2 1986—2017年呼伦湖湖冰时间统计Tab.2 Duration of lake ice cover at the Hulun Lake, 1986-2017 |
| 时间 | 初冰日 | 完全冻结日 | 开始消融日 | 完全消融日 | 湖冰完全封冻期/d | 湖冰存在期/d | 湖冰冻结期/d | 湖冰消融期/d |
|---|---|---|---|---|---|---|---|---|
| 1986/1987年 | 297 | 301 | 108(+2) | 140(+2) | 173 | 209 | 5 | 32 |
| 1992/1993年 | 304(-1) | 307 | 102(-1) | 127(+1) | 162 | 190 | 4 | 26 |
| 1997/1998年 | 300(-1) | 311(-1) | 95(-1) | 122 | 150 | 188 | 11 | 28 |
| 2002/2003年 | 299(+1) | 312(+1) | 92 | 136 | 147 | 203 | 12 | 45 |
| 2005/2006年 | 303 | 308(+1) | 94(+1) | 132 | 152 | 195 | 6 | 39 |
| 2008/2009年 | 305 | 311 | 97 | 129 | 153 | 191 | 7 | 33 |
| 2010/2011年 | 287 | 309 | 99(-1) | 127 | 156 | 206 | 23 | 29 |
| 2011/2012年 | 308 | 316(-1) | 96 | 132 | 147 | 190 | 9 | 36 |
| 2012/2013年 | 303 | 307 | 99(+2) | 137(+1) | 159 | 201 | 5 | 38 |
| 2013/2014年 | 310(-1) | 318 | 95 | 124 | 143 | 180 | 9 | 30 |
| 2014/2015年 | 308 | 309(+1) | 98 | 125 | 155 | 183 | 2 | 28 |
| 2015/2016年 | 307 | 310 | 96 | 123 | 153 | 183 | 4 | 28 |
| 2016/2017年 | 300(+1) | 303 | 94(+1) | 120(-2) | 158 | 187 | 3 | 29 |
| 平均 | 302.3 | 309.4 | 97.3 | 128.8 | 154.5 | 192.8 | 6.4 | 32.2 |
| 阶段平均变幅/d | +0.3 | +0.2 | -1.2 | -1.7 | -0.9 | -2.3 | -0.1 | -0.5 |
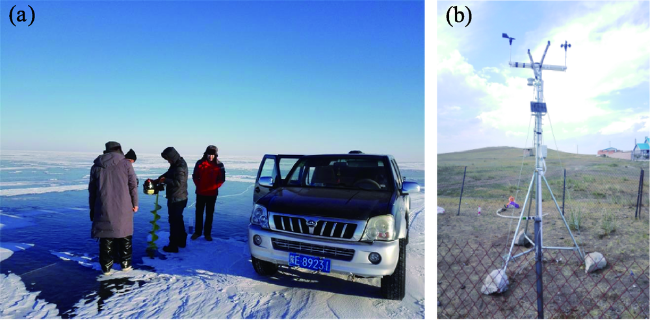
注:误差日期用括号内数字表示,负数代表误差为提前,正数代表误差为延后,以年积日计。误差的主要来源包括:一是实地观测时由于湖泊面积较大,目视范围有限,对于湖泊是否完全冻结或消融有一定的误差;二是卫星影像由于部分年份数据缺失及某些影像因为质量问题导致识别和解译出现误差。 |
| [1] |
白照广 . 2013. 高分一号卫星的技术特点[J]. 中国航天, ( 8):5-9.
[
|
| [2] |
车涛, 李新, 晋锐 . 2009. 利用被动微波遥感低频亮温数据监测青海湖封冻与解冻期[J]. 科学通报, 54(6):787-791.
[
|
| [3] |
勾鹏, 叶庆华, 魏秋方 . 2015. 2000—2013年西藏纳木错湖冰变化及其影响因素[J]. 地理科学进展, 34(10):1241-1249.
[
|
| [4] |
韩知明, 贾克力, 赵胜男 , 等. 2017. 呼伦湖冰封期与非冰封期营养盐与离子分布特征研究[J]. 生态环境学报, 26(7):1201-1209.
[
|
| [5] |
祁苗苗, 姚晓军, 李晓锋 , 等. 2018. 2000—2016年青海湖湖冰物候特征变化[J]. 地理学报, 73(5):932-944.
[
|
| [6] |
秦大河 . 2012. 中国气候与环境演变: 2012综合卷 [M]. 北京: 气象出版社.
[
|
| [7] |
曲斌, 康世昌, 陈锋 , 等. 2012. 2006—2011年西藏纳木错湖冰状况及其影响因素分析[J]. 气候变化研究进展, 8(5):327-333.
[
|
| [8] |
孙标 . 2010. 基于空间信息技术的呼伦湖水量动态演化研究[D]. 呼和浩特: 内蒙古农业大学.
[
|
| [9] |
陶安琪 . 2014. 被动微波遥感纳木错湖冰变化研究[D]. 南京: 南京大学.
[
|
| [10] |
汪敬忠, 吴敬禄, 曾海鳌 , 等. 2015. 内蒙古主要湖泊水资源及其变化分析[J]. 干旱区研究, 32(1):7-14.
[
|
| [11] |
王桥, 吴传庆, 厉青 . 2010. 环境一号卫星及其在环境监测中的应用[J]. 遥感学报, 14(1):113-126.
[
|
| [12] |
王苏民 . 1998. 中国湖泊志 [M]. 北京: 科学出版社.
[
|
| [13] |
王智颖, 吴艳红, 常军 , 等. 2017. 青藏高原湖冰物候的时空变化及其影响因素[J]. 北京工业大学学报, 43(5):701-709.
[
|
| [14] |
魏秋方, 叶庆华 . 2010. 湖冰遥感监测方法综述[J]. 地理科学进展, 29(7):803-810.
[
|
| [15] |
吴其慧 . 2018. 基于遥感影像的呼伦湖湖冰近30年的变化分析及其影响因素研究[D]. 呼和浩特: 内蒙古农业大学.
[
|
| [16] |
徐占江 . 1989. 呼伦湖志 [M]. 吉林: 吉林文史出版社.
[
|
| [17] |
殷青军, 杨英莲 . 2005. 基于EOS/MODIS数据的青海湖遥感监测[J]. 湖泊科学, 17(4):356-360.
[
|
| [18] |
姚晓军, 李龙, 赵军 , 等. 2015. 近10年来可可西里地区主要湖泊冰情时空变化[J]. 地理学报, 70(7):1114-1124.
[
|
| [19] |
|
| [20] |
|
| [21] |
|
| [22] |
|
| [23] |
|
| [24] |
|
| [25] |
|
| [26] |
|
| [27] |
|
| [28] |
|
| [29] |
|
| [30] |
|
| [31] |
|
| [32] |
|
| [33] |
|
| [34] |
|
| [35] |
|
/
| 〈 |
|
〉 |