
中国大运河沿线城市扩张时空差异研究
|
施利锋(1990— ),男,江苏启东人,博士后,主要从事土地利用分类与城市扩展遥感监测研究。E-mail: shilf@nju.edu.cn |
收稿日期: 2018-06-13
要求修回日期: 2019-02-11
网络出版日期: 2019-08-25
基金资助
国家社会科学基金重大项目(17ZDA061)
江苏省水利科技项目(2018041)
版权
Spatiotemporal differences of urban expansion along China’s Grand Canal
Received date: 2018-06-13
Request revised date: 2019-02-11
Online published: 2019-08-25
Supported by
Major Program of the National Social Science Foundation of China(17ZDA061)
Hydraulic and Technological Program of Jiangsu Province(2018041)
Copyright
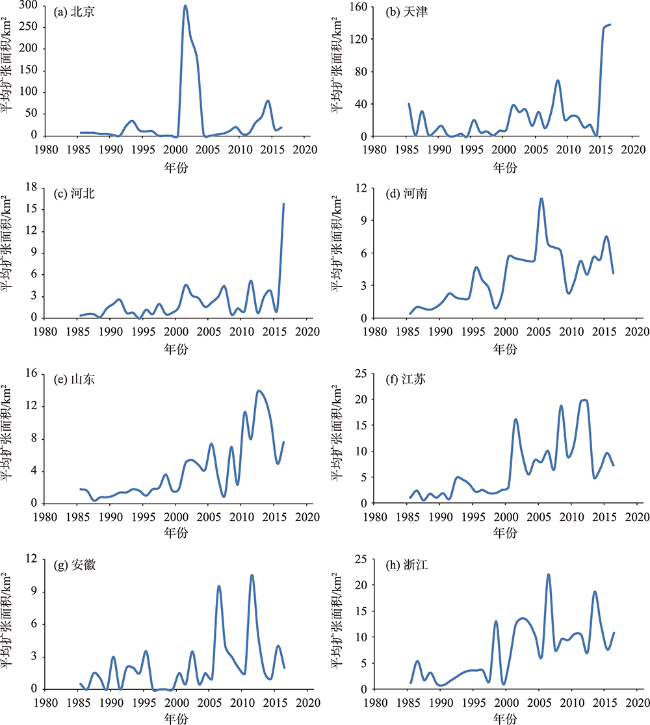
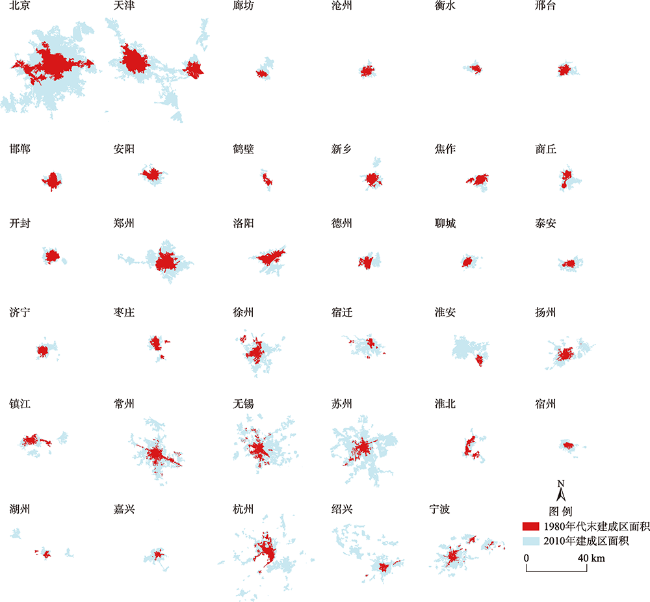
自20世纪80年代以来,中国大运河沿线城市建成区规模、空间扩张模式以及空间分布特征都发生了显著变化。虽然当前不缺乏大运河重要河段以及沿线典型城市的研究,但对于大运河沿线城市整体扩张的研究较为少见。论文结合统计数据与遥感数据分析了1984—2016年中国大运河沿线城市建成区扩张速度特征、空间特征以及区域差异。结果显示:① 中国大运河沿线城市建成区扩张速度特征可被归纳为4类,不同类别之间差异显著;② 基于遥感影像提取的运河沿线城市建成区面积通常为相同城市对应年份的统计年鉴中建成区面积的1~2倍;③ 运河沿线城市建成区空间分布整体趋于离散、破碎,江浙地区运河沿线城市的建成区空间分布最离散、破碎,且离散度增长最剧烈。
施利锋 , 黄贤金 . 中国大运河沿线城市扩张时空差异研究[J]. 地理科学进展, 2019 , 38(8) : 1206 -1216 . DOI: 10.18306/dlkxjz.2019.08.009
Since the 1980s, with demands from water conservancy projects, the rise of canal tourism, and the proposal of the national canal cultural development strategy, the China's Grand Canal has been reviving. At the same time, the size, expansion pattern, and spatial distribution of built-up areas along the Grand Canal have experienced significant changes, with far-reaching effects on city traffic, communication, production, daily life, and public facilities. There have been abundant studies on the key river sections or typical cities. However, there is a general lack of research on the overall expansion of cities along the Grand Canal. In this study, 35 cities along China's Grand Canal were selected as the research subjects. The research area covered two municipalities and six provinces from north to south. Statistical data and remote sensing data were combined in this study for analyzing urban expansion speed, urban expansion pattern, and regional differences of cities along the Grand Canal during 1984-2016. All statistical data were collected from statistical yearbooks. Landsat images were the main data source for urban land mapping. Dispersion index (DI) was applied in this study. The index is a new landscape metric, which was developed for describing the structures and distributions of geographic elements in a region. The results show that: 1) The cities can be classified into four types according to the characteristics of the speed of expansion. Class one contains Shandong, Anhui, Jiangsu, and Zhejiang Provinces, where urban land expansion speed increased dramatically after 2000 and decreased latter. Class two contains Hebei Province and Tianjin Municipality, where urban land expansion speed increased moderately but decreased dramatically latter. Class three contains Beijing, where the highest expansion speed appeared in 2000 and then changed dramatically. Class four contains Henan Province, where expansion speed of urban land changed moderately before and after 2000. 2) Urban built-up areas extracted from remote sensing images are generally larger than urban built-up areas collected from statistical yearbooks. The former is usually between 1-2 times of the latter, and urban expansion in northern China mainly extended around one center, but urban expansions in southern China gradually became polycentric. 3) The spatial distribution of built-up areas in most cities tends to become dispersed and discontinuous, and cities in Jiangsu and Zhejiang Provinces are more remarkable in this respect. The spatial distribution of built-up areas in Beijing was most integrated and compact. The growth of DI values of built-up areas in Hebei Province was the lowest and urban land expansion there was slow. With the successful application for World Heritage of the Grand Canal and the proposal of the Grand Canal cultural development strategy, the construction of the Grand Canal culture belt and the development of canal tourism will become an important measure for promoting the joint development of different regions.
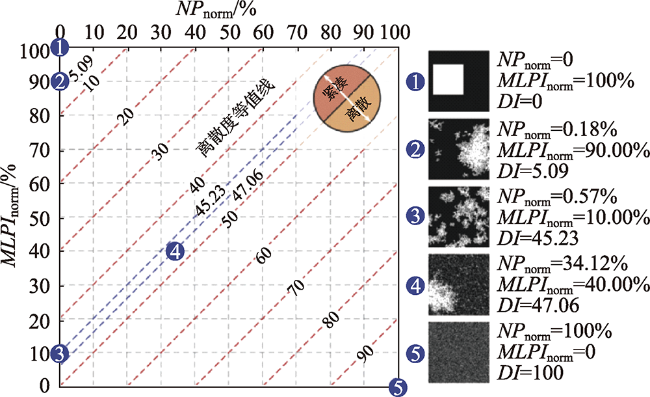
图2 5种随机斑块离散度下图斑的分布特征注:引自Taubenböck et al, 2014。倾斜的红色虚线为离散度指数等值线。 Fig.2 Patch distribution characteristics of five random dispersion index (DI) values |
表1 35个城市遥感影像建成区面积与统计年鉴建成区面积比较Tab.1 Comparison of built-up areas based on remote sensing and statistical data (km2) |
| 城市 | 1987年建成区面积 | 2010年建成区面积 | 城市 | 1987年建成区面积 | 2010年建成区面积 | ||||
|---|---|---|---|---|---|---|---|---|---|
| 统计年鉴 | 遥感监测 | 统计年鉴 | 遥感监测 | 统计年鉴 | 遥感监测 | 统计年鉴 | 遥感监测 | ||
| 北京 | 387 | 407 | 1225 | 1848 | 济宁 | 19 | 30 | 89 | 91 |
| 天津 | 314 | 349 | 687 | 1363 | 枣庄 | 33 | 40 | 109 | 122 |
| 廊坊 | 12 | 19 | 59 | 89 | 徐州 | 55 | 69 | 239 | 273 |
| 沧州 | 25 | 33 | 46 | 65 | 宿迁 | 9 | 14 | 65 | 102 |
| 衡水 | 13 | 22 | 44 | 51 | 淮安 | 13 | 18 | 120 | 210 |
| 邢台 | 22 | 33 | 70 | 75 | 扬州 | 21 | 40 | 82 | 183 |
| 邯郸 | 61 | 64 | 111 | 115 | 镇江 | 27 | 38 | 109 | 138 |
| 安阳 | 30 | 48 | 76 | 112 | 常州 | 36 | 60 | 153 | 348 |
| 鹤壁 | 12 | 18 | 51 | 53 | 无锡 | 48 | 69 | 231 | 396 |
| 新乡 | 40 | 46 | 97 | 111 | 苏州 | 35 | 54 | 329 | 646 |
| 焦作 | 33 | 46 | 90 | 95 | 淮北 | 21 | 36 | 63 | 94 |
| 商丘 | 15 | 33 | 60 | 106 | 宿州 | 12 | 16 | 53 | 64 |
| 开封 | 41 | 49 | 94 | 96 | 湖州 | 15 | 16 | 78 | 81 |
| 郑州 | 74 | 112 | 343 | 417 | 嘉兴 | 18 | 21 | 85 | 89 |
| 洛阳 | 42 | 69 | 181 | 192 | 杭州 | 66 | 82 | 413 | 435 |
| 德州 | 22 | 34 | 89 | 98 | 绍兴 | 14 | 22 | 100 | 125 |
| 聊城 | 17 | 24 | 69 | 72 | 宁波 | 42 | 47 | 272 | 298 |
| 泰安 | 18 | 24 | 77 | 86 | 合计 | 1662 | 2102 | 6099 | 8739 |
表2 20世纪80年代末和2010年35个城市建成区离散度指数Tab.2 Dispersion index (DI) of the built-up areas of 35 cities in the late 1980s and 2010 |
| 城市 | 建成区离散度指数 | 城市 | 建成区离散度指数 | 城市 | 建成区离散度指数 | |||
|---|---|---|---|---|---|---|---|---|
| 1980年代末 | 2010年 | 1980年代末 | 2010年 | 1980年代末 | 2010年 | |||
| 北京 | 10 | 13 | 洛阳 | 17 | 19 | 淮北 | 18 | 22 |
| 天津 | 17 | 20 | 德州 | 18 | 21 | 宿州 | 12 | 14 |
| 廊坊 | 16 | 15 | 聊城 | 13 | 17 | 湖州 | 17 | 25 |
| 沧州 | 16 | 15 | 泰安 | 16 | 20 | 嘉兴 | 19 | 23 |
| 衡水 | 18 | 19 | 济宁 | 15 | 22 | 杭州 | 34 | 44 |
| 邢台 | 14 | 17 | 枣庄 | 19 | 23 | 绍兴 | 23 | 42 |
| 邯郸 | 11 | 13 | 徐州 | 31 | 36 | 宁波 | 32 | 38 |
| 安阳 | 15 | 19 | 宿迁 | 27 | 35 | 河北均值 | 15 | 16 |
| 鹤壁 | 19 | 22 | 淮安 | 16 | 31 | 河南均值 | 17 | 20 |
| 新乡 | 22 | 23 | 扬州 | 27 | 39 | 山东均值 | 16 | 21 |
| 焦作 | 16 | 18 | 镇江 | 25 | 32 | 江苏均值 | 28 | 36 |
| 商丘 | 15 | 17 | 常州 | 30 | 35 | 安徽均值 | 15 | 18 |
| 开封 | 14 | 18 | 无锡 | 37 | 35 | 浙江均值 | 25 | 34 |
| 郑州 | 17 | 21 | 苏州 | 34 | 43 | 总均值 | 20 | 25 |
| 1 |
曹仁勇 . 2007. 京杭大运河江苏段沿线城市滨水空间景观标识系统规划研究[D]. 南京: 南京林业大学.
[
|
| 2 |
程巍华 . 2008. 京杭运河沟通钱塘江第二通道航道线位优选研究[D]. 杭州: 浙江大学.
[
|
| 3 |
丁旭 . 2017. 遗产廊道理念下大运河风景路的规划研究[D]. 南京: 南京林业大学.
[
|
| 4 |
杜祥 . 2016. 济宁城区古运河景观传承与再生策略研究[D]. 济南: 山东建筑大学.
[
|
| 5 |
国家统计局. 2017. 中国城市统计年鉴2017 [M]. 北京: 中国统计出版社.
[ National Bureau of Statistics of the People's Republic of China. 2017. China city statistical yearbook 2017. Beijing, China: China Statistics Press. ]
|
| 6 |
黄昊, 贾铁飞 . 2013. 古运河旅游开发及其空间模式研究: 以京杭大运河长江三角洲区段为例[J]. 地域研究与开发, 32(2):129-133.
[
|
| 7 |
黄贤金 . 2017. 基于资源环境承载力的长江经济带战略空间构建[J]. 环境保护, ( 15):25-26.
[
|
| 8 |
黄贤金, 周艳 . 2016. 基于资源环境人口承载力的国土空间格局优化研究: 以江苏沿海地区为例[J]. 淮海工学院学报(人文社会科学版), ( 5):83-86.
[
|
| 9 |
贾兵强, 朱晓鸿 . 2015. 图说治水与中华文明 [M]. 北京: 中国水利水电出版社.
[
|
| 10 |
康新宇 . 2010. 在用巨型线性文化遗产保护: 大运河浙江段五城市(杭州、嘉兴、湖州、绍兴、宁波)遗产保护规划[J]. 城市规划通讯, ( 6):14-16.
[
|
| 11 |
任唤麟 . 2017. 基于地理特征的跨区域线性文化遗产旅游形象策略研究[J]. 地理与地理信息科学, 33(1):95-101.
[
|
| 12 |
阮仪三, 朱晓明, 王建波 . 2007. 运河踏察: 大运河江苏、山东段历史城镇遗产调研初探[J]. 同济大学学报(社会科学版), ( 1):38-54.
[
|
| 13 |
沈旭炜 . 2017. 改革开放后我国大运河旅游发展阶段及特征[J]. 商丘职业技术学院学报, 16(5):51-55.
[
|
| 14 |
孙金浩 . 2011. 清中期以后京杭大运河衰落对运河地区城乡经济的影响[D]. 成都: 四川省社会科学院.
[
|
| 15 |
陶潇男 . 2015. 苏北地区历史城镇景观变迁研究[D]. 南京: 南京师范大学.
[
|
| 16 |
王英华, 杜龙江, 邓俊 . 2015. 图说古代水利工程 [M]. 北京: 中国水利水电出版社.
[
|
| 17 |
温宗勇, 赵一诺, 李伟 . 2015. 唤醒沉睡的大运河: 京杭大运河京津冀段调查实录[J]. 北京规划建设, ( 4):135-145.
[
|
| 18 |
吴常艳, 黄贤金, 陈博文 , 等. 2017. 长江经济带经济联系空间格局及其经济一体化趋势[J]. 经济地理, 37(7):71-78.
[
|
| 19 |
吴晓, 王承慧, 滕珊珊 , 等. 2014. 历史保护规划中的展示利用思路初探[J]. 城市规划, 38(3):70-77.
[
|
| 20 |
吴欣 . 2018. 中国大运河蓝皮书: 中国大运河发展报告(2018) [M]. 北京: 社会科学文献出版社.
[
|
| 21 |
项宏建, 李悦铮 . 2015. 京杭大运河沿线主要城市旅游经济时空差异及其预测[J]. 云南地理环境研究, 27(5):35-42.
[
|
| 22 |
俞孔坚, 李迪华, 李伟 . 2008. 京杭大运河的完全价值观[J]. 地理科学进展, 27(2):1-9.
[
|
| 23 |
张环宙, 沈旭炜, 高静 . 2011. 城市滨水区带状休闲空间结构特征及其实证研究: 以大运河杭州主城段为例[J]. 地理研究, 30(10):1891-1900.
[
|
| 24 |
张京祥, 刘雨平 . 2008. 沿京杭大运河地区的空间发展: 以京杭大运河扬州段为例[J]. 经济地理, 28(1):1-5.
[
|
| 25 |
张祥娟, 李新, 李秀霞 , 等. 2011. 用层次分析法建立京杭大运河苏州高新区段水环境承载力指标体系研究[J]. 环境保护与循环经济, 31(2):42-49.
[
|
| 26 |
张增祥, 赵晓丽, 刘芳 , 等. 2014. 中国城市扩展遥感监测图集 [M]. 北京: 星球地图出版社.
[
|
| 27 |
郑晋鸣 . 2017. 让千年文脉奔涌不息: 江苏推进大运河文化带建设 [N]. 光明日报, 2017-08-11.
[
|
| 28 |
周艳, 黄贤金, 徐国良 , 等. 2016. 长三角城市土地扩张与人口增长耦合态势及其驱动机制[J]. 地理研究, 35(2):313-324.
[
|
| 29 |
|
| 30 |
|
| 31 |
|
| 32 |
|
/
| 〈 |
|
〉 |

