
中国海外港口投资格局的空间演化及其机理
陈沛然(1991— ),男,山西忻州人,博士生,主要从事交通地理与区域发展研究。E-mail: 314214107@qq.com
收稿日期: 2019-01-10
要求修回日期: 2019-04-18
网络出版日期: 2019-07-28
基金资助
中国科学院战略性先导项目(XDA20010101)
中国科学院重点部署项目(ZDRW-ZS-2017-4)
国家自然科学基金项目(41571113)
Spatial change of China’s investment pattern for overseas ports and its mechanism
Received date: 2019-01-10
Request revised date: 2019-04-18
Online published: 2019-07-28
Supported by
Strategic Priority Research Program of the Chinese Academy of Sciences, No. XDA20010101
Key Project of the Chinese Academy of Sciences, No. ZDRW-ZS-2017-4
National Natural Science Foundation of China, No. 41571113.
Copyright
伴随着2000年“走出去”写入国家战略和2013年“一带一路”合作倡议提出,中国正在不断加快海外港口投资的步伐。论文构建了中国企业海外港口投资案例的数据库,分析了1978年至今中国海外港口投资格局在全球范围的空间演化过程,并从地域结构、参与主体、股权变化等多个方面阐明了中国企业进入海外港口的特征与路径,总结了企业进入海外港口的主要模式,进一步探索了进入模式之间的内在关系,最后基于为什么“走出去”、为什么在这里布局、为什么选择这种模式3个递进的过程探讨了中国海外港口投资的发展机理。研究表明:中国海外港口投资的空间格局经历了零星分布、就近布局、全球扩散、局部集聚和总体稳定5个发展阶段,总体上集中布局于西北欧和地中海航区,投资主体包括大型航运企业、码头运营商和基建企业,海外港口投资的目标从参股转为控股。海外港口进入模式包括基础设施项目承建、港口经营权转让、港口股权收购和码头管理输出4种,进入模式具有交错演化的特点。中国企业进入海外港口的内在动因可以总结为国家经济发展环境、重大对外开放战略、全球航运格局和地理替代性和企业自身发展需求。
陈沛然 , 王成金 , 刘卫东 . 中国海外港口投资格局的空间演化及其机理[J]. 地理科学进展, 2019 , 38(7) : 973 -987 . DOI: 10.18306/dlkxjz.2019.07.003
Along with the global strategy written into national strategy in 2000 and the Belt and Road Initiative proposed in 2013, China is accelerating the pace of investment for overseas ports. This study constructed a data base of examples of overseas ports investment by Chinese enterprises from 1978 to date, analyzed the spatial change of investment pattern on a global level, and clarified the features and pathway for Chinese enterprises entering overseas ports from the aspects of regional structure, participants, ownership change, and so on. It also examined the main entry patterns of overseas ports, internal relationship between different entry patterns, and correlation and shift between different patterns. Finally this article discussed the development mechanism of China's overseas port investment based on, in progression, why Chinese enterprises went global, why these enterprises invested where they did, and why these enterprises chose certain pattern. The results show that: The process of Chinese investment for overseas pworts can be divided into five development stages—before 2000, these overseas ports scarcely distributed in North Africa; from 2000 to 2008 China's investment for overseas ports tended to distribute in its surrounding areas; from 2009 to 2012 ports distribution turned to a global spread; from 2013 to 2016 overseas ports tended to concentrate as guided by the opening strategy; since 2007 ports distribution has remained overall stable. The changing process of distribution reflects three features: 1) Country distribution is dispersed, while these ports assemble significantly in Northwest European and Mediterranean at the navigation area scale. 2) The investors include large shipping enterprises, wharf operators, and infrastructure enterprises, among which the core enterprises for overseas ports' stock acquisition include China Ocean Shipping (Group) Company and China Merchants Steamship Company, and the core enterprise for overseas ports' infrastructure construction is China Harbour Engineering. 3) The number of overseas ports invested through stock acquisition began to increase rapidly since 2013 and as the investment process constantly deepening, overseas ports investment changed from equity participation to holding. Overseas ports entry patterns include infrastructure project construction, transfer of port managerial authority, acquisition of port's stock, and port management export. The influencing factors for overseas ports investment can be summarized as national economic development context, key opening-up strategy, global shipping pattern, spatial substitution, and enterprise self-development demand. Leading factors and their functions changed at different spatial scales and stages of development.
Fig.1 Spatial pattern and change of China's investment for overseas ports图1 中资海外港口投资格局演化 |
Fig.2 Distribution of overseas ports with Chinese investment by country (a) and navigating area (b)图2 中资海外港口的国别(a)和航区(b)分布 |
Fig.3 Change in the number of overseas ports involving different Chinese enterprises图3 不同企业进入海外港口的数量变化 |
Fig.4 Stock acquisition timing chart of Chinese enterprises图4 国内企业股权收购时间图 |
Fig.5 Spatial pattern and change of overseas ports whose shareholders include Chinese enterprises and stock right proportion of these enterprises图5 入股港口空间格局演化及股权占比 |
Tab.1 The number of overseas ports whose shareholders include Chinese enterprises and average stock right of these enterprises in different navigating areas表1 全球航区入股港口数量及平均股权占比 |
| 全球航区 | 入股港口数量 | 平均股权占比/% |
|---|---|---|
| 西北欧 | 8 | 57.0 |
| 地中海 | 7 | 53.4 |
| 北美东岸 | 4 | 74.5 |
| 非洲西岸 | 3 | 48.5 |
| 非洲东岸 | 2 | 21.8 |
| 北美西岸 | 2 | 56.7 |
| 南亚 | 2 | 80.0 |
| 东南亚 | 2 | 44.5 |
| 东亚 | 1 | 54.5 |
| 南美东岸 | 1 | 90.0 |
| 澳新 | 1 | 20.0 |
Fig.6 Entry pattern of overseas ports图6 海外港口进入模式 |
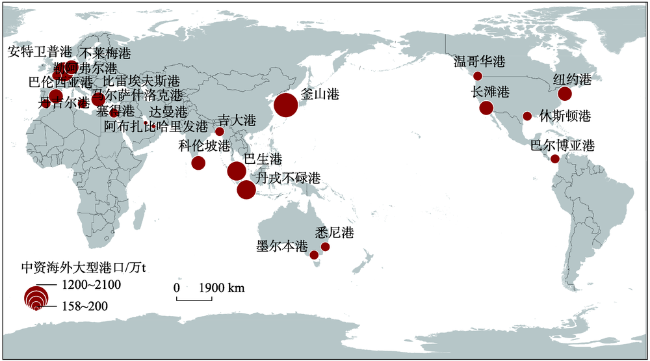
Fig.7 Spatial pattern of overseas ports with Chinese investment图7 中资大型海外港口空间布局 |
The authors have declared that no competing interests exist.
| [1] |
[
|
| [2] |
[
|
| [3] |
[
|
| [4] |
[
|
| [5] |
[
|
| [6] |
[
|
| [7] |
[
|
| [8] |
[
|
| [9] |
[
|
| [10] |
[
|
| [11] |
[
|
| [12] |
[
|
| [13] |
[
|
| [14] |
[
|
| [15] |
|
| [16] |
|
| [17] |
|
| [18] |
|
| [19] |
|
| [20] |
|
| [21] |
|
| [22] |
|
/
| 〈 |
|
〉 |


