
“一带一路”背景下中国国际航空网络的空间格局及演变
杜方叶(1994— ),女,山东济南人,博士生,主要从事交通地理研究。E-mail: dufy.18b@igsnrr.ac.cn
收稿日期: 2018-12-21
要求修回日期: 2019-04-10
网络出版日期: 2019-07-28
基金资助
中国科学院A类战略性先导科技专项子课题(XDA20010101)
国家自然科学优秀青年基金项目(41722103)
Spatial pattern and change of China’s international air transport network since the Belt and Road Initiative
Received date: 2018-12-21
Request revised date: 2019-04-10
Online published: 2019-07-28
Supported by
Strategic Priority Research Program of the Chinese Academy of Sciences, No. XDA20010101
National Natural Science Foundation of China, No. 41722103.
Copyright
2013年“一带一路”倡议提出将设施联通作为合作战略重点之一,航空网络作为设施联通的重要组成部分,其地位提升到新的高度。为评估“一带一路”倡议的提出对中国国际航空网络的影响,论文选取了2013年和2018年数据,从国际航线、国际航班以及通航城市3个方面分析“一带一路”倡议提出以来中国国际航空网络的空间格局及其演变特征。研究结果表明:① 整体上来看,“一带一路”倡议并未从根本上改变中国国际航空网络的空间格局,仍以东亚、东南亚、美国以及俄罗斯等地区和国家为主,5 a来其变化主要集中在进一步加深与已有城市的联系;② 从沿线国家来看,一带一路”倡议增加了与中国直接通航的沿线国家数量,并提升了沿线国家在中国国际航空网络中的地位;③ 越来越多的境内城市参与到中国对外开放格局中,且航线和航班在北京、上海、广州的聚集程度下降,而其他城市的航线和航班占比逐渐增加。
杜方叶 , 王姣娥 , 谢家昊 , 杜德林 . “一带一路”背景下中国国际航空网络的空间格局及演变[J]. 地理科学进展, 2019 , 38(7) : 963 -972 . DOI: 10.18306/dlkxjz.2019.07.002
With the advancement of economic globalization and regional integration, the demands of communica-tion and cooperation among regions increase rapidly. Relying on the unique advantages of speed, accessibility, and convenience, air transportation plays a significant role in the exchange of passenger and cargo among countries. The Belt and Road Initiative was proposed in 2013, which has attracted the attention of the world. Since then, the background of China's development has changed sharply, which brings new development opportunities for the expansion of the country's air transport network and can be shown in the following ways: 1) International tourism as a way of having vacation becomes more popular among people in China, largely due to the rapid increase of income. According to the statistics from China Tourism Administration, the number of outbound tourists increased from 98.2 million in 2013 to 130.51 million in 2017, contributing more passengers for international air transportation. 2) International trade also contributes more to China's prosperous international air transportation. 3) In the Belt and Road Initiative, facility connectivity was proposed as one of the most importance area of cooperation with countries of the region, and air transport network plays an important role in the realization of facility connectivity between countries. However, research on the change of China's international air transport since the proposition of the Belt and Road Initiative is still lacking. To fill this gap, this study analyzed the spatial distribution and change of international air transport network of China in terms of air routes, flights, and navigable cities based on the data of China's international air routes and flights in 2013 and 2018. The results show that: 1) On a whole, in the past five years, the Belt and Road Initiative has not altered the original pattern of China's air transport network, in which navigable cities formed the catchment centered on east and southeast Asia. 2) With regard to countries along the Belt and Road, their importance in China's air transport network is increasing and the numbers of routes and flights are increasing distinctively. 3) The main hub cities in China were Beijing, Shanghai, and Guangzhou in both 2013 and 2018, and more cities became secondary hub cities for different regions. New air transport routes and flights are operated in the existing navigable cities, showing that the direction of China's international air transport development is to deepen the connection with existing navigable countries and cities.
Tab.1 Statistics of China’s international air transport network表1 中国国际航空客运网络联系范围变化 |
| 类型 | 2005年 | 2013年 | 2018年 |
|---|---|---|---|
| 航线/条 | 281 | 690 | 971 |
| 航班数量/(趟/周) | 3454 | 9467 | 16122 |
| 航班频率/(趟/周·航线) | 12.3 | 13.7 | 16.6 |
| 通航国家/个 | 46 | 69 | 72 |
| 境内通航城市/个 | 40 | 58 | 75 |
| 国外通航城市/个 | 98 | 174 | 189 |
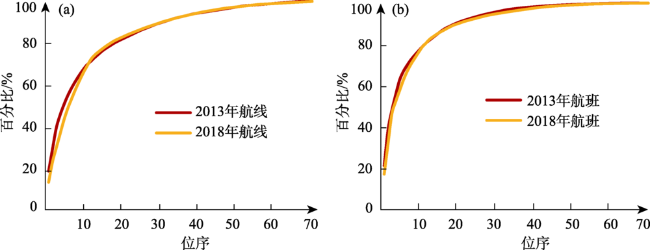
Fig.1 Rank-size distribution of China's international air routes/flights图1 中国国际航线/航班的位序-规模变化 |
Tab.2 Air transport connections between China and countries along the Belt and Road表2 中国与“一带一路”沿线国家航空联系范围的变化 |
| 类别 | 国际直飞航线 | 2013年 | 2018年 | 变化量 |
|---|---|---|---|---|
| 中国-全球 | 航线数量/条 | 690 | 971 | 281 |
| 航班频率/(趟/周) | 9467 | 16122 | 6655 | |
| 通航城市数量(境内)/个 | 58 | 75 | 17 | |
| 通航国家数量/个 | 69 | 72 | 3 | |
| 通航城市数量(国际)/个 | 174 | 189 | 15 | |
| 中国-“一带一路”沿线国家 | 航线数量/条 | 347 | 579 | 232 |
| 航班频率/(趟/周) | 3868 | 8557 | 4689 | |
| 通航城市数量(境内)/个 | 47 | 69 | 22 | |
| 通航国家数量/个 | 35 | 40 | 5 | |
| 通航城市数量(国际)/个 | 84 | 93 | 9 | |
| “一带一路”沿线国家占比 | 航线数量/% | 50.3 | 59.6 | 9.3 |
| 航班频率/% | 40.9 | 53.1 | 12.2 | |
| 通航城市数量(境内)/% | 81.0 | 89.6 | 8.6 | |
| 通航国家/% | 50.7 | 55.6 | 4.9 | |
| 通航城市数量(国际)/% | 48.9 | 49.2 | 0.3 |
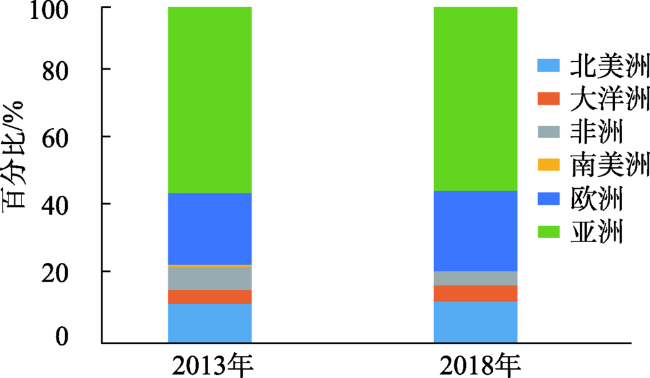
Fig.2 Regional distribution of navigable cities图2 通航城市的区域分布 |
Tab.3 Aviation hub cities in 2013 and 2018表3 中国面向全球及区域的枢纽城市 |
| 区域 | 2013年 | 2018年 |
|---|---|---|
| 全球 | 上海 | 上海 |
| 北美洲 | 上海 | 上海 |
| 欧洲 | 北京 | 北京 |
| 大洋洲 | 广州 | 广州 |
| 非洲 | 广州 | 广州 |
| 东南亚 | 上海 | 广州 |
| 南亚 | 北京 | 昆明 |
| 东亚 | 上海 | 上海 |
| 西亚 | 上海 | 上海 |
| 中亚 | 乌鲁木齐 | 乌鲁木齐 |
Tab.4 Top 10 hub cities by international air routes/flights in China in 2013 and 2018表4 中国国际航线/航班的境内重点城市 |
| 排名 | 2013年 | 2018年 | |||||||
|---|---|---|---|---|---|---|---|---|---|
| 城市 | 航线数量/条 | 城市 | 航班频率/(趟/周) | 城市 | 航线数量/条 | 城市 | 航班频率/(趟/周) | ||
| 1 | 北京 | 116 | 上海 | 2951 | 北京 | 118 | 上海 | 3923 | |
| 2 | 上海 | 91 | 北京 | 2065 | 上海 | 112 | 北京 | 2383 | |
| 3 | 广州 | 59 | 广州 | 1161 | 广州 | 76 | 广州 | 2039 | |
| 4 | 成都 | 32 | 青岛 | 296 | 成都 | 48 | 昆明 | 682 | |
| 5 | 乌鲁木齐 | 27 | 成都 | 283 | 昆明 | 40 | 深圳 | 641 | |
| 6 | 昆明 | 26 | 昆明 | 278 | 深圳 | 39 | 成都 | 536 | |
| 7 | 杭州 | 23 | 大连 | 237 | 杭州 | 32 | 青岛 | 481 | |
| 8 | 大连 | 19 | 杭州 | 185 | 重庆 | 32 | 天津 | 406 | |
| 9 | 武汉 | 16 | 武汉 | 179 | 西安 | 31 | 杭州 | 394 | |
| 10 | 重庆 | 16 | 厦门 | 173 | 天津 | 30 | 厦门 | 352 | |
| 合计 | 425 | 7809 | 558 | 11837 | |||||
| 占总航线/航班比 | 61.6% | 82.3% | 57.5% | 73.4% | |||||
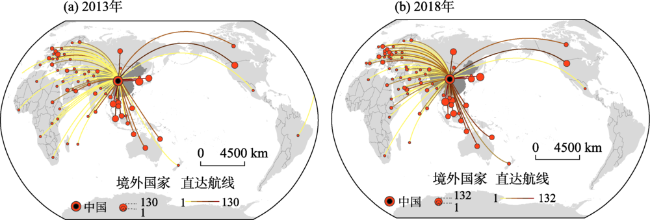
Fig.3 Spatial pattern of China's international air routes图3 中国国际航线空间分布格局 |
Tab.5 Top 10 countries by direct air routes with China in 2013 and 2018表5 中国国际航线联系前10位国家 |
| 排名 | 2013年 | 2018年 | 新增 | |||||
|---|---|---|---|---|---|---|---|---|
| 国家 | 数量/条 | 国家 | 数量/条 | 国家 | 数量/条 | |||
| 1 | 韩国 | 130 | 泰国 | 132 | 泰国 | 62 | ||
| 2 | 日本 | 72 | 日本 | 93 | 俄罗斯 | 31 | ||
| 3 | 泰国 | 70 | 韩国 | 66 | 越南 | 29 | ||
| 4 | 美国 | 43 | 俄罗斯 | 65 | 印度尼西亚 | 27 | ||
| 5 | 俄罗斯 | 34 | 美国 | 64 | 柬埔寨 | 23 | ||
| 6 | 新加坡 | 30 | 越南 | 54 | 马来西亚 | 22 | ||
| 7 | 越南 | 25 | 马来西亚 | 44 | 日本 | 21 | ||
| 8 | 马来西亚 | 22 | 柬埔寨 | 43 | 美国 | 21 | ||
| 9 | 柬埔寨 | 20 | 印度尼西亚 | 39 | 澳大利亚 | 21 | ||
| 10 | 菲律宾 | 18 | 澳大利亚 | 37 | 菲律宾 | 14 | ||
| 总计 | 464 | 637 | 271 | |||||
| 占总航线比重 | 67.3% | 65.6% | 75.5% | |||||
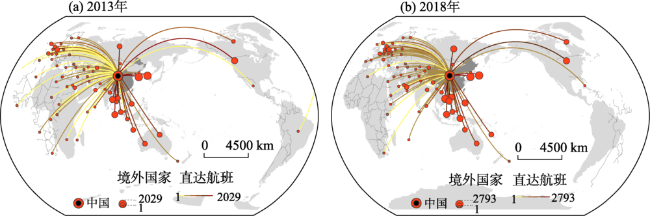
Fig.4 Spatial distribution of China's international flights图4 中国国际航班的空间分布格局 |
Tab.6 Top 10 countries by direct flights with China in 2013 and 2018表6 中国国际航班联系前10位国家 |
| 排名 | 2013年 | 2018年 | 新增国际航班 | |||||
|---|---|---|---|---|---|---|---|---|
| 国家 | 数量/趟 | 国家 | 数量/趟 | 国家 | 数量/趟 | |||
| 1 | 韩国 | 2029 | 泰国 | 2793 | 泰国 | 1901 | ||
| 2 | 日本 | 1630 | 日本 | 2355 | 日本 | 725 | ||
| 3 | 泰国 | 892 | 韩国 | 2324 | 越南 | 475 | ||
| 4 | 新加坡 | 722 | 美国 | 969 | 马来西亚 | 424 | ||
| 5 | 美国 | 658 | 新加坡 | 839 | 印度尼西亚 | 381 | ||
| 6 | 马来西亚 | 408 | 马来西亚 | 832 | 柬埔寨 | 348 | ||
| 7 | 俄罗斯 | 288 | 越南 | 684 | 美国 | 311 | ||
| 8 | 德国 | 254 | 俄罗斯 | 569 | 韩国 | 295 | ||
| 9 | 越南 | 209 | 印度尼西亚 | 468 | 俄罗斯 | 281 | ||
| 10 | 澳大利亚 | 197 | 柬埔寨 | 462 | 菲律宾 | 238 | ||
| 总计 | 7287 | 12295 | 5380 | |||||
| 占总航班比重 | 77.0% | 76.3% | 81.9% | |||||
The authors have declared that no competing interests exist.
| [1] |
[
|
| [2] |
国际民用航空组织. 2014. 国际民航组织空中航行报告2014 [R]. 蒙特利尔: 国际民用航空组织: 5.
[International Civil Aviation Organization.2014. International civil aviation organization air navigation report 2014. Montreal, Canada: International Civil Aviation Organization: 5. ]
|
| [3] |
国际民用航空组织. 2018. 国际民航组织空中航行报告2018 [R]. 蒙特利尔: 国际民用航空组织: 5.
[International Civil Aviation Organization.2018. International civil aviation organization air navigation report 2018. Montreal, Canada: International Civil Aviation Organization: 5. ]
|
| [4] |
[
|
| [5] |
[
|
| [6] |
[
|
| [7] |
[
|
| [8] |
[
|
| [9] |
[
|
| [10] |
[
|
| [11] |
民航资源网. 2013. 年终盘点: 2013年全国民航主要运输指标统计 [DB/OL]
[Civil Aviation Resource Net of China. 2013. Year-end review: Statistics of major transportation indexes of civil aviation in China in 2013 ]
|
| [12] |
民航资源网. 2018. IATA: 2017年全球航空客运需求同比增长7.6%
[Civil Aviation Resource Net of China. 2013. IATA: Global passenger demand for air travel rose 7.6 percent year-on-year in 2017 ]
|
| [13] |
[
|
| [14] |
[
|
| [15] |
[
|
| [16] |
[
|
| [17] |
[
|
| [18] |
[
|
| [19] |
[
|
| [20] |
[
|
| [21] |
中国旅游研究院. 2014. 中国出境旅游发展年度报告2014 [M]. 北京: 旅游教育出版社.
[
|
| [22] |
中国旅游研究院. 2018. 中国出境旅游发展年度报告2018 [M]. 北京: 旅游教育出版社.
[
|
| [23] |
中华人民共和国国家统计局. 2014. 中国统计年鉴 [M]. 北京: 中国统计出版社.
[
|
| [24] |
中华人民共和国国家统计局. 2018. 中国统计年鉴 [M]. 北京: 中国统计出版社.
[
|
| [25] |
|
| [26] |
|
| [27] |
|
| [28] |
|
| [29] |
|
| [30] |
|
| [31] |
|
| [32] |
|
| [33] |
|
/
| 〈 |
|
〉 |