
城市轨道交通通勤与职住平衡状况的关系研究——基于大数据方法的北京实证分析
第一作者简介:申犁帆(1987—),男,北京人,博士,研究方向为城市轨道交通与空间规划、城市居民职住关系、城市可持续发展。E-mail: 495062785@qq.com
收稿日期: 2018-07-10
要求修回日期: 2018-12-10
网络出版日期: 2019-06-27
基金资助
国家自然科学基金项目(51678029,51778039)
中国城市轨道交通协会专项研究项目(A17M00080)
Relationship between urban rail transit commuting and jobs-housing balance: An empirical analysis from Beijing based on big data methods
Received date: 2018-07-10
Request revised date: 2018-12-10
Online published: 2019-06-27
Supported by
National Natural Science Foundation of China, No. 51678029 and 51778039
Specific Research Project of China Urban Rail Transit Association, No. A17M00080.
Copyright
城市轨道交通网络的发展在提高居民通勤效率的同时也对其职住平衡状况产生了一定影响。论文以北京市206个轨道站点为例,基于高斯混合模型(Gaussian mixture model, GMM)和一卡通刷卡数据将轨道站点按职住功能进行分类,利用腾讯“宜出行”定位数据考察轨道站点周边的动态人口分布并计算就业居住比。研究发现:① 中心城区的职住状况明显优于中心城区以外区域;② 轨道交通线网末端区域的职住平衡程度较差,仅有少数成规模的高端服务产业集中分布的轨道站点周边形成了区域性就业中心;③ 部分就业-居住较为均衡的城郊地区仍存在一定的职住不匹配现象。随后,通过计算一卡通出进站比和“宜出行”职住比得到出进站均衡度和职住平衡度,利用广义自回归条件异方差(generalized autoregressive conditional heteroskedasticity, GARCH)模型对轨道交通通勤和职住平衡程度进行相关性分析,研究结果表明:① 出进站均衡度与职住平衡度具有非常显著的正向关系,即站点进出站人数越接近,站点周边区域的职住状况越好;② 典型就业地站点与站点周边区域的职住平衡程度显著正相关,而典型居住地站点与站点周边区域的职住状况存在显著的负相关性。这表明,人口稠密的聚居区无法带动同样数量就业岗位的产生,而完善的就业中心能够吸引一定数量的人口在附近居住;③ 轨道站点的区位条件与职住平衡状况存在一定正向关系;④ GMM能够对属性复杂模糊的轨道站点进行有效的聚类分析;⑤ 具有实时性强、精确度高、覆盖度广、获取难度低等优点的“宜出行”数据能够在微观空间尺度下弥补其他捕捉和分析实时人口时空分布特征方法的局限性。

申犁帆 , 张纯 , 李赫 , 王烨 , 王子甲 . 城市轨道交通通勤与职住平衡状况的关系研究——基于大数据方法的北京实证分析[J]. 地理科学进展, 2019 , 38(6) : 791 -806 . DOI: 10.18306/dlkxjz.2019.06.001
The development of urban rail transit (URT) network improves the commuting efficiency of residents while it has a certain impact on their jobs-housing balance. This study took 206 URT stations in Beijing as an example and classified them according to their jobs-housing functions based on the Gaussian mixture model (GMM) and smart card data. The dynamic population distribution characteristics around URT station were explored and jobs-housing ratio was calculated by "Yichuxing" position data. The study found that: 1) The jobs-housing balance in the central city is obviously better than that outside of the central city. 2) At the ends of the URT network, the jobs-housing balance is worse while only a few stations with concentrated distribution of top service industries have formed regional employment centers. 3) There still exists a certain degree of jobs-housing mismatch in the areas around some suburban stations where employment and residential functions are relatively equal. Station outflow-inflow and jobs-housing balances were calculated by the station egrass-ingrass ratio and the jobs-housing ratio, and the correlation between URT commuting behavior and jobs-housing balance was analyzed by generalized autoregressive conditional heteroskedasticity (GARCH) model. The results of this study indicate that: 1) There is a very strong positive relationship between URT station egrass-ingrass balance and jobs-housing balance. The closer the numbers of URT station outflow and inflow population, the better the jobs-housing balance around the URT station is. 2) There is a strong positive relationship between employment opportunity and jobs-housing balance around a URT station; and there is a strong negative relationship between residential function and jobs-housing balance around a URT station. This suggests that dense settlement will not generate the same quantity of jobs while well-developed employment hubs can attract a certain number of residents to live nearby. 3) There is a positive correlation between locational conditions of URT stations and jobs-housing balance. 4) The GMM can effectively cluster URT stations with complex and unclear attributes. 5) With its advantages of real-time data capturing, high precision, wide coverage, and great accessibility, "Yichuxing" position data can effectively compensate for the limitations of other methods on collecting and analyzing spatial-temporal characteristics of real-time population distribution at the microscopic scale.
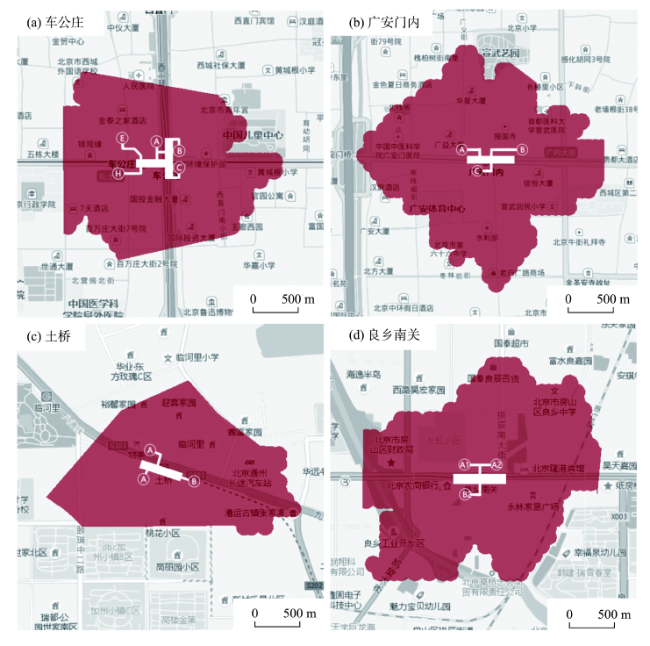
Fig.1 Reasonable pedestrian catchment areas of urban rail transit (URT) stations图1 轨道站点的合理步行范围示意 |
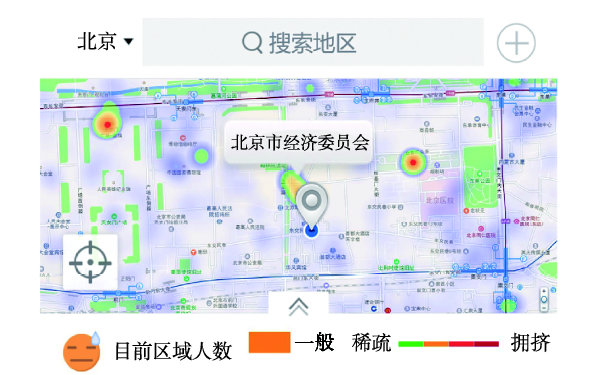
Fig.2 Thermodynamic diagram by "Yichuxing"图2 “宜出行”热力图展示 |
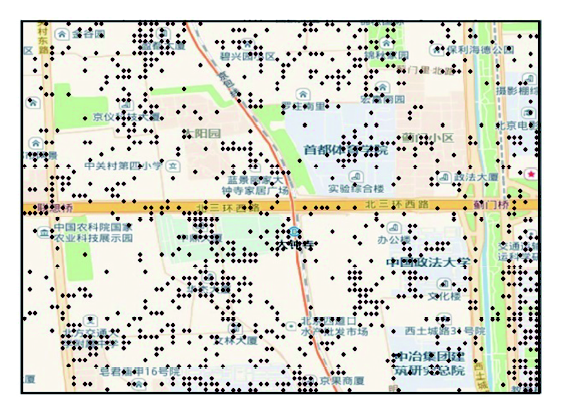
Fig.3 Point data of "Yichuxing"图3 “宜出行”点数据展示 |
Tab.1 URT stations in the study area表1 研究范围内的轨道站点 |
| 所属区 | 站点名称 | |||||||
|---|---|---|---|---|---|---|---|---|
| 海淀区 | 健德门 | 知春路 | 巴沟 | 车道沟 | 公主坟 | 白堆子 | 西小口 | 军事博物馆 |
| 牡丹园 | 知春里 | 火器营 | 慈寿寺 | 莲花桥 | 五棵松 | 育新 | 海淀五路居 | |
| 西土城 | 苏州街 | 长春桥 | 西二旗 | 花园桥 | 玉泉路 | 上地 | 西钓鱼台 | |
| 五道口 | 大钟寺 | 北沙滩 | 万寿路 | 六道口 | 永泰庄 | 白石桥南 | 清华东路西口 | |
| 西城区 | 复兴门 | 积水潭 | 木樨地 | 长椿街 | 阜成门 | 湾子 | 鼓楼大街 | 广安门内 |
| 车公庄 | 北海北 | 和平门 | 虎坊桥 | 达官营 | 车公庄西 | 南礼士路 | 什刹海 | |
| 东城区 | 建国门 | 王府井 | 安定门 | 雍和宫 | 东直门 | 前门 | 天坛东门 | 东四十条 |
| 北京站 | 珠市口 | 北新桥 | 灯市口 | 崇文门 | 东单 | 广渠门内 | 张自忠路 | |
| 朝阳门 | 磁器口 | 桥湾 | 东四 | 和平里北街 | 南锣鼓巷 | |||
| 朝阳区 | 四惠东 | 褡裢坡 | 光熙门 | 永安里 | 四惠 | 黄渠 | 北苑路北 | 传媒大学 |
| 望京西 | 立水桥 | 常营 | 青年路 | 国贸 | 管庄 | 立水桥南 | 金台夕照 | |
| 呼家楼 | 东大桥 | 焦化厂 | 安贞门 | 双井 | 化工 | 南楼梓庄 | 和平西桥 | |
| 大郊亭 | 高碑店 | 林翠桥 | 北土城 | 肖村 | 双合 | 奥体中心 | 广渠门外 | |
| 芍药居 | 太阳宫 | 三元桥 | 亮马桥 | 草房 | 关庄 | 百子湾 | 惠新西街北口 | |
| 劲松 | 潘家园 | 成寿寺 | 团结湖 | 北苑 | 双桥 | 安华桥 | 惠新西街南口 | |
| 马泉营 | 崔各庄 | 八里桥 | 安立路 | 孙河 | 柳芳 | 小红门 | 奥林匹克公园 | |
| 十里堡 | 农业展览馆 | 欢乐谷景区 | 大屯路东 | |||||
| 石景山 | 八宝山 | 古城路 | 苹果园 | 八角游乐园 | ||||
| 丰台区 | 刘家窑 | 六里桥 | 科怡路 | 分钟寺 | 宋家庄 | 郭公庄 | 大葆台 | 六里桥东 |
| 石榴庄 | 大红门 | 角门东 | 草桥 | 纪家庙 | 首经贸 | 丰台站 | 丰台南路 | |
| 泥洼 | 丰台科技园 | 丰台东大街 | ||||||
| 大兴区 | 旧宫 | 亦庄桥 | 万源街 | 荣昌东街 | 荣京东街 | 亦庄文化园 | ||
| 昌平区 | 天通苑 | 育知路 | 平西府 | 霍营 | 龙泽 | 天通苑南 | 生命科学园 | 沙河高教园 |
| 回龙观 | 巩华城 | 朱辛庄 | 沙河 | 南邵 | 天通苑北 | 回龙观东大街 | ||
| 房山区 | 篱笆房 | 广阳城 | 稻田 | 长阳 | 苏庄 | 良乡南关 | 良乡大学城 | 良乡大学城北 |
| 良乡大学城西 | ||||||||
| 通州区 | 东夏园 | 郝家府 | 经海路 | 潞城 | 果园 | 北运河西 | 通州北关 | 物资学院路 |
| 次渠南 | 九棵树 | 临河里 | 次渠 | 梨园 | 同济南路 | 通州北苑 | 土桥 | |
| 顺义区 | 南法信 | 后沙峪 | 花梨坎 | 顺义 | 石门 | 俸伯 | 国展 | |
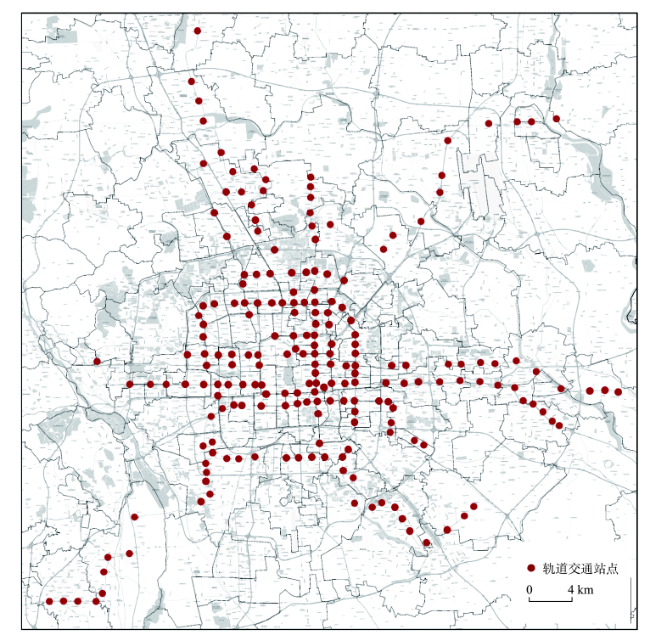
Fig.4 Spatial distribution of URT stations图4 样本轨道站点的空间分布 |
Tab.2 Definition of variables表2 变量定义 |
| 变量 | 定 义 |
|---|---|
| housing | 轨道站点是否为典型居住地站点。用虚拟变量表示,其中:1表示是典型居住地站点,0表示不是典型居住地站点。用式(1)计算得到 |
| jobs | 轨道站点是否为典型就业地站点。用虚拟变量表示,其中:1表示是典型就业地站点,0表示不是典型就业地站点。用式(1)计算得到 |
| jhratio | “宜出行”职住比。用站点步行可达范围内工作日的夜间“宜出行”点数据和日间“宜出行”点数据之比的均值表示 |
| eiratio | 轨道站点出进站比。用站点工作日早高峰时段出站刷卡数和进站刷卡数之比的均值表示 |
| jhbal | 职住平衡度。用“宜出行”职住比减1后得到 |
| eibal | 一卡通出进站均衡度。用轨道站点出进站比减1后得到 |
| aeratio | 轨道站点早高峰进站比。用站点工作日早高峰时段进站刷卡数和全天进站刷卡数之比的均值表示 |
| airatio | 轨道站点早高峰出站比。用站点工作日早高峰时段出站刷卡数和全天出站刷卡数之比的均值表示 |
| peratio | 轨道站点晚高峰进站比。用站点工作日晚高峰时段进站刷卡数和全天进站刷卡数之比的均值表示 |
| piratio | 轨道站点晚高峰出站比。用站点工作日晚高峰时段出站刷卡数和全天出站刷卡数之比的均值表示 |
| egrass | 轨道站点出站数。用站点工作日早高峰时段出站累计刷卡数表示 |
| ingrass | 轨道站点进站数。用站点工作日早高峰时段进站累计刷卡数表示 |
| initial | 轨道站点是否为始发站。用虚拟变量表示,其中:1表示是始发站,0表示不是始发站 |
| transfer | 轨道站点是否为换乘站。用虚拟变量表示,其中:1表示是换乘站,0表示不是换乘站。当轨道站点同属于换乘站和始发站时(如西二旗站),则将该站归为换乘站 |
| exit | 轨道站点的出入口数(个)。经修正后统计得到 |
| location | 轨道站点的区位条件。用站点距离天安门的直线距离(km)表示 |
| distance | 轨道站点的站间距。轨道站点与相邻所有站点的平均站间距离(km) |
| facility | 轨道站点周边是否有主要公共服务设施(包括三甲医院、大型公园、著名景点等)。用虚拟变量表示,其中,1表示有,0表示没有 |
Tab.3 Initial variable values of typical stations near the center of mass表3 质心附近典型站点初始变量指标 |
| 站点名称 | 概率 | 早高峰 进站比 | 早高峰 出站比 | 晚高峰 进站比 | 晚高峰 出站比 |
|---|---|---|---|---|---|
| 天通苑 | 1 | 0.50 | 0.04 | 0.05 | 0.31 |
| 回龙观 | 1 | 0.58 | 0.05 | 0.05 | 0.33 |
| 北苑 | 1 | 0.78 | 0.13 | 0.13 | 0.70 |
| 永安里 | 1 | 0.06 | 0.56 | 0.48 | 0.09 |
| 朝阳门 | 1 | 0.06 | 0.53 | 0.43 | 0.10 |
| 复兴门 | 1 | 0.07 | 0.61 | 0.49 | 0.08 |
| 四惠 | 1 | 0.25 | 0.38 | 0.31 | 0.20 |
| 花园桥 | 1 | 0.21 | 0.40 | 0.36 | 0.19 |
| 和平西桥 | 1 | 0.19 | 0.44 | 0.37 | 0.18 |
Tab.4 Posteriori probability of GMM clustering of some URT stations表4 部分轨道站点的GMM聚类后验概率 |
| 站点名称 | 站点类别 | 典型就业 | 典型居住 |
|---|---|---|---|
| 天通苑 | 典型居住 | 0.071 | 0.929 |
| 回龙观 | 典型居住 | 0.062 | 0.938 |
| 北苑 | 典型居住 | 0.033 | 0.967 |
| 永安里 | 典型就业 | 0.940 | 0.060 |
| 朝阳门 | 典型就业 | 0.933 | 0.067 |
| 复兴门 | 典型就业 | 0.945 | 0.055 |
| 四惠 | 职住混合 | 0.423 | 0.577 |
| 花园桥 | 职住混合 | 0.394 | 0.606 |
| 和平西桥 | 职住混合 | 0.381 | 0.619 |
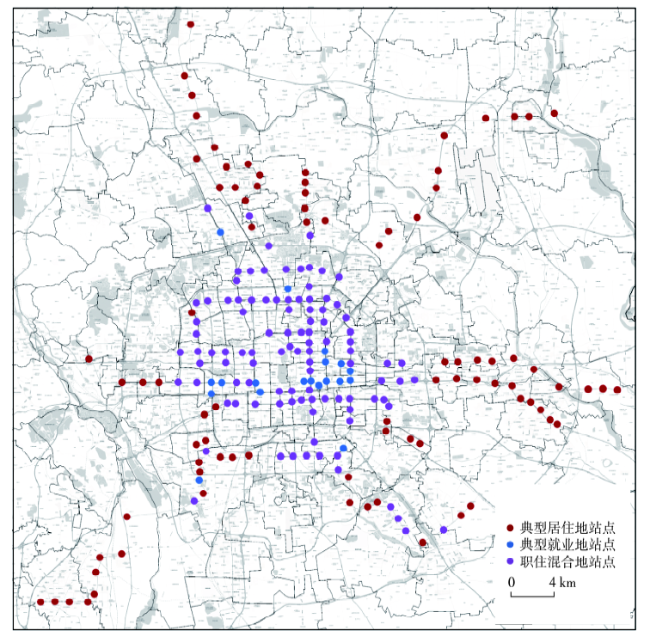
Fig.5 URT stations based on GMM clustering图5 轨道站点的聚类结果展示 |
Tab.5 Jobs-housing ratio around some URT stations by "Yichuxing"表5 部分轨道站点的“宜出行”职住比值 |
| 站点名称 | 职住比 | 站点名称 | 职住比 | 站点名称 | 职住比 | 站点名称 | 职住比 |
|---|---|---|---|---|---|---|---|
| 四惠东 | 2.147 | 安定门 | 1.120 | 灯市口 | 1.486 | 褡裢坡 | 0.672 |
| 四惠 | 1.872 | 雍和宫 | 2.267 | 东单 | 1.877 | 青年路 | 1.315 |
| 国贸 | 3.515 | 东直门 | 1.529 | 崇文门 | 1.719 | 十里堡 | 0.788 |
| 永安里 | 2.187 | 朝阳门 | 2.305 | 磁器口 | 1.117 | 呼家楼 | 1.406 |
| 建国门 | 2.417 | 北京站 | 1.466 | 刘家窑 | 0.956 | 东大桥 | 1.599 |
| 王府井 | 2.098 | 前门 | 1.461 | 潞城 | 1.811 | 东四 | 1.160 |
| 复兴门 | 2.916 | 和平门 | 0.971 | 东夏园 | 1.584 | 北海北 | 1.272 |
| 木樨地 | 1.399 | 长椿街 | 1.091 | 郝家府 | 1.974 | 车公庄 | 1.495 |
| 万寿路 | 1.167 | 阜成门 | 1.400 | 草房 | 0.760 | 百子湾 | 1.503 |
| 五棵松 | 1.549 | 天通苑 | 0.569 | 常营 | 1.799 | 大郊亭 | 1.205 |
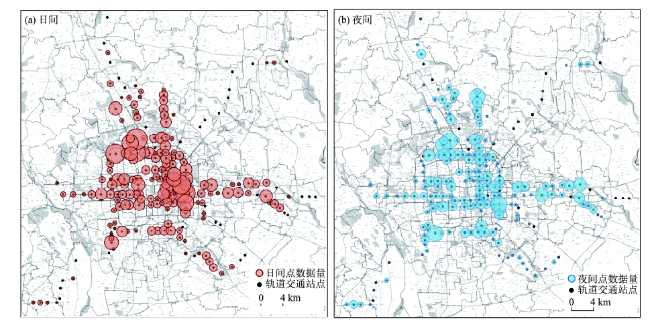
Fig.6 Spatial distribution of daytime and nighttime population within reasonable pedestrian catchment area of URT stations by "Yichuxing"图6 轨道站点合理步行范围内的“宜出行”人口昼夜空间分布 |
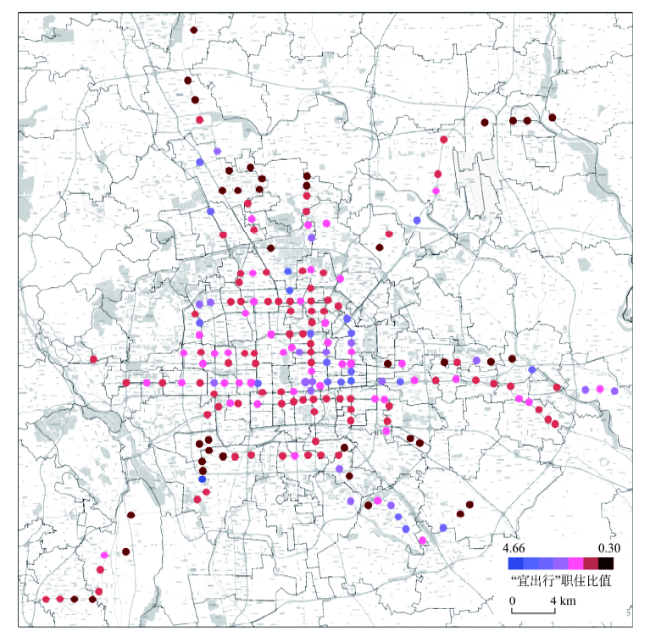
Fig.7 Jobs-housing ratio within reasonable pedestrian catchment area of URT stations by "Yichuxing"图7 轨道站点合理步行范围内的“宜出行”职住比 |
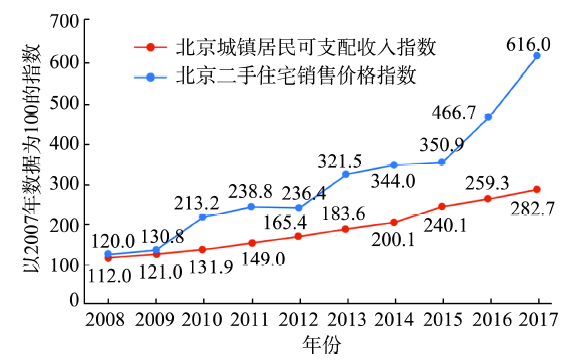
Fig.8 Comparison of exponential growth between resident income and housing price in Beijing图8 北京市居民收入与住宅价格的指数增长比较 |
Tab.6 Normal distribution test results of Jarque-Bera表6 误差正态性检验结果 |
| 参数 | jhbal | eibal | initial | transfer | exit | location | distance | facility | ingrass | egrass | jobs | housing |
|---|---|---|---|---|---|---|---|---|---|---|---|---|
| 平均值 | 0.27 | 0.62 | 0.05 | 0.17 | 3.47 | 12.45 | 1.62 | 0.19 | 50283.89 | 52567.85 | 0.09 | 0.42 |
| 中位值 | 0.11 | -0.21 | 0 | 0 | 3.00 | 10.41 | 1.40 | 0.00 | 35777.00 | 30156.00 | 0 | 0 |
| 最大值 | 3.66 | 16.74 | 1.00 | 1.00 | 9.00 | 34.95 | 5.25 | 1.00 | 231610.00 | 370124.00 | 1.00 | 1.00 |
| 最小值 | -0.70 | -0.92 | 0 | 0 | 1.00 | 0.95 | 0.78 | 0.00 | 960.00 | 382.00 | 0 | 0 |
| 标准偏差 | 0.61 | 2.35 | 0.22 | 0.38 | 1.40 | 7.96 | 0.75 | 0.39 | 42650.71 | 61332.01 | 0.29 | 0.49 |
| 偏度 | 1.85 | 3.54 | 4.20 | 1.76 | 1.13 | 0.83 | 1.96 | 1.59 | 1.89 | 2.27 | 2.82 | 0.33 |
| 峭度 | 8.32 | 19.47 | 18.65 | 4.09 | 5.03 | 2.91 | 7.38 | 3.52 | 7.25 | 9.27 | 8.94 | 1.11 |
| JB检测 | 360.57 | 2756.99 | 2708.54 | 116.31 | 78.99 | 23.77 | 297.46 | 88.65 | 277.33 | 513.91 | 575.96 | 34.44 |
| 或然率 | 0 | 0 | 0 | 0 | 0 | 0 | 0 | 0 | 0 | 0 | 0 | 0 |
| 总和 | 56.30 | 127.91 | 10.00 | 35.00 | 715.00 | 2565.41 | 334.73 | 39.00 | 10358481.00 | 10828978.00 | 19.00 | 86.00 |
| 总平方和 | 76.67 | 1128.15 | 9.51 | 29.05 | 401.33 | 12999.49 | 115.07 | 31.62 | 3.73E+11 | 7.71E+11 | 17.25 | 50.10 |
| 样本量 | 206 | 206 | 206 | 206 | 206 | 206 | 206 | 206 | 206 | 206 | 206 | 206 |
Tab.7 Regression result of jobs-housing ratio and station's egraess-ingraess ratio ratio表7 出进站比对职住比的回归结果 |
| 变量 | 相关系数 | 标准误差 | Z检验统计量 | 概率 |
|---|---|---|---|---|
| eibal | 0.1097 | 0.0149 | 7.3770 | <0.0001 |
| initial | -0.4282 | 0.0663 | -0.6458 | 0.5184 |
| transfer | 0.0171 | 0.0501 | 0.3412 | 0.7330 |
| exit | 0.0003 | 0.0129 | 0.0216 | 0.9828 |
| location | -0.0047 | 0.0026 | -1.8174 | 0.0692 |
| distance | 0.0900 | 0.0283 | 3.1866 | 0.0014 |
| facility | 0.0726 | 0.0407 | 1.7830 | 0.0746 |
| ingrass | <0.0001 | <0.0001 | -1.8911 | 0.0586 |
| egrass | <0.0001 | <0.0001 | 4.2743 | <0.0001 |
| jobs | 14.1867 | 2.0788 | 6.8246 | <0.0001 |
| housing | -6.0645 | 2.1116 | -2.8720 | 0.0041 |
The authors have declared that no competing interests exist.
| [1] |
北京市统计局. 2009—2018. 北京统计年鉴2009—2018 [M]. 北京: 中国统计出版社.
[Beijing Municipal Bureau of Statistics. 2009-2018. Beijing statistical yearbook 2009-2018. Beijing, China: China Statistics Press. ]
|
| [2] |
[
|
| [3] |
[
|
| [4] |
[
|
| [5] |
[
|
| [6] |
[
|
| [7] |
[
|
| [8] |
[
|
| [9] |
[
|
| [10] |
[
|
| [11] |
[
|
| [12] |
[
|
| [13] |
[
|
| [14] |
[
|
| [15] |
[
|
| [16] |
[
|
| [17] |
[
|
| [18] |
[
|
| [19] |
[
|
| [20] |
[
|
| [21] |
[
|
| [22] |
[
|
| [23] |
[
|
| [24] |
[
|
| [25] |
[Shen L F Wang Y,
|
| [26] |
[
|
| [27] |
[
|
| [28] |
[
|
| [29] |
[
|
| [30] |
[
|
| [31] |
[
|
| [32] |
[
|
| [33] |
[
|
| [34] |
[
|
| [35] |
[
|
| [36] |
[
|
| [37] |
[
|
| [38] |
[
|
| [39] |
[
|
| [40] |
|
| [41] |
|
| [42] |
|
| [43] |
|
| [44] |
|
| [45] |
|
| [46] |
|
| [47] |
|
| [48] |
|
| [49] |
|
| [50] |
|
/
| 〈 |
|
〉 |