
上海市外资研发机构的空间演化及区位因素
作者简介:何舜辉(1988-),男,福建漳州人,博士生,主研究方向为区域经济与创新发展研究,E-mail: shhe126@126.com。
收稿日期: 2017-11-07
要求修回日期: 2018-09-17
网络出版日期: 2018-11-28
基金资助
国家自然科学基金项目(41471108)
Spatial pattern evolution and location selection of foreign-affiliated research and development institutions in Shanghai
Received date: 2017-11-07
Request revised date: 2018-09-17
Online published: 2018-11-28
Supported by
National Natural Science Foundation of China, No.41471108
Copyright
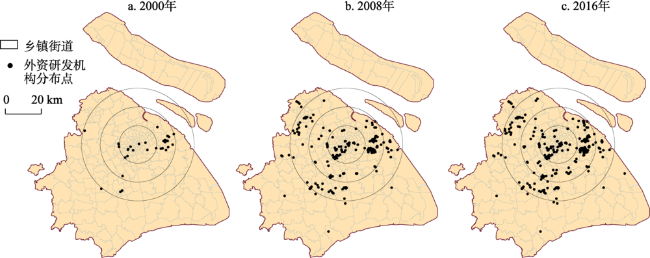
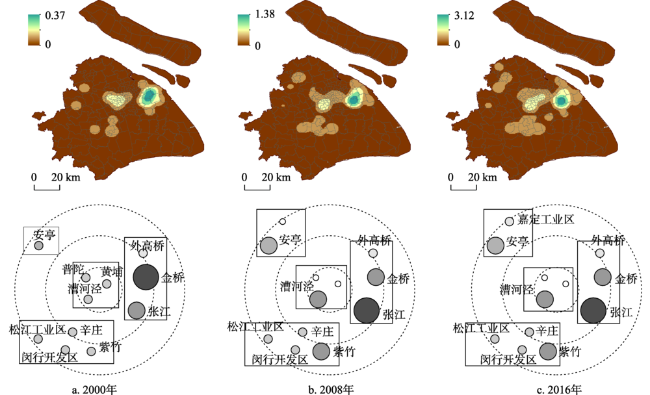
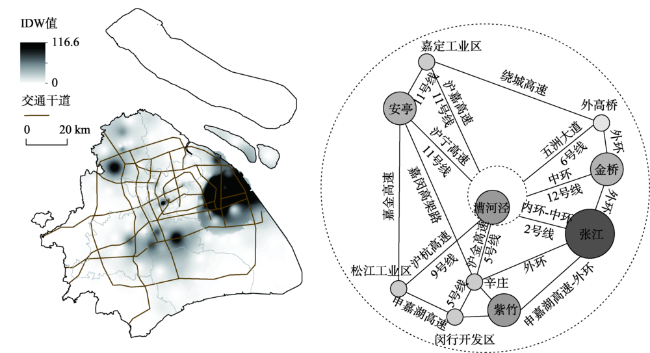
在总结上海外资研发机构发展历程的基础上,探讨其空间布局演化规律及区位因素,可为城市空间规划与研发产业布局提供借鉴。结果表明:①全域分散化趋势明显:距中心城区10~20 km范围的近郊区是外资研发机构分布的峰值圈层,随着时间推移,分布点向外围圈层扩散,中心城区集聚的倾向不显著。同时基于街道和区县统计的空间差异性逐渐缩小,空间分布趋于分散化。②局域聚焦特征显著:在不同方位形成少数不同等级的集聚区,即“张江—金桥—外高桥”东部集聚区、以漕河泾为主的中部集聚区、“紫竹—莘庄—闵行开发区—松江工业区”西南集聚区、“安亭—嘉定工业区”西北集聚区。从时序上看,这种多极引领的簇群式空间组织模式相对稳定,其中张江、漕河泾和紫竹园区的主导地位进一步强化。同时集聚区交通指向性明显,依托主干道与地铁交通网形成互动联结。③计量回归结果表明,传统区位因素(地租成本、交通通达性、资源要素)、集聚因素和制度因素对外资研发机构区位决策具有正向影响,且在不同发展阶段,对不同规模机构影响有所差异。归结起来,上海外资研发机构的空间演变机制亦是政府引导下的市场作用机制。
何舜辉 , 杜德斌 , 王俊松 . 上海市外资研发机构的空间演化及区位因素[J]. 地理科学进展, 2018 , 37(11) : 1555 -1566 . DOI: 10.18306/dlkxjz.2018.11.011
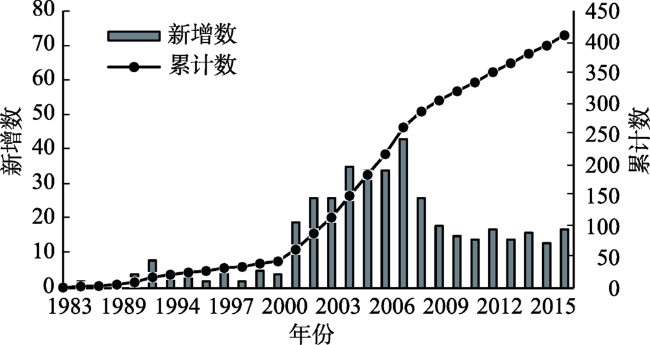
Using the location data of foreign-affiliated research and development (R&D) institutions in the metropolitan area of the city of shanghai, this study examined the spatial and temporal distribution and influencing factors of these institutions. Since the 1980s, foreign-affiliated R&D institutions in Shanghai have developed rapidly and three stages of development can be identified: the tentative period (1983-2000), the rapid expansion period (2001-2008), and the steady increasing period (2009-2016). Along with the increase in the number of institutions, the spatial layout showed the following characteristics: (1) A global decentralization trend was clear. The R&D institutions were concentrated in the near suburbs 10-20 km from the central city district. They eventually spread to outer suburban districts, which decreased the tendency toward the central city area. The statistical results show a gradually shrinking difference of the spatial heterogeneity between neighborhood-level units and county/district-level units. (2) Local area agglomeration characteristics were also clear. Several clusters of agglomeration are found in different districts in the suburb and outer suburb areas, namely the "Zhangjiang-Jinqiao-Waigaoqiao" eastern agglomeration area, the central agglomeration area dominated by Caohejing, the "Zizhu-Xinzhuang-Minhang Development Zone-Songjiang Industrial Zone" southwestern agglomeration area, and the "Anting-Jiading Industrial Zone" northwestern agglomeration area. During the study period, the multi-polar cluster distribution pattern was relatively stable, and the dominant positions of Zhangjiang, Caohejing, and the Zizhu Park have been further strengthened. The high concentration areas are connected by the main road and subway transportation network, which shows an obvious reliance on transportation. (3) The results of regression show that traditional location factors (rent costs, traffic accessibility, and resources), agglomeration factors, and institutional factors have strong impact on the location decision of foreign-affiliated R&D institutions, but the degree of influence also depends on their stage of development and size of the institutions. To sum up, the spatial evolution of foreign R & D institutions in Shanghai was resulted in market driving and administrative intervention mechanism.
Fig.1 The number of foreign-affiliated research and development (R&D) institutions in Shanghai, 1983-2016图1 1983-2016年上海外资研发机构数量变化 |
Fig.2 Distribution of foreign-affiliated research and development (R&D) institutions in Shanghai, 2000, 2008, and 2016图2 2000、2008和2016年上海外资研发机构空间分布点 |
Tab.1 Distribution of foreign-affiliated research and development (R&D) institutions in different zones, 2000-2016表1 2000-2016年外资研发机构不同距离圈层的分布情况 |
| 距离/km | 2000年 | 2008年 | 2016年 | |||||
|---|---|---|---|---|---|---|---|---|
| 数量 | 占比/% | 数量 | 占比/% | 数量 | 占比/% | |||
| 0~10 | 11 | 23.40 | 57 | 19.86 | 78 | 18.98 | ||
| 10~20 | 32 | 68.09 | 159 | 55.40 | 226 | 54.99 | ||
| 20~30 | 3 | 6.38 | 60 | 20.91 | 87 | 21.17 | ||
| >30 | 1 | 2.13 | 11 | 3.83 | 20 | 4.87 | ||
| 合计 | 47 | 100.00 | 287 | 100.00 | 411 | 100.00 | ||
Tab.2 Gini index, Theil index, and coeffecient of variation (CV) in different years表2 不同年份基尼系数、泰尔指数和变异系数 |
| 空间单元 | 差异指数 | 2000年 | 2005年 | 2010年 | 2016年 |
|---|---|---|---|---|---|
| 区县 | 基尼系数 | 0.80 | 0.70 | 0.68 | 0.68 |
| 泰尔指数 | 2.70 | 1.31 | 0.98 | 0.97 | |
| 变异系数 | 2.09 | 1.65 | 1.61 | 1.60 | |
| 乡镇街道 | 基尼系数 | 0.95 | 0.91 | 0.89 | 0.88 |
| 泰尔指数 | 31.67 | 10.87 | 7.13 | 6.68 | |
| 变异系数 | 5.34 | 4.81 | 4.76 | 4.72 |
Fig. 3 K-density distribution and cluster schematic diagrams in 2000, 2008 and 2016图3 2000、2008和2016年核密度图和示意图 |
Tab.3 Distribution of firms in the buffer areas of the main roads and subway lines, 2016表3 交通主干道与地铁线缓冲区内的企业分布情况(2016年) |
| 缓冲区范围/m | 交通类型 | 企业数量/个 | 比重/% |
|---|---|---|---|
| 500 | 地铁 | 112 | 27.3 |
| 主干道 | 153 | 37.2 | |
| 地铁+主干道 | 234 | 56.9 | |
| 1000 | 地铁 | 197 | 47.9 |
| 主干道 | 237 | 57.7 | |
| 地铁+主干道 | 302 | 73.5 |
Fig.4 Inverse distance weighted (IDW) clusters connected by the main transportation network, 2016图4 2016年热点区与交通网络联通示意图 |
Tab.4 Variables and definitions表4 变量和定义 |
| 自变量 | 定义 | 预计符号 | |
|---|---|---|---|
| 郊区区位 | CEN | 郊区化,街道辖区在中心城区赋值为1,否则赋值为0。 | + |
| 地租成本 | Road | 道路密度,道路密度越高,基础设施建设越完善,地租水平就越高,反之则反。 | - |
| 交通因素 | Airport | 到机场的最短距离,Airport=Min(T2, T3),T1、T2为各乡镇街道辖区中心点到虹桥机场距离和到浦东机场距离。 | - |
| Train | 到火车站的最短距离,Train=Min(X1, X2, X3),X1、X2和X3分别为各乡镇街道辖区中心点至上海火车站、虹桥火车站和上海南站的距离。 | - | |
| Subway | 地铁站数量,反映对内交通通达性。地铁数设定为乡镇街道辖区内第一个企业进入前一年与最后一个企业进入前一年地铁站点数的均值,对于辖区内没有企业进入的地区,地铁站点数按最近的地铁数计算。 | + | |
| 资源因素 | UNI | 高校邻近性,街道辖区到高校的最短距离,若有赋值为1,否则赋值为0。 | - |
| 制度因素 | DZ-1 | 国家级开发区偏好,街道辖区内有无国家级开发区,若有赋值为1,否则赋值为0。 | + |
| DZ-2 | 市级开发区偏好,街道辖区内有无市级开发区,若有赋值为1,否则赋值为0。 | + | |
| DZ-3 | 区县级开发区偏好,街道辖区内有无区县级开发区,若有赋值为1,否则赋值为0。 | + | |
| 集聚因素 | Cluster | 上一阶段各街道辖区的外资研发机构数量,反映既有集聚区对新进企业的吸引力。 | + |
Tab.5 Regression results of influencing factors and location choice表5 区位影响因素的回归结果 |
| 变量 | 模型1 | 模型2 | 模型3 | 模型4 | 模型5 | 模型6 | |||||
|---|---|---|---|---|---|---|---|---|---|---|---|
| 总体. | 小规模 | 大规模 | 2000年以前 | 2000-2008年 | 2009年以后 | ||||||
| CEN | -0.412* | -1.005*** | -0.693*** | -0.524* | |||||||
| Road | -0.024* | -0.001** | |||||||||
| Airport | -0.006** | -0.010*** | -0.012** | -0.011*** | -0.005* | ||||||
| Train | 0.003* | 0.007*** | 0.009** | 0.008*** | |||||||
| Subway | 0.125** | 0.129* | 0.270*** | 0.024*** | |||||||
| UNI | -0.056** | -0.089*** | -0.070** | -0.106** | -0.105*** | -0.049* | |||||
| DZ_1 | 0.953* | 1.434** | 2.949*** | 2.444*** | 2.017*** | ||||||
| DZ_2 | 1.348*** | 1.192*** | 1.629*** | 1.265** | 1.491*** | 1.777*** | |||||
| DZ_3 | -0.477*** | -0.439** | -0.562* | -1.091* | -0.578*** | -0.708*** | |||||
| Cluster | 0.216** | / | / | / | 0.181*** | ||||||
| _cons | 0.062 | -0.086 | -0.126 | -0.698 | 0.954 | -0.288 | |||||
| /lnalpha | 0.007 | -0.056 | 0.276 | 1.408 | -0.045 | -28.310 | |||||
| alpha | 1.007 | 0.945 | 1.318 | 4.086 | 0.956 | 0.000 | |||||
注:“*”,“**”和”***”分别表示在10%,5%和1%水平下显著;“/”表示未涉及项。 |
The authors have declared that no competing interests exist.
| [1] |
[
|
| [2] |
[
|
| [3] |
[
|
| [4] |
[
|
| [5] |
[
|
| [6] |
[
|
| [7] |
[
|
| [8] |
[
|
| [9] |
[
|
| [10] |
[
|
| [11] |
[
|
| [12] |
[
|
| [13] |
[
|
| [14] |
[
|
| [15] |
[
|
| [16] |
[
|
| [17] |
[
|
| [18] |
[
|
| [19] |
[
|
| [20] |
[
|
| [21] |
[
|
| [22] |
[
|
| [23] |
|
| [24] |
|
| [25] |
|
| [26] |
|
| [27] |
|
/
| 〈 |
|
〉 |