
基于互联网数据的住宿业竞争力及其空间格局——以武汉主城区高端酒店为例
作者简介:王娟(1985-),女,湖南长沙人,博士生,主要研究方向为城市旅游、旅游与区域发展,E-mail: sjjpwangjuan@126.com。
收稿日期: 2017-11-30
要求修回日期: 2018-04-03
网络出版日期: 2018-10-28
基金资助
国家自然科学基金项目(41601123,41601127)
中央高校基本科研业务费项目(CCNU16BG001)
Hotel competitiveness evaluation and spatial pattern based on Internet data: A case study of high-end hotels of Wuhan urban area
Received date: 2017-11-30
Request revised date: 2018-04-03
Online published: 2018-10-28
Supported by
National Natural Science Foundation of China, No.41601123, No.41601127
Fundamental Research Funds for the Central Universities, No.CCNU16BG001
Copyright
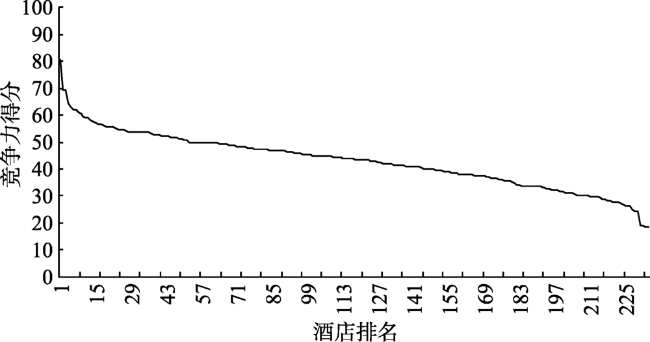
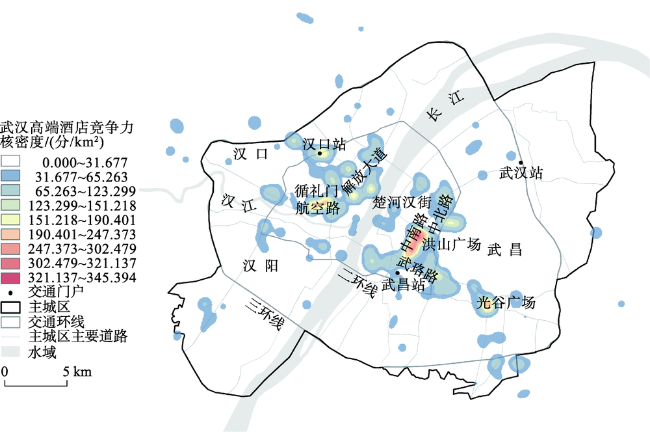
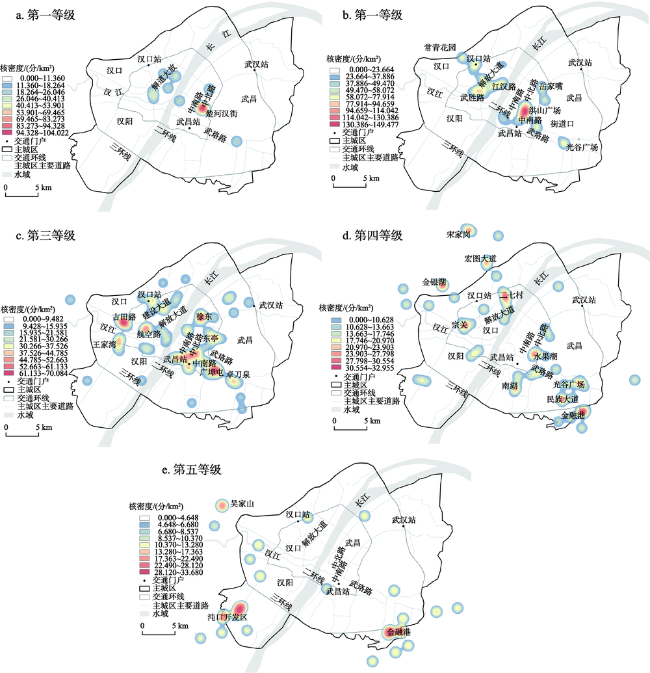
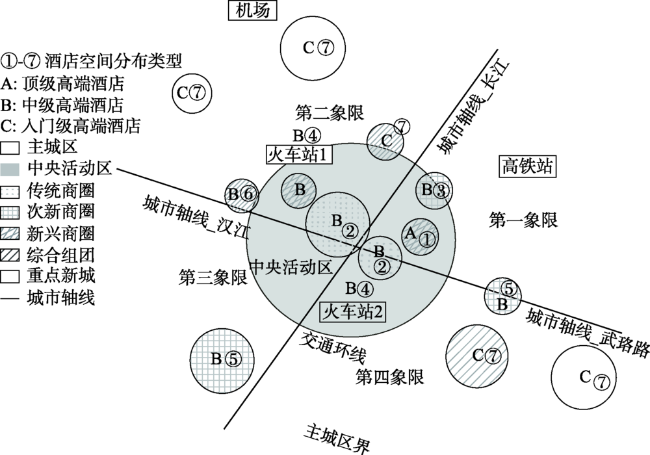
随着互联网的发展,利用互联网数据来研究城市实体空间问题成为城市地理学研究内容和研究方法的新切入点。本文基于互联网消费平台点评数据、互联网地图实时交通数据和城市兴趣点等数据,在建立住宿业竞争力评价指标体系的基础上,计算武汉主城区高端酒店竞争力得分和排名,并探求住宿业竞争力的空间分布特征和布局模式。研究发现:①武汉高端酒店竞争力得分总体较为集中。价格、人气、周边商业和商务服务是酒店之间竞争力差距的主要因素;②武汉高端酒店竞争力投射在空间上总体呈现点状聚集与线形延伸并存的格局,竞争力高分酒店主要集中在二环线内的武昌和汉口;③随着酒店竞争力等级的下降,酒店空间格局呈现由城市中心向四周递减的圈层式发展规律,高等级酒店大多出现在新兴商业区;④本文归纳了武汉主城区高端酒店竞争力空间分布模型,得出中央活动区新兴商圈顶级高端酒店、中央活动区传统商圈中级高端酒店、交通门户周边中级高端酒店等7种住宿业空间格局类型。
王娟 , 李亚娟 , 吕丽 , 胡静 , 张祥 . 基于互联网数据的住宿业竞争力及其空间格局——以武汉主城区高端酒店为例[J]. 地理科学进展, 2018 , 37(10) : 1405 -1415 . DOI: 10.18306/dlkxjz.2018.10.010
The rapid development of the Internet provides a new breakthrough point for urban geography research by using Internet data and technology to study urban physical space problems. Based on customer reviews and comments of online-to-offline (O2O) platform, real-time traffic data, and points of interest (POI) data of web-map, this study set up a competitiveness evaluation index system of high-end hotels and calculated the high-end hotel competitiveness and ranking of Wuhan urban area, then emphatically analyzed its spatial patterns using GIS tools. The results indicate that: (1) With most hotels in the middle and few in the top and bottom rankings, the competitiveness distribution line indicates a general concentrated structure. Price, popularity, business, and commerce services in the surroundings are the main factors that widen the competitiveness levels between hotels. (2) The overall spatial structure is featured by a mixture of point clustering and linear spread that basically concentrate in Wuchang and Hankou town areas within the second ring road. (3) As the competitiveness grades go down, hotels are more likely to locate toward the outskirt of the city, showing a circling spatial structure. (4) The spatial distribution model of Wuhan high-end hotels can be summarized as seven types of hotel spatial layout, such as super-high-end hotels located in the newly-developing business district in the central activity zone (CAZ), middle-leveled high-end hotels located in the traditional business district in the CAZ, and middle-leveled high-end hotels located around traffic gateways, and so on.
Key words: internet data; high-end hotels; competitiveness; spatial structure; Wuhan City
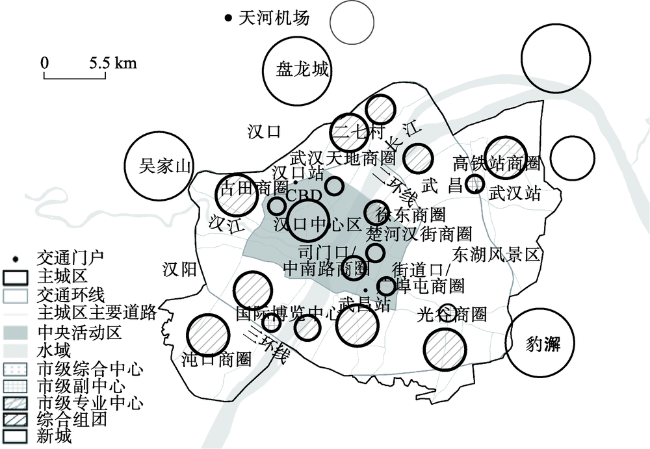
Fig.1 Distribution of high-end hotels in Wuhan City and the study area图1 武汉境内高端酒店分布及研究区域 |
Fig.2 Spatial structure of the study area图2 研究区域空间结构示意图 |
Tab.1 Evaluation index system of Wuhan high-end hotel competitiveness表1 武汉高端酒店竞争力评价指标体系 |
| 一级指标(权重) | 二级指标(权重) | 指标说明 |
|---|---|---|
| X1酒店价格(0.191) | X1-1房间起售价格(0.191) | 反映酒店的档次和消费水平 |
| X2酒店人气(0.108) | X2-1酒店点评数(0.108) | 酒店的总点评数 |
| X3酒店区位(0.247) | X3-1距离交通门户平均耗时(0.166) | 酒店距离机场、火车站的平均耗时 |
| X3-2 2 km内最近地铁站距离(0.063) | 酒店附近最近的地铁站到酒店的距离,2 km内无地铁站的此项得分为0 | |
| X3-3 2 km内热门景点数(0.018) | 酒店2 km内可达的热门景点数,包括旅游景点、城市公园、购物商圈等 | |
| X4酒店满意度(0.304) | X4-1五星好评占总评论数比例(0.06) | 五星好评数与全部点评数的比值 |
| X4-2房间评分(0.075) | 消费者对某酒店房间的打分 | |
| X4-3设施评分(0.009) | 消费者对某酒店设施的打分 | |
| X4-4环境评分(0.013) | 消费者对某酒店环境的打分 | |
| X4-5位置评分(0.031) | 消费者对某酒店位置的打分 | |
| X4-6服务评分(0.027) | 消费者对某酒店服务的打分 | |
| X4-7卫生评分(0.089) | 消费者对某酒店卫生的打分 | |
| X5酒店周边商业服务(0.045) | X5-1 1 km内购物中心/商业街数(0.035) | 酒店1 km缓冲区内购物中心/商业街的数量 |
| X5-2 1 km内大型超市数(0.007) | 酒店1 km缓冲区内大型超市的数量 | |
| X5-3 500 m内品牌便利店数(0.003) | 酒店500 m缓冲区内购品牌便利店的数量 | |
| X6酒店周边商务服务(0.051) | X6-1 1 km内商务大厦数(0.028) | 酒店1 km缓冲区内商务大厦/写字楼的数量 |
| X6-2 1 km内企事业单位数(0.011) | 酒店1 km缓冲区内企事业单位的数量 | |
| X6-3 1 km内金融机构数(0.012) | 酒店1 km缓冲区内金融机构的数量 | |
| X7其他因素(0.054) | X7-1酒店所属集团排名(0.038) | HOTELS杂志公布的“2016年度全球酒店集团排名”,若未上榜,则此项得分为0 |
| X7-2酒店客房数(0.01) | 酒店拥有的房间数 | |
| X7-3开业或装修时间(0.006) | 酒店最近一次装修时间,开业后未重新装修的即为开业时间 |
Fig.3 Distribution of competitiveness score of the high-end hotels in Wuhan urban area图3 武汉高端酒店竞争力得分分布曲线 |
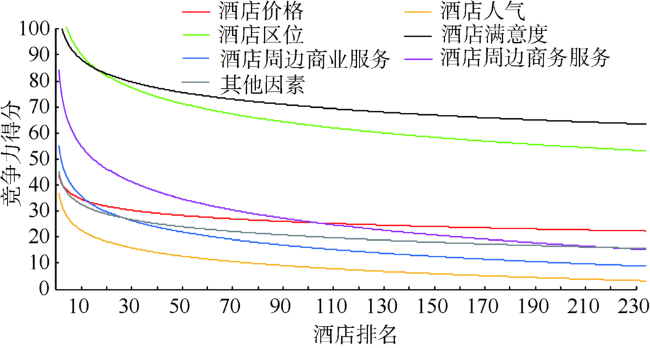
Fig.4 Trends of competitiveness indicator scores of Wuhan high-end hotels图4 武汉高端酒店竞争力一级指标得分趋势图 |
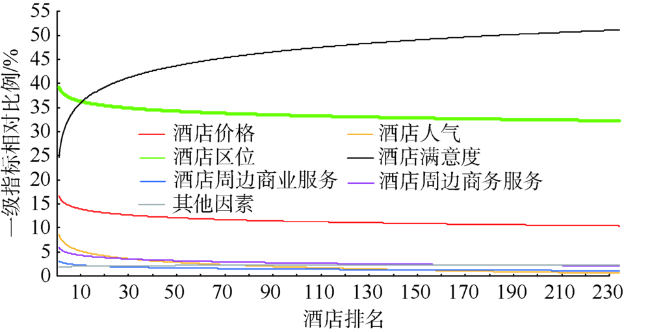
Fig.5 Trends of relative competitiveness indicator scores of Wuhan high-end hotels图5 武汉高端酒店竞争力一级指标得分相对比例趋势图 |
Tab.2 Grading of Wuhan high-end hotel competitiveness表2 武汉高端酒店竞争力得分等级 |
| 酒店等级 | 酒店个数 | 最大值 | 最小值 | 平均值 | 标准差 |
|---|---|---|---|---|---|
| 第一等级 | 17 | 80.584 | 56.729 | 62.080 | 6.110 |
| 第二等级 | 62 | 56.073 | 47.408 | 51.382 | 2.512 |
| 第三等级 | 65 | 47.353 | 40.705 | 44.123 | 2.017 |
| 第四等级 | 53 | 40.225 | 32.220 | 36.473 | 2.459 |
| 第五等级 | 37 | 32.048 | 18.256 | 27.781 | 3.793 |
| 总计 | 234 | 80.584 | 18.256 | 43.034 | 10.028 |
Fig.6 Nuclear density of competitiveness scores of high-end hotels in Wuhan urban area图6 武汉高端酒店竞争力得分空间分布图 |
Fig.7 Nuclear density of competitiveness of five classes high-end hotels in Wuhan urban area图7 武汉主城区高端酒店竞争力各等级核密度 |
Fig.8 Distribution model of high-end hotels based on competitiveness in Wuhan urban area图8 基于竞争力的武汉高端酒店空间分布模型 |
The authors have declared that no competing interests exist.
| [1] |
[
|
| [2] |
[
|
| [3] |
[
|
| [4] |
[
|
| [5] |
[
|
| [6] |
[
|
| [7] |
[
|
| [8] |
[
|
| [9] |
[
|
| [10] |
[
|
| [11] |
[
|
| [12] |
[
|
| [13] |
[
|
| [14] |
[
|
| [15] |
[
|
| [16] |
[
|
| [17] |
[
|
| [18] |
|
| [19] |
|
| [20] |
|
| [21] |
|
| [22] |
|
| [23] |
|
| [24] |
|
| [25] |
|
/
| 〈 |
|
〉 |
