
2000年以来长江经济带城市职能结构演变特征及战略思考
作者简介:王振波(1980-),男,山东禹城人,博士,助研,主要研究方向为城市化与生态环境效应,E-mail: wangzb@igsnrr.ac.cn。
网络出版日期: 2015-11-25
基金资助
2015年中国科学院学部咨询评议项目“长江经济带重大战略问题研究”
国家自然科学基金重大项目(41590840,41590842)
国家自然科学基金重点项目(71433008)
国家自然科学基金项目(41371177,41201168)
Characteristics of change and strategic considerations of the structure of urban functional divisions in the Yangtze River Economic Belt since 2000
Online published: 2015-11-25
Copyright
基于城市职能的专业化部门、职能规模和职能强度三要素,利用全国第五次和第六次人口普查数据,分析了2000-2010年长江经济带城市职能结构与演变特征。结果显示:①工业、建筑业、商业、房地产、科研和其他服务业部门是长江经济带的基本职能部门;②长三角地区是长江经济带的工业重心,城市群和大城市的工业化进程显著,产业梯度转移已经取得显著效果,但尚缺少国家层面分区分级的调控引导机制,生态环境安全面临巨大压力;③建筑和房地产业职能正在由下游向上中游转移,并拉动包括商业、科研、金融、社会服务、其他服务业等生产性和生活性服务业的迅猛发展,但城市产业同构现象严重,中心城市集聚能力不足;④交通通信业职能下降,难以支撑长江经济带国家战略的顺利实施。针对以上特征与问题,建议以管理机制创新培育流域一体化城市(群)职能分工体系,以流域产业准入标准保障协同发展的绿色城市职能体系,以城市群战略和国家级新区链接城市职能互协互补网络体系,以长江经济带综合立体交通走廊优化沿江城市资源配置格局。
王振波 , 罗奎 , 宋洁 , 徐建斌 . 2000年以来长江经济带城市职能结构演变特征及战略思考[J]. 地理科学进展, 2015 , 34(11) : 1409 -1418 . DOI: 10.18306/dlkxjz.2015.11.008
Based on the data from China's Fifth and Sixth Census, this article analyzes the urban functional divisions and its change in the cities of the Yangtze River Economic Belt (YREB) from 2000 to 2010 with respect to the specialized sectors, scale, and degree of intensification. The results show that, (1) the basic urban functions of YREB include manufacturing, construction, commerce, real estate, scientific research and other services. (2) Yangtze River Delta Area prominently featured by city agglomeration and metropolitan industrialization, is the industrial center of YREB; And there are great achievements in industrial gradient transfer but lack of national level regulatory guidance mechanism by districts or levels, thus causing great pressure in eco-environmental protection. (3) Construction and real estate industrial functions are transferring from the cities in the lower-reach of the Yangtze River Basin to the cities in the middle- and upper-reaches, and propelling rapid and strong development of producer and consumer services including commerce, scientific research, finance, social and other services. However, there are problems such as serious urban industrial isomorphism and insufficient agglomeration of central cities. (4) It is difficult for the function declining of transportation and communication industries to support the smooth implementation of the National Strategy of YREB. Based on the above discussed problems, the innovative management mechanism is proposed to foster an integrated system of urban functional divisions for river basin development; the river industrial standards for access are recommended to ensure the coordinated development of green city functional system; the new national level districts and urban agglomerations are suggested to serve as the complementary approach to make the urban functional system more comprehensive, and the multi-modal transport corridor of YRBE could be used to enable the optimization of resource allocation along the Yangtze River.
Tab.1 Functional divisions based on the Fifth and the Sixth Census of China表1 “五普”和“六普”的行业指标的归并处理 |
| 职能部门归并 | 五普部门指标 | 六普部门指标 |
|---|---|---|
| 矿业职能 | 采掘业 | 采矿业 |
| 工业职能 | 制造业 | 制造业 |
| 电力、煤气及水的生产和供应业 | 电力、燃气及水的生产和供应业 | |
| 建筑业职能 | 建筑业 | 建筑业 |
| 交通通信职能 | 交通运输、仓储及邮电通信业 | 仓储和邮政业 |
| 交通运输、计算机服务和软件业 | ||
| 商业职能 | 批发和零售贸易、餐饮业 | 信息传输、批发和零售业 |
| 住宿和餐饮业 | ||
| 金融业职能 | 金融保险业 | 金融业 |
| 房地产业职能 | 房地产业 | 房地产业 |
| 科研管理职能 | 地质勘查业、水利管理业 | 科学研究、技术服务和地质勘查业 |
| 科学研究和综合技术服务业 | 水利、环境和公共设施管理业 | |
| 行政职能 | 国家机关、政党机关和社会团体 | 公共管理和社会组织 |
| 国际组织 | ||
| 社会服务职能 | 卫生、体育和社会福利业 | 教育 |
| 卫生、社会保障和社会福利业 | ||
| 教育、文化艺术及广播电视电影业 | 文化、体育和娱乐业 | |
| 其他服务职能 | 社会服务业 | 租赁和商务服务业 |
| 其他行业 | 居民服务和其他服务业 |
Tab.2 The location entropy of functional divisions of the Yangtze River Economic Belt (YREB), 2000-2010表2 2000-2010年长江经济带城市职能部门区位熵 |
| 年份 | 基本职能 | 非基本职能 | ||||||||||
|---|---|---|---|---|---|---|---|---|---|---|---|---|
| 工业 | 商业 | 建筑 | 房地产 | 科研 | 其他服务 | 交通通信 | 社会服务 | 行政 | 矿业 | 金融 | ||
| 2000 | 0.97 | 0.93 | 1.03 | 0.84 | 0.86 | 0.94 | 0.93 | 0.93 | 0.82 | 0.63 | 0.87 | |
| 2010 | 1.09 | 1.05 | 1.20 | 1.02 | 1.01 | 1.05 | 0.95 | 0.94 | 0.89 | 0.58 | 0.92 | |
| 差值 | 0.12 | 0.12 | 0.17 | 0.18 | 0.15 | 0.11 | 0.02 | 0.01 | 0.07 | -0.05 | 0.05 | |
注:基于五普、六普分县数据整理。 |
Tab.3 Number of specialized sectors in cities of the Yangtze River Economic Belt (YREB), 2000-2010表3 2000-2010年长江经济带城市专业化部门的城市数量动态演变 |
| 区域 | 基本职能 | 非基本职能 | ||||||||||
|---|---|---|---|---|---|---|---|---|---|---|---|---|
| 工业 | 商业 | 建筑 | 房地产 | 科研 | 其他服务 | 交通通信 | 社会服务 | 行政 | 矿业 | 金融 | ||
| 下游 | 74/81 | 53/50 | 83/77 | 31/40 | 24/35 | 40/50 | 38/22 | 28/23 | 24/19 | 7/6 | 29/32 | |
| 中游 | 21/27 | 27/36 | 23/37 | 21/23 | 26/23 | 30/34 | 24/31 | 30/27 | 28/30 | 14/11 | 30/29 | |
| 上游 | 7/5 | 13/21 | 14/32 | 12/22 | 18/24 | 15/22 | 13/14 | 8/23 | 10/23 | 10/10 | 10/18 | |
| 长江经济带 | 102/113 | 93/107 | 120/146 | 64/85 | 68/82 | 85/106 | 75/67 | 66/73 | 62/72 | 31/27 | 69/79 | |
注:基于五普、六普分县数据整理;表中数据“/”前后分别为2000、2010年城市数据。 |
Tab.4 Percentage of employment in specialized sectors in China and the Yangtze River Economic Belt (YREB), 2000-2010表4 2000-2010年长江经济带城市和全国行业就业人口比重对比表 |
| 区域 | 年份 | 基本职能/% | 非基本职能/% | ||||||||||
|---|---|---|---|---|---|---|---|---|---|---|---|---|---|
| 工业 | 商业 | 建筑 | 房地产 | 科研 | 其他服务 | 交通通信 | 社会服务 | 行政 | 矿业 | 金融 | |||
| 长江经济带 | 2000 | 18.60 | 8.93 | 3.80 | 0.24 | 0.41 | 3.21 | 3.38 | 4.12 | 2.65 | 1.19 | 0.79 | |
| 2010 | 22.17 | 14.34 | 7.24 | 0.70 | 0.74 | 3.08 | 4.64 | 4.41 | 3.02 | 1.12 | 0.92 | ||
| 差值 | 3.57 | 5.41 | 3.44 | 0.46 | 0.34 | -0.13 | 1.26 | 0.29 | 0.37 | -0.07 | 0.13 | ||
| 全国平均 | 2000 | 17.23 | 9.38 | 3.64 | 0.29 | 0.49 | 3.53 | 3.95 | 4.70 | 3.42 | 2.18 | 0.94 | |
| 2010 | 18.17 | 14.17 | 6.01 | 0.69 | 0.82 | 3.06 | 5.26 | 4.81 | 3.54 | 2.12 | 1.04 | ||
| 差值 | 0.94 | 4.79 | 2.37 | 0.40 | 0.33 | -0.47 | 1.31 | 0.11 | 0.12 | -0.06 | 0.10 | ||
注:基于五普、六普分县数据整理。 |
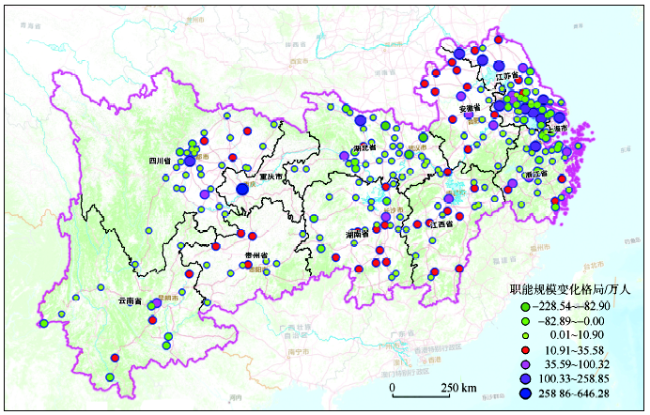
Fig.1 Spatial pattern of change in the scale of urban functional divisions of the Yangtze River Economic Belt (YREB), 2000-2010图1 2000-2010年长江经济带城市职能规模变化的空间格局 |
Tab.5 Change in degree of intensification of the urban functional divisions of the Yangtze River Economic Belt (YREB), 2000-2010表5 2000-2010年长江经济带城市职能强度变化 |
| 区域 | 职能强度等级 | 基本职能 | 非基本职能 | ||||||||||
|---|---|---|---|---|---|---|---|---|---|---|---|---|---|
| 工业 | 商业 | 建筑 | 房地产 | 科研 | 其他服务 | 交通通信 | 社会服务 | 行政 | 矿业 | 金融 | |||
| 下游 | 低专业化 | -7 | -6 | 4 | 7 | 4 | 14 | -10 | -6 | -3 | 0 | 9 | |
| 中专业化 | 9 | 6 | -13 | 5 | 7 | -5 | -4 | 4 | 0 | -1 | -2 | ||
| 高专业化 | 5 | -3 | 3 | -3 | 0 | 1 | -2 | -3 | -2 | 0 | -4 | ||
| 中游 | 低专业化 | 5 | 3 | 2 | 4 | -3 | 15 | 4 | -4 | -2 | -4 | 2 | |
| 中专业化 | 1 | -7 | 6 | -3 | -1 | -8 | 3 | -3 | 1 | 1 | 2 | ||
| 高专业化 | 0 | 13 | 6 | 1 | 1 | -3 | 0 | 4 | 3 | 0 | -5 | ||
| 上游 | 低专业化 | -2 | 2 | 5 | 7 | 2 | 7 | 0 | 11 | 2 | -1 | 8 | |
| 中专业化 | 0 | 3 | 10 | 1 | 2 | 1 | 2 | 3 | 9 | 1 | -2 | ||
| 高专业化 | 0 | 3 | 3 | 2 | 2 | -1 | -1 | 1 | 2 | 0 | 2 | ||
| 长江经济带 | 低专业化 | -4 | -1 | 11 | 18 | 3 | 36 | -6 | 1 | -3 | -5 | 19 | |
| 中专业化 | 10 | 2 | 3 | 3 | 8 | -12 | 1 | 4 | 10 | 1 | -2 | ||
| 高专业化 | 5 | 13 | 12 | 0 | 3 | -3 | -3 | 2 | 3 | 0 | -7 | ||
注:基于五普、六普分县数据整理。 |
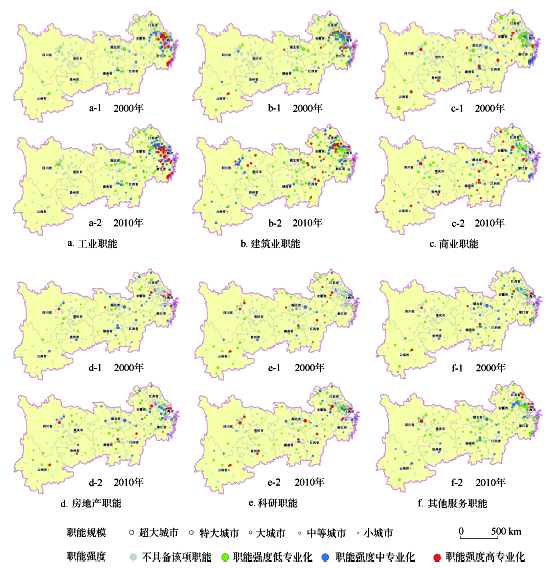
Fig.2 Spatial variation of basic specialized sectors of cities in the Yangtze River Economic Belt (YREB), 2000-2010图2 2000-2010年长江经济带城市基本职能部门的空间演变格局 |
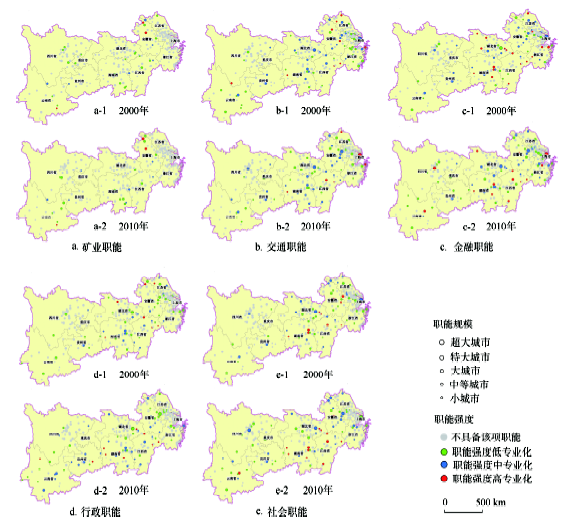
Fig.3 Spatial variation of non-basic specialized sectors of cities in the Yangtze River Economic Belt (YREB), 2000-2010图3 2000-2010年长江经济带城市非职能部门的空间演变格局 |
The authors have declared that no competing interests exist.
| 1 |
[
|
| 2 |
[
|
| 3 |
[
|
| 4 |
[
|
| 5 |
[
|
| 6 |
[
|
| 7 |
[
|
| 8 |
[
|
| 9 |
[
|
| 10 |
|
| 11 |
|
| 12 |
|
| 13 |
|
| 14 |
|
| 15 |
|
| 16 |
|
/
| 〈 |
|
〉 |