
基于物流热度的中国物流业空间格局
作者简介:李国旗(1984-),男,江西南昌人,讲师,博士,在站博士后,主要研究方向为物流系统规划与设计、交通物流地理,E-mail:guoqi_li@126.com。
网络出版日期: 2015-06-17
基金资助
国家自然科学基金项目(41171107)
中央高校基本科研业务费专项资金项目(2682014CX102,2682013BR020)
四川省软科学研究计划项目(2014ZR0065,2014ZR0032)
Spatial patterns of logistics industry based on a geographic analysis of hotness degree
Online published: 2015-06-17
Copyright
物流业空间格局是以物流设施为核心的物流实体网络和以物流企业为核心的物流组织网络在地表空间形态及结构。为研究中国物流业空间格局的现状及演变趋势,2014年8月利用百度在线地图搜索与数据采集技术,获取了中国大陆31个省级行政单位的80507个物流热度数据样本。通过物流热度与相关指标间的回归分析,构建了物流热度的理论计算公式,验证物流热度数据的有效性和合理性。从地级市、省域、城市群、经济区尺度,刻画和分析物流服务能力与水平、辐射范围的差异所形成的空间格局,探究经济发展水平、物流园区建设对物流业空间格局演变的影响,提出基于物流热度的物流中心城市。研究表明:物流热度与地区生产总值、交通运输、仓储及邮政业法人单位数呈正相关;经济发展整体水平越高的城市群地区,物流业一体化程度越高;物流设施和物流企业的布局具有显著的产业性需求与交通区位指向特征,并逐步表现出消费性需求与人口指向特征;东部沿海地区呈现“单主中心+多副中心”、“多主中心+多副中心”的空间格局,中西部地区呈现“单中心”的空间格局,地区差异显著。研究结果有助于物流业规划及物流政策的制定。
李国旗 , 金凤君 , 陈娱 , 刘思婧 . 基于物流热度的中国物流业空间格局[J]. 地理科学进展, 2015 , 34(5) : 629 -637 . DOI: 10.11820/dlkxjz.2015.05.011
:Spatial patterns of logistics industry is formed by the spatial distribution and structure of logistics facilities and enterprises. In order to examine the current situation and change of spatial patterns of logistics industry in China, we put forward the concepts of "logistics hotness degree "and "primacy index of cities." In August 2014, we obtained 80507 samples of logistics hotness degree data at the prefecture level or above in China based on "logistics" key word search using Baidu maps (excluding Hong Kong, Macao, and Taiwan). Through establishing an index of logistics hotness degree, the correlation between logistics hotness degree and indicators were analyzed. This article presents the construction of the logistics hotness degree index and demonstrates the effectiveness and validity of Internet-based data on logistics industry. Spatial patterns of logistics industry are analyzed in terms of capacity, level of service, and spatial influence at the prefecture,provincial, metropolitan area, and economic zone scales. We explored the impact of economic development and logistics park construction on the evolution of the spatial patterns of logistics industry. Logistics centers were identified and compared to the national and regional logistics hub cities designated in the "Logistics Industry Restructuring and Revitalization Plan" issued by the State Council and the "National Logistics Park Development Planning" issued by the National Development and Reform Commission and 11 other ministries. Some conclusions can be drawn as follows: the logistics hotness degree information is a comprehensive representation of logistics facilities and logistics enterprises.It is highly correlated with GDP, number of primary industry corporation units in transportation, warehousing, and postal services. Economic development level is highly correlated with logistics industry development. The spatial layout of logistics facilities and enterprises is significant correlated with industrial demand and their locations in the transport system; and it increasingly influenced by the of consumption demand and distribution and socioeconomic conditions of population. In the eastern coastal region of China, logistics industry distribution shows the spatial characteristics of "single-center and multiple sub-centers" or "multiple-centers and multiple sub-centers." In the central and western regions, however, the spatial pattern of distribution is characterized by "single -centers," which shows a clear regional difference from the coastal region. The result of this research may provide some guidance for logistics plann ing and logistics industrial policy of the central and regional governments for the thirteenth Five-Year Plan period and beyond.
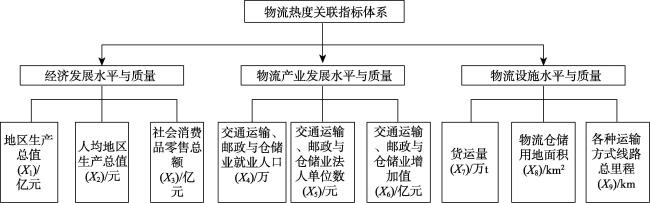
Fig.1 Index system of logistics hotness degree图1 物流热度的关联指标体系 |
Tab.1 Primacy index of logistics, economic activity, and population based on logistics hotness degree in central cities/%表1 基于物流热度的中心城市的物流、经济、人口首位度/% |
| 城市 | 物流热度 | 经济总量 | 常住人口 | 城市 | 物流热度 | 经济总量 | 常住人口 | 城市 | 物流热度 | 经济总量 | 常住人口 |
|---|---|---|---|---|---|---|---|---|---|---|---|
| 哈尔滨 | 41.86 | 29.98 | 27.76# | 银川 | 46.67 | 49.16 | 31.62 | 宁波* | 24.7 | 18.99 | 13.95 |
| 通辽* | 15.88 | 10.65 | 12.64# | 西宁 | 73.04 | 44.94 | 39.21 | 长沙 | 37.94 | 28.89 | 10.77 |
| 乌鲁木齐 | 32.71 | 26.58 | 14.97# | 青岛* | 20.20 | 14.60 | 9.16 | 南昌 | 24.79 | 23.17 | 11.39 |
| 长春 | 47.78 | 37.32 | 27.95** | 拉萨 | 56.10 | 37.10 | 18.58# | 昆明 | 46.88 | 29.21 | 14.02 |
| 沈阳 | 33.43 | 22.66 | 18.75 | 郑州 | 31.02 | 18.75 | 9.60 | 贵阳 | 36.99 | 24.81 | 12.78 |
| 兰州 | 34.57 | 27.68 | 14.12# | 苏州* | 18.20 | 22.22 | 13.32 | 厦门* | 31.77 | 14.30 | 9.79 |
| 保定* | 18.51 | 10.50 | 15.57# | 合肥 | 29.05 | 24.19 | 12.65 | 南宁 | 31.20 | 19.20 | 14.50 |
| 太原 | 29.00 | 19.08 | 11.79 | 成都 | 50.16 | 34.09 | 17.56 | 广州 | 25.39 | 23.75 | 12.12 |
| 西安 | 48.52 | 30.21 | 22.79 | 武汉 | 48.75 | 35.97 | 17.51 | 海口 | 54.86 | 28.67 | 24.14 |
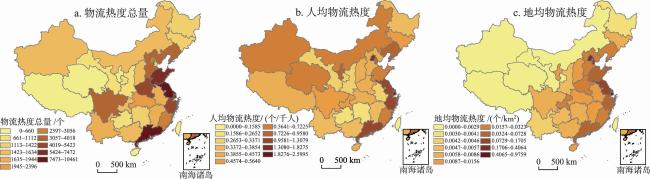
Fig.2 Distribution pattern of logistics hotness degree in prefectural-level cities图2 地级市尺度的物流热度分布格局 |
Fig.3 Provincial-level distribution pattern of logistics hotness degree图3 省域尺度的物流热度空间分布格局 |
Tab.2 Correlation coefficients of logistics hotness degree and indicators表2 物流热度与主要关联指标的相关系数 |
| 相关系数 | P值 | 标准误差 | 相关系数 | P值 | 标准误差 | ||
|---|---|---|---|---|---|---|---|
| X1 | 0.9270 | <0.0001 | 910.679 | X6 | 0.8194 | <0.0001 | 1391.790 |
| X2 | 0.4631 | 0.0087 | 2151.779 | X7 | 0.6149 | 0.0002 | 1914.555 |
| X3 | 0.9302 | <0.0001 | 891.010 | X8 | 0.4787 | 0.0064 | 2131.502 |
| X4 | 0.8040 | <0.0001 | 1443.656 | X9 | 0.2925 | 0.1103 | 2321.605 |
| X5 | 0.9281 | <0.0001 | 903.672 | - | - | - | - |
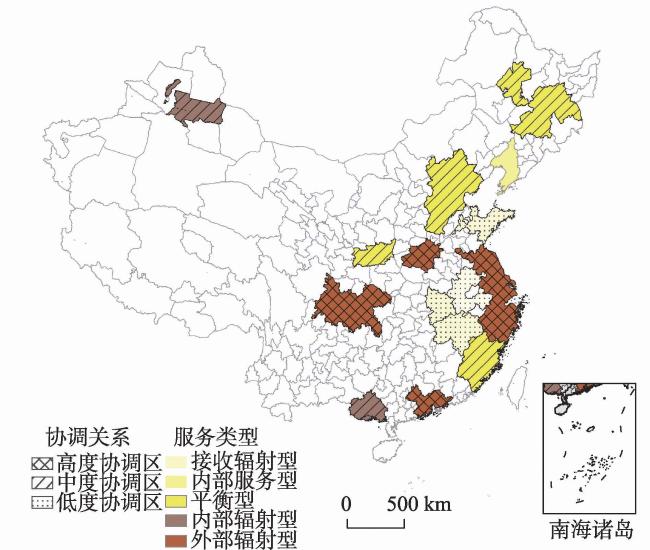
Fig.4 Distribution pattern of logistics service types and assessment in metropolitan areas based on logistics hotness degree图4 基于物流热度的城市群物流服务类型与协调关系分区 |
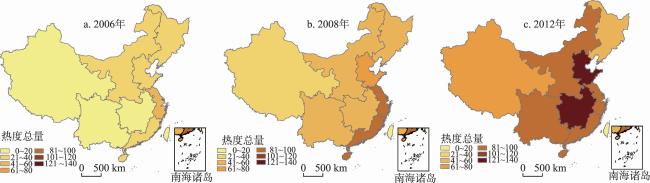
Fig.5 Distribution pattern and evolution of logistics parks in eight major economic zones of China图5 中国各经济区物流园区分布格局演变图 |
Tab.3 Number of logistics parks in major economic zones and their relation with logistics hotness degree表3 分经济区物流园区数量与物流热度的相关性 |
| 2006 | 2008 | 2012 | ||||||||||||
|---|---|---|---|---|---|---|---|---|---|---|---|---|---|---|
| 总量 | 运营 | 建设 | 规划 | 总量 | 运营 | 建设 | 规划 | 总量 | 运营 | 建设 | 规划 | |||
| 东北经济区 | 21 | 4 | 12 | 5 | 48 | 18 | 24 | 6 | 56 | 26 | 23 | 7 | ||
| 北部沿海经济区 | 28 | 10 | 8 | 10 | 67 | 22 | 29 | 16 | 128 | 88 | 35 | 5 | ||
| 东部沿海经济区 | 52 | 11 | 11 | 30 | 97 | 32 | 41 | 24 | 93 | 65 | 14 | 14 | ||
| 南部沿海经济区 | 36 | 8 | 9 | 19 | 96 | 25 | 31 | 40 | 83 | 52 | 25 | 6 | ||
| 西南经济区 | 17 | 3 | 8 | 8 | 56 | 3 | 36 | 17 | 98 | 28 | 41 | 29 | ||
| 西北经济区 | 13 | 1 | 1 | 11 | 21 | 3 | 8 | 10 | 64 | 14 | 25 | 25 | ||
| 黄河中游经济区 | 21 | 6 | 7 | 8 | 47 | 7 | 25 | 15 | 93 | 35 | 47 | 11 | ||
| 长江中游经济区 | 17 | 7 | 9 | 1 | 43 | 12 | 25 | 6 | 139 | 40 | 31 | 68 | ||
| 相关系数 | 0.93 | 0.87 | 0.52 | 0.79 | 0.93 | 0.82 | 0.84 | 0.67 | 0.29 | 0.81 | -0.32 | 0.64 | ||
The authors have declared that no competing interests exist.
| 1 |
[
|
| 2 |
[
|
| 3 |
[
|
| 4 |
[
|
| 5 |
[
|
| 6 |
[
|
| 7 |
[
|
| 8 |
[
|
| 9 |
[
|
| 10 |
[
|
| 11 |
[
|
| 12 |
|
| 13 |
[
|
| 14 |
[
|
| 15 |
|
| 16 |
|
| 17 |
|
| 18 |
|
| 19 |
|
| 20 |
|
| 21 |
|
| 22 |
|
| 23 |
|
| 24 |
Van Den Heuvel F P,
|
| 25 |
|
| 26 |
注:*表示非省会城市;**表示第六次人口普查数据;#表示2011年数据.
|
/
| 〈 |
|
〉 |
