
过去百年青海和西藏耕地空间格局重建及其时空变化
作者简介:李士成(1989-),男,山东费县人,博士生,主要从事土地利用与土地覆被变化研究,E-mail: lisc.10s@igsnrr.ac.cn。
网络出版日期: 2015-03-23
基金资助
中国科学院战略性先导科技专项(XDB03030500)
国家自然科学基金项目(41371120,41271227)
Reconstruction of cropland distribution in Qinghai and Tibet for the past one hundred years and its spatiotemporal changes
Online published: 2015-03-23
Copyright
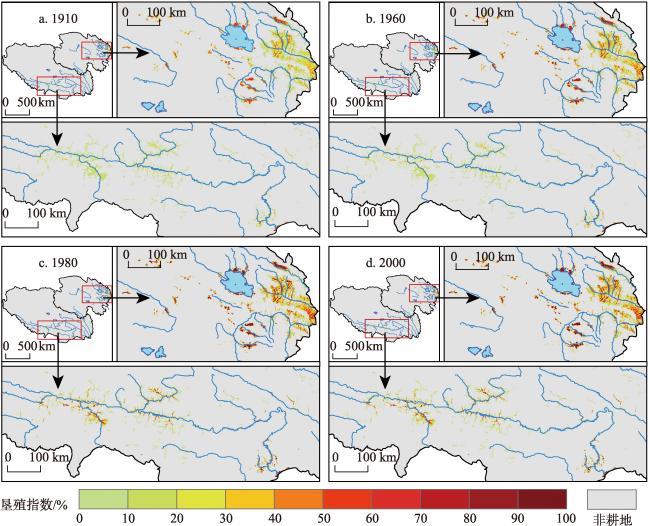
网格化的历史土地利用/覆被数据集,可为历史气候变化和碳循环研究提供基础数据。本文估算了1910年,并订正了1950-2000年青海和西藏的省域耕地面积数据;基于现代耕地空间格局,量化了海拔高程和地面坡度与耕地空间分布之间的关系,构建了历史耕地网格化重建模型。将1910、1960、1980和2000年的省域耕地面积数据带入网格化重建模型,得到了4个时间断面的耕地空间格局。结果表明:青藏两省耕地面积1910-1950年稳定,1950-1980年快速增加,1980-2000年基本稳定,略有降低。就空间格局而言,1960-1980年,河湟谷地和“一江两河”地区土地开垦范围的扩张和垦殖强度的增长在过去百年最为明显。模型检验表明,模型重建的2000年耕地空间格局与2000年遥感数据相关系数达0.92。
李士成 , 张镱锂 , 何凡能 . 过去百年青海和西藏耕地空间格局重建及其时空变化[J]. 地理科学进展, 2015 , 34(2) : 197 . DOI: 10.11820/dlkxjz.2015.02.008
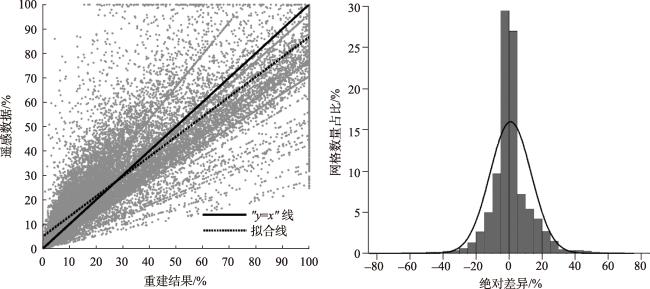
Since numerical simulation has become a popular method for studying the effects of land use and land cover change on climate and environment, spatially explicit historical cropland datasets are increasingly required in regional and global climate change and carbon cycle research. In this study, using historical population data as a proxy, we estimated the provincial cropland area of Qinghai and Tibet in 1910. Based on the statistical data of the National Bureau of Statistics of China, the survey data of the Ministry of Land and Resources, and the results of some previous studies, we revised the cropland area of Qinghai and Tibet in 1950-2000. The relationship between altitude and surface slope and cropland distribution were quantified to develop the spatially explicit reconstruction model of historical cropland at a resolution of 1 km×1 km. Since the cropland area reached the maximum in the 1980s, the satellite-observed cropland distribution extent of this time period was taken as the maximum distribution extent of historical cropland. The model developed in this research was used to reconstruct the spatial patterns of cropland in Qinghai and Tibet in 1910, 1960, 1980, and 2000. The reconstruction results show that: (1) in 1910-1950, cropland area of Qinghai-Tibet was stable, while in 1950-1980 cropland area increased rapidly, reaching 10583 km2, which is the maximum of the entire study period; in 1980-1990, cropland area decreased slightly; and in 1990-2000, cropland area increased slightly; (2) with regard to its spatial distribution, in 1910-1960, cropland expanded and land use activities intensified greatly in the Yellow River-Huangshui River Valley (YHV); in 1960-1980, cropland expansion and land use intensification occurred in the YHV, the Yarlung Zangbo River, the Nianchu River, and the Lhasa River valleys; in 1980-2000, the spatial pattern of cropland in Qinghai and Tibet remained unchanged. By comparing the reconstruction results of this study for 2000 with satellite-observed cropland distribution of the same year, we found that the correlation coefficient was 0.92 and the absolute difference followed normal distribution. The percentage of grid cells where the absolute difference is low (-10% to 10%) reached 73.29%, while the percentage of grid cells where the absolute difference is high (>40% or <-40%) was 1.94%. Incorporating more information on historical population and cropland of Qinghai and Tibet will help improve the accuracy of our reconstruction modeling. The reconstruction results of this research can be used in regional climate models to study the impact of cropland cover change on the climate and carbon cycle.
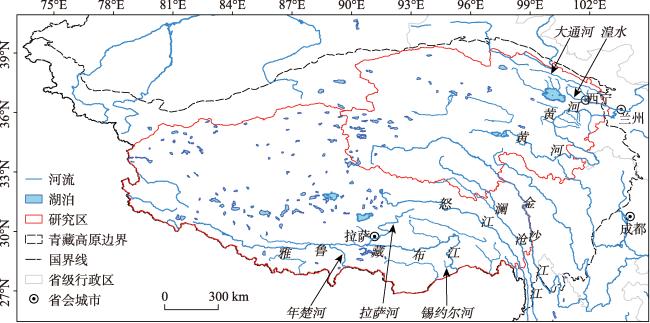
Fig.1 Location of the study area (the boundary of the Tibetan Plateau is based on Zhang et al (2014))图1 研究区示意图(青藏高原边界线数据引自(Zhang et al, 2014)) |
Tab.1 Cropland area of Qinghai and Tibet, 1910-2000/km2表1 1910-2000年青海省和西藏自治区耕地面积/km2 |
| 年份 | 1910a | 1950b | 1960b | 1970c | 1980c | 1990c | 2000b |
|---|---|---|---|---|---|---|---|
| 青海 | 4467 | 4527 | 5530 | 6921 | 6850 | 6739 | 6875 |
| 西藏 | 1560 | 1620 | 1852 | 2631 | 3733 | 3681 | 3667 |
| 全区 | 6027 | 6147 | 7382 | 9552 | 10583 | 10420 | 10541 |
注: a: 依据人口数据估算而得;b: 直接引自统计数据;c: 基于统计 数据和调查数据,进行订正而得。 |
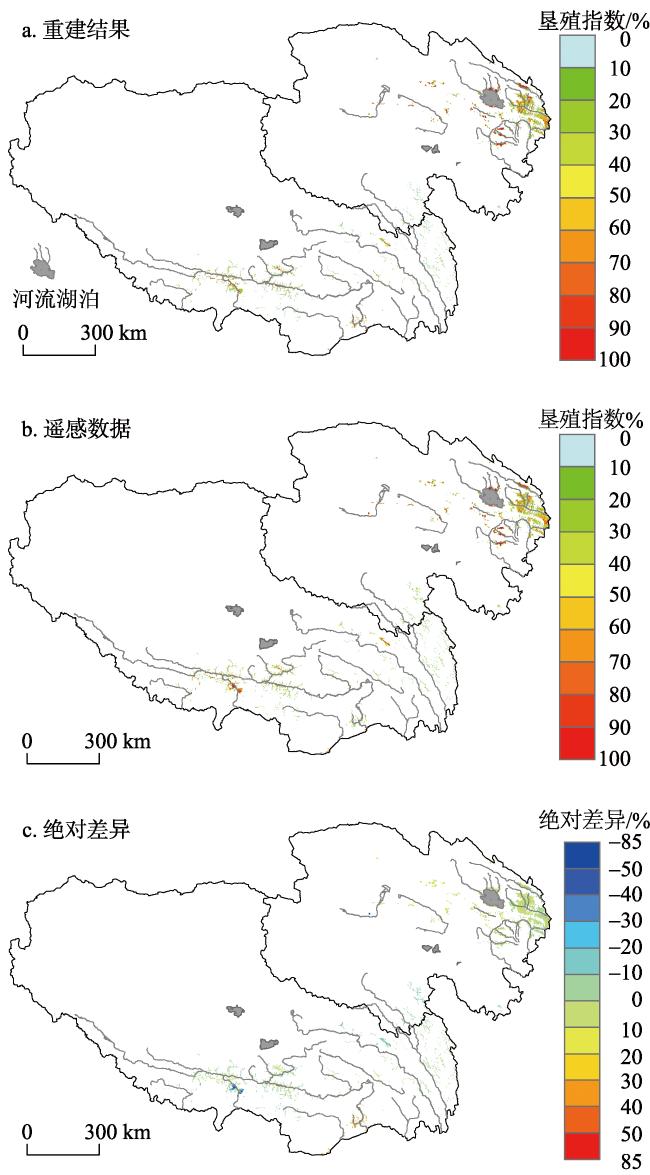
Fig.2 Comparison between the reconstruction of this study and satellite-observed data of 2000图2 2000年耕地分布的网格化重建结果与遥感数据对比 |
Fig.3 Scatterplot of the reconstruction of this study and satellite-observed data and histogram of absolute difference of 2000图3 2000年耕地分布的网格化重建结果与遥感数据散点图和绝对差异直方图 |
Tab.2 Statistics of absolute difference between the reconstruction of this study and satellite-observed data表2 网格化重建结果与遥感数据绝对差异分区统计 |
| 差异区间/% | ≤-40 | -40~-20 | -20~-10 | -10~0 | 0~10 | 10~20 | 20~40 | >40 |
|---|---|---|---|---|---|---|---|---|
| 网格占比/% | 0.74 | 2.58 | 7.58 | 39.14 | 34.15 | 9.61 | 4.99 | 1.20 |
difference of 2000 |
Fig. 4 Spatial patterns of cropland in Qinghai and Tibet at 1 km×1 km resolution in 1910, 1960, 1980, and 2000图4 1910、1960、1980和2000年青海和西藏1 km×1 km耕地空间格局 |
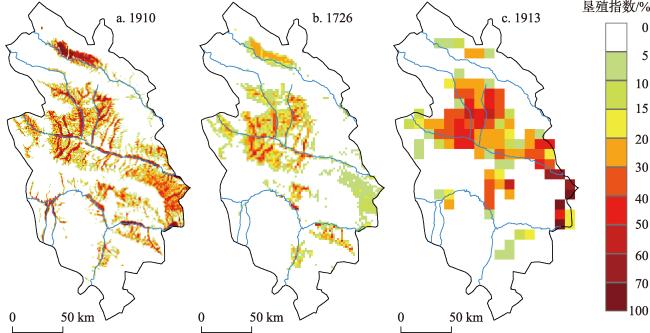
Fig.5 Comparison of historical cropland spatial patterns in the Yellow River-Huangshui River Valley (data sources: a, this study; b, Luo et al (2014); c, Li et al (2015)) |
Tab.3 Model variables, data sources and reconstruction results of this study, Luo et at (2014), and Li et al (2015)表3 3个数据集重建模型涵盖因子、数据来源和重建结果比较分析 |
| 数据集来源 | 模型涵盖限制因子 | 源数据分辨率 | 重建空间分辨率/km | 不同坡度(°)耕地面积占比/% | 不同高程(km)耕地面积占比/% | |||||||
|---|---|---|---|---|---|---|---|---|---|---|---|---|
| ≤2 | 2~6 | 6~15 | >15 | ≤2 | 2~3 | 3~4 | >4 | |||||
| 本文 | 高程、坡度 | 省域/约72.23万km2 | 1 | 24.1 | 60.7 | 15.0 | 0.1 | 8.3 | 79.2 | 12.5 | 0.0 | |
| 罗静等(2014) | 高程、坡度、气候、人口 | 县域/平均0.24万km2 | 2 | 23.0 | 62.1 | 14.8 | 0.2 | 3.2 | 85.6 | 11.2 | 0.0 | |
| Li等(2015) | 高程、坡度、气候 | 省域/约72.23万km2 | 10 | 14.4 | 59.0 | 26.3 | 0.4 | 5.5 | 69.7 | 24.1 | 0.8 | |
The authors have declared that no competing interests exist.
| 1 |
[
|
| 2 |
[
|
| 3 |
[
|
| 4 |
[
|
| 5 |
[
|
| 6 |
[
|
| 7 |
[
|
| 8 |
[
|
| 9 |
[
|
| 10 |
中华人民共和国国家统计局. 2009. 中国统计年鉴[M]. 北京: 中国统计出版社.
[Natural bureau of statistics of China. 2009. China statistical yearbook[M]. Beijing, China: China Statistics Press.]
|
| 11 |
[
|
| 12 |
|
| 13 |
|
| 14 |
|
| 15 |
|
| 16 |
|
| 17 |
|
| 18 |
|
| 19 |
|
| 20 |
|
| 21 |
|
| 22 |
|
| 23 |
|
| 24 |
|
| 25 |
|
| 26 |
|
| 27 |
|
| 28 |
|
| 29 |
|
| 30 |
|
| 31 |
|
| 32 |
Ramankutty N. 2011. Global cropland and pasture data from 1700-2007[DB/OL]. 2011-07-13[2014-08-15].
|
| 33 |
|
| 34 |
|
| 35 |
|
| 36 |
|
| 37 |
Zhang Y L, Li B Y, Zheng D. 2014. Datasets of the boundary and area of the Tibetan Plateau[DB/OL]. 2014-06-01[2014-07-30].
|
/
| 〈 |
|
〉 |