
信阳城市人口—城区用地异速生长分析
作者简介:陈彦光(1965-),男,河南罗山人,博士,教授,主要从事城市地理学、理论地理学以及计量地理学研究,E-mail:chenyg@pku.edu.cn。
网络出版日期: 2014-08-25
基金资助
国家自然科学基金项目(41171129)
An allometric analysis of the scaling relations between population and urban area of Xinyang
Online published: 2014-08-25
Copyright
城市人口规模和用地面积随着时间的改变过程理论上服从异速生长定律,即在一定时空范围内表现为幂指数关系,并且标度指数小于1。但由于种种原因,中国的统计数据大多不满足纵向异速标度关系,或者标度指数严重异常。为深入研究这一问题,借助最小二乘法和对数线性回归分析技术,基于信阳的人口普查数据和城市用地现状图资料,开展城市人口和城市用地面积的标度分析,发现城市生长长期服从纵向异速生长定律,可用幂函数描绘,并且标度指数(约为0.86)接近于理论预期值(0.85)。然而,由于近年的“造城运动”,这种标度关系遭到破坏,城市人—地关系出现混乱。因此,揭示城市演化规律的前提是数据质量的保证,而人文系统的规律也会因为人为的因素而暂时破坏。本文提供了一个城市纵向异速生长及其标度破坏的简明案例,并给出了估计和预测信阳城市人口和用地的数学模型,其计算结果可以作为了解同类城市人—地关系的演化进程和未来趋势的重要参考。
陈彦光 , 张莉 . 信阳城市人口—城区用地异速生长分析[J]. 地理科学进展, 2014 , 33(8) : 1058 -1067 . DOI: 10.11820/dlkxjz.2014.08.006
The relationship between urban population and construction land area is supposed to follow the law of allometric growth, which is based on exponential growth or distribution. However, if we apply the allometric scaling law to Chinese cities using data from the statistical yearbooks of China, the relationship is often unclear or unconvincing, possibly due to the quality of the statistical data used. In this study, the ordinary least square method and log-linear regression analysis are employed to make a longitudinal allometric analysis of urban evolution of Xinyang, a medium-sized city of Henan Province, China. Population of the urban area (which is greater than the non-agricultural population of the same city) was estimated by using the census data from multiple years; the area of urban construction land was estimated using the land-use maps. The quality of these data is clearly higher than those provided in the statistical yearbooks. The result of the analysis shows that from 1949 to 2004, the urban population and area of construction land in Xinyang followed the allometric scaling law. During the period between 2007 and 2013, the scaling relation was disrupted due to the "city-making movement" in the context of an overheated economy based on real estate development and rapid urbanization. The following conclusion can be drawn: the urban evolution of Chinese cities follows the allometric growth law, but the allometric scaling can be disturbed by government policies in a largely command and control economy. The significance of this work lies in that, first, it provides a typical case of longitudinal allometry of China's cities for urban studies; second, it gives a set of models that can be used to estimate and project population size and urban land area of cities like Xinyang; and third, it lays a foundation for future allometric studies based on logistic growth rather than exponential growth.


Tab.1 Urban population and area of urban construction land in Xinyang表1 信阳城市人口和城市建设用地面积观测值 |
| 年份(n) | 1949 | 1979 | 1993 | 1999 | 2004 | 2013 |
|---|---|---|---|---|---|---|
| 时序(t=n-1949) | 0 | 30 | 44 | 50 | 55 | 64 |
| 人口(Pt)/万人 | 3.7 | 15.0 | 33.0 | 32.0 | 46.0 | 67.0 |
| 面积(At)/km2 | 4.50 | 17.15 | 25.10 | 31.63 | 42.89 | 89.11 |
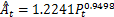
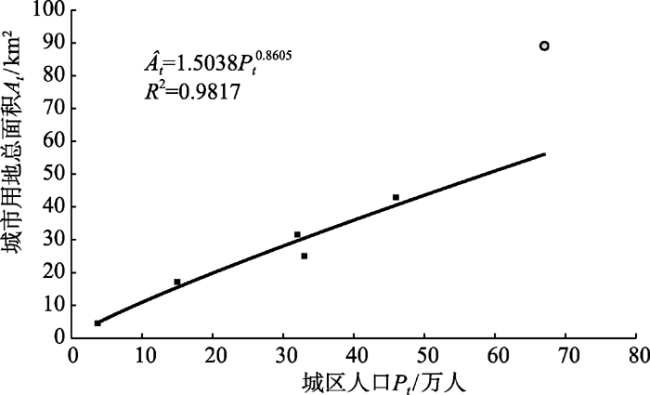
Fig.1 Allometric relationship between urban population and area of urban construction land in Xinyang, 1949-2004/2013图1 信阳城市人口—城区面积异速生长关系(1949-2004/2013) |
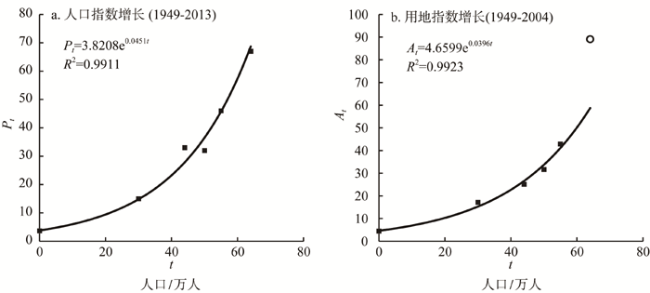
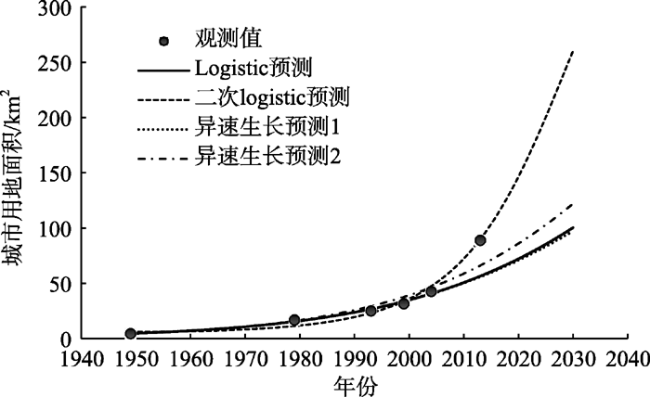
Fig.2 Exponential growth of urban population and area of urban construction land in Xinyang, 1949-2004/2013图2 信阳城市人口和城市用地面积指数增长图式(1949-2013)(由于标度间断,2013年的城市用地观测值即图中圆点作为异常值处理,不参与模型拟合) |
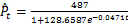
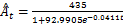
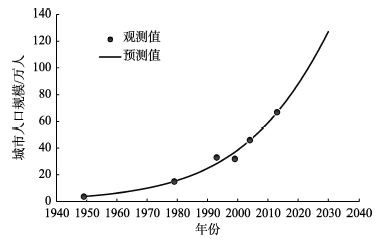
Fig.3 Logistic growth curve of urban population in Xinyang, 1949-2030图3 信阳城区非农业人口的Logistic增长曲线(1949-2030) |
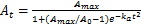
Fig.4 Logistic growth curves of area of urban construction land in Xinyang, 1949-2030图4 信阳城市建设用地面积的增长曲线(1949-2030) |
Tab.2 Estimated(1949-2004) and projected(2013-2030) non-agricultural population and area of urban construction land in Xinyang表2 信阳城市人口和城市建设用地面积估计值和预测值 |
| 年份 n | 时序 t | 人口规模Pt /万人 | 建设用地面积At /km2 | |||
|---|---|---|---|---|---|---|
| Logistic预测值 | Logistic预测 | 二次logistic预测 | 异速生长预测1 | 异速生长预测2 | ||
| 1949 | 0 | 3.76 | 4.63 | 6.14 | 4.70 | 4.30 |
| 1950 | 1 | 3.94 | 4.82 | 6.14 | 4.89 | 4.50 |
| 1951 | 2 | 4.12 | 5.02 | 6.15 | 5.09 | 4.70 |
| 1952 | 3 | 4.32 | 5.23 | 6.17 | 5.30 | 4.91 |
| 1953 | 4 | 4.53 | 5.44 | 6.21 | 5.52 | 5.14 |
| 1954 | 5 | 4.74 | 5.67 | 6.24 | 5.74 | 5.37 |
| 1955 | 6 | 4.97 | 5.90 | 6.29 | 5.98 | 5.61 |
| 1956 | 7 | 5.21 | 6.15 | 6.35 | 6.22 | 5.87 |
| 1957 | 8 | 5.46 | 6.40 | 6.42 | 6.48 | 6.13 |
| 1958 | 9 | 5.72 | 6.67 | 6.49 | 6.74 | 6.41 |
| 1959 | 10 | 5.99 | 6.94 | 6.58 | 7.02 | 6.70 |
| 1960 | 11 | 6.27 | 7.23 | 6.68 | 7.30 | 7.00 |
| 1961 | 12 | 6.57 | 7.53 | 6.78 | 7.60 | 7.32 |
| 1962 | 13 | 6.89 | 7.84 | 6.90 | 7.91 | 7.65 |
| 1963 | 14 | 7.21 | 8.16 | 7.03 | 8.23 | 8.00 |
| 1964 | 15 | 7.56 | 8.50 | 7.18 | 8.57 | 8.36 |
| 1965 | 16 | 7.91 | 8.85 | 7.34 | 8.92 | 8.73 |
| 1966 | 17 | 8.29 | 9.21 | 7.51 | 9.28 | 9.12 |
| 1967 | 18 | 8.68 | 9.59 | 7.69 | 9.66 | 9.53 |
| 1968 | 19 | 9.09 | 9.98 | 7.89 | 10.05 | 9.96 |
| 1969 | 20 | 9.52 | 10.39 | 8.11 | 10.46 | 10.41 |
| 1970 | 21 | 9.97 | 10.81 | 8.34 | 10.88 | 10.88 |
| 1971 | 22 | 10.44 | 11.26 | 8.59 | 11.32 | 11.36 |
| 1972 | 23 | 10.94 | 11.71 | 8.87 | 11.78 | 11.87 |
| 1973 | 24 | 11.45 | 12.19 | 9.16 | 12.26 | 12.40 |
| 1974 | 25 | 11.99 | 12.69 | 9.48 | 12.75 | 12.96 |
| 1975 | 26 | 12.55 | 13.21 | 9.82 | 13.26 | 13.53 |
| 1976 | 27 | 13.14 | 13.74 | 10.18 | 13.80 | 14.14 |
| 1977 | 28 | 13.76 | 14.30 | 10.58 | 14.35 | 14.77 |
| 1978 | 29 | 14.40 | 14.88 | 11.00 | 14.93 | 15.42 |
| 1979 | 30 | 15.08 | 15.48 | 11.46 | 15.53 | 16.11 |
| 1980 | 31 | 15.78 | 16.11 | 11.95 | 16.15 | 16.82 |
| 1981 | 32 | 16.52 | 16.76 | 12.48 | 16.80 | 17.56 |
| 1982 | 33 | 17.29 | 17.43 | 13.05 | 17.47 | 18.34 |
| 1983 | 34 | 18.09 | 18.13 | 13.67 | 18.16 | 19.15 |
| 1984 | 35 | 18.93 | 18.86 | 14.33 | 18.89 | 19.99 |
| 1985 | 36 | 19.80 | 19.61 | 15.04 | 19.63 | 20.87 |
| 1986 | 37 | 20.72 | 20.40 | 15.81 | 20.41 | 21.78 |
| 1987 | 38 | 21.67 | 21.21 | 16.64 | 21.22 | 22.73 |
| 1988 | 39 | 22.67 | 22.06 | 17.53 | 22.06 | 23.73 |
| 1989 | 40 | 23.71 | 22.93 | 18.50 | 22.93 | 24.76 |
| 1990 | 41 | 24.80 | 23.84 | 19.54 | 23.83 | 25.83 |
| 1991 | 42 | 25.93 | 24.79 | 20.67 | 24.76 | 26.95 |
| 1992 | 43 | 27.11 | 25.77 | 21.89 | 25.73 | 28.12 |
| 1993 | 44 | 28.34 | 26.78 | 23.20 | 26.73 | 29.33 |
| 1994 | 45 | 29.63 | 27.83 | 24.63 | 27.77 | 30.59 |
| 1995 | 46 | 30.96 | 28.92 | 26.17 | 28.85 | 31.90 |
| 1996 | 47 | 32.36 | 30.05 | 27.83 | 29.96 | 33.27 |
| 1997 | 48 | 33.81 | 31.22 | 29.64 | 31.11 | 34.68 |
| 1998 | 49 | 35.32 | 32.43 | 31.59 | 32.31 | 36.16 |
| 1999 | 50 | 36.90 | 33.69 | 33.71 | 33.54 | 37.69 |
| 2000 | 51 | 38.54 | 34.99 | 36.00 | 34.82 | 39.27 |
| 2001 | 52 | 40.24 | 36.34 | 38.48 | 36.14 | 40.92 |
| 2002 | 53 | 42.02 | 37.73 | 41.17 | 37.51 | 42.63 |
| 2003 | 54 | 43.86 | 39.17 | 44.08 | 38.92 | 44.41 |
| 2004 | 55 | 45.78 | 40.66 | 47.24 | 40.38 | 46.25 |
| 2005 | 56 | 47.77 | 42.20 | 50.65 | 41.89 | 48.16 |
| 2006 | 57 | 49.84 | 43.79 | 54.34 | 43.45 | 50.14 |
| 2007 | 58 | 51.99 | 45.44 | 58.33 | 45.05 | 52.19 |
| 2008 | 59 | 54.22 | 47.14 | 62.64 | 46.71 | 54.31 |
| 2009 | 60 | 56.53 | 48.89 | 67.30 | 48.42 | 56.51 |
| 2010 | 61 | 58.93 | 50.70 | 72.32 | 50.18 | 58.79 |
| 2011 | 62 | 61.41 | 52.57 | 77.72 | 52.00 | 61.14 |
| 2012 | 63 | 63.99 | 54.50 | 83.53 | 53.87 | 63.57 |
| 2013 | 64 | 66.65 | 56.49 | 89.77 | 55.79 | 66.08 |
| 2014 | 65 | 69.41 | 58.54 | 96.45 | 57.77 | 68.67 |
| 2015 | 66 | 72.26 | 60.66 | 103.59 | 59.81 | 71.35 |
| 2016 | 67 | 75.21 | 62.83 | 111.21 | 61.90 | 74.11 |
| 2017 | 68 | 78.25 | 65.08 | 119.30 | 64.05 | 76.96 |
| 2018 | 69 | 81.40 | 67.38 | 127.88 | 66.26 | 79.89 |
| 2019 | 70 | 84.64 | 69.76 | 136.94 | 68.53 | 82.92 |
| 2020 | 71 | 87.99 | 72.20 | 146.48 | 70.85 | 86.03 |
| 2021 | 72 | 91.44 | 74.71 | 156.47 | 73.24 | 89.22 |
| 2022 | 73 | 94.99 | 77.28 | 166.90 | 75.68 | 92.51 |
| 2023 | 74 | 98.64 | 79.93 | 177.72 | 78.18 | 95.89 |
| 2024 | 75 | 102.40 | 82.65 | 188.91 | 80.73 | 99.36 |
| 2025 | 76 | 106.26 | 85.43 | 200.41 | 83.35 | 102.91 |
| 2026 | 77 | 110.23 | 88.29 | 212.15 | 86.02 | 106.56 |
| 2027 | 78 | 114.30 | 91.22 | 224.08 | 88.74 | 110.29 |
| 2028 | 79 | 118.47 | 94.22 | 236.13 | 91.52 | 114.11 |
| 2029 | 80 | 122.75 | 97.29 | 248.21 | 94.36 | 118.02 |
| 2030 | 81 | 127.12 | 100.43 | 260.25 | 97.25 | 122.01 |
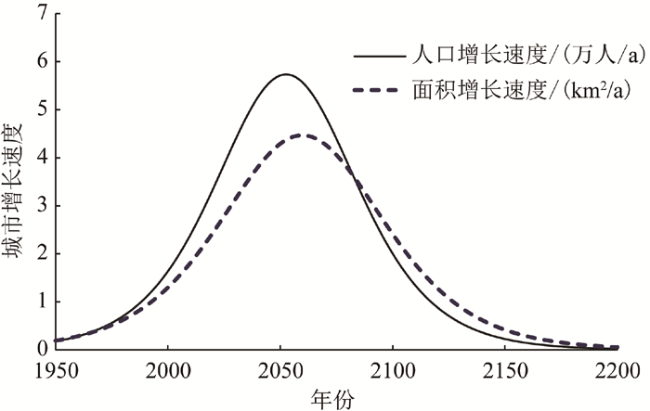
Fig.5 Unimodal curves of growth rates of urban population and area of urban construction land in Xinyang, 1949-2200图5 信阳城区人口和建设用地面积的增长速度(1949-2200) |
The authors have declared that no competing interests exist.
| [1] |
|
| [2] |
|
| [3] |
|
| [4] |
|
| [5] |
|
| [6] |
|
| [7] |
|
| [8] |
|
| [9] |
|
| [10] |
|
| [11] |
|
| [12] |
|
| [13] |
|
| [14] |
|
| [15] |
|
| [16] |
|
| [17] |
|
| [18] |
|
| [19] |
|
| [20] |
|
| [21] |
|
| [22] |
|
| [23] |
|
| [24] |
|
| [25] |
|
| [26] |
|
| [27] |
|
| [28] |
|
| [29] |
|
| [30] |
|
| [31] |
|
| [32] |
|
/
| 〈 |
|
〉 |