方佳毅 , 史培军
, 史培军
FANG Jiayi, SHI Peijun
通讯作者:
收稿日期: 2018-08-3
修回日期: 2019-01-15
网络出版日期: 2019-05-28
版权声明: 2019 地理科学进展 《地理科学进展》杂志 版权所有
基金资助:
作者简介:
第一作者简介:方佳毅(1991— ),女,浙江金华人,博士后,助理研究员,主要从事气候变化及海岸带灾害风险评估研究。E-mail: jyfang@geo.ecnu.edu.cn
展开
摘要
全球气候变化背景下,海平面上升以及高潮位和风暴潮引起的极值水位导致的海岸洪水对沿海社会经济和自然环境造成巨大影响,已是国内外关注的重点。论文梳理了广义和狭义海岸洪水的定义和要素,重点阐述了狭义海岸洪水的组成部分,从致灾因子、孕灾环境和承灾体以及风险评估方法与模型3个方面,系统总结了相关研究方法与研究成果的主要进展,以及存在的主要问题,并透视了未来拟加强的研究方向。建议加强沿海地区应对全球气候变化风险的研究,包括全球气候变化下多致灾因子耦合危险性和不确定性研究,沿海关键地区和关键暴露(关键基础设施)的风险评估研究,全球气候变化风险适应与减缓性措施的成本效益评价研究,提高沿海地区应对全球气候变化风险的韧性研究,以及建立多学科间的基础数据共享机制,采用交叉学科手段以便更综合、系统、动态研究海岸带问题,保障沿海地区开展全球气候变化下风险评估的需要。
关键词:
Abstract
The sea level rise under global climate change and coastal floods caused by extreme sea levels due to the high tide levels and storm surges have huge impacts on coastal society, economy, and natural environment. It has drawn great attention from global scientific researchers. This study examines the definitions and elements of coastal flooding in the general and narrow senses, and mainly focuses on the components of coastal flooding in the narrow sense. Based on the natural disaster system theory, the review systematically summarizes the progress of coastal flood research in China, then discusses existing problems in present studies and future research directions with regard to this issue. It is proposed that future studies need to strengthen research on adapting to climate change in coastal areas, including studies on the risk of multi-hazards and uncertainties of hazard impacts under climate change, risk assessment of key exposure (critical infrastructure) in coastal hotspots, and cost-benefit analysis of adaptation and mitigation measures in coastal areas. Efforts to improve the resilience of coastal areas under climate change should be given more attention. The research community also should establish the mechanism of data sharing among disciplines to meet the needs of future risk assessments, so that coastal issues can be more comprehensively, systematically, and dynamically studied.
Keywords:
全球变暖背景下,海平面上升以及高潮位和风暴潮引起极值水位导致的海岸洪水对沿海社会经济和自然环境造成巨大影响。1975—2016年间,全球80%因洪水死亡人数在距离沿海100 km的地区内(Hu et al, 2018)。2005年美国卡特里娜飓风-风暴潮灾害链使美国新奥尔良市防洪堤决口,经济损失达960多亿美元(Townsend, 2006)。2008年纳尔吉斯热带风暴横扫缅甸三角洲地区,导致13.8万人失踪死亡(Shibayama, 2015)。此外,菲律宾的台风海燕(2013年)、美国纽约的桑迪飓风(2012年)和美国得克萨斯州的哈维飓风(2017年)等都造成巨大的人员伤亡和经济损失。中国沿海地区是极端天气和气候事件易发和频发的区域,也是重要的人口与经济聚集地。随着快速城镇化,沿海人口急剧膨胀,高强度的人类活动、城市化和土地开垦使得中国沿海土地利用覆盖变化巨大(Liu et al, 2015)。1989—2014年间中国因风暴潮引发的海岸洪水灾害造成约706亿美元损失,失踪死亡约4354人(Fang et al, 2017)。在“一带一路”倡议下,沿海地区继续快速发展,预期未来中国沿海暴露将会持续增加,未来沿海地区人口和经济灾害风险仍然趋高。
日益频发的沿海地区极端灾害事件已经引起了各国政府组织和学术界的高度重视。“未来地球计划”中确立了海岸带海陆相互作用核心研究项目(Land-Ocean Interactions in the Coastal Zone, LOICZ),现已发展为未来地球海岸国际计划(Future Earth-Coast, FEC),旨在全球变化背景下开发和集成多学科(自然科学+经济+社会)的分析方法,促进海岸带地区的可持续发展和提高对气候变化的适应性。欧盟也就该主题开展了多个大型科研项目(表1)。中国关于海岸带和沿海地区全球变化综合风险研究也实施了一系列重大项目。中国科技部“十三五”重大科技专项提出,要求“评估海岸带和沿海地区变化综合风险,生成未来50~100 a全球变化情景下,空间分辨率优于1 km的中国海岸带及沿海地区的致灾因子分布图、承灾体脆弱性分布图及综合风险图”。减轻沿海地区自然灾害风险,已成为中国乃至国际社会面临的重大挑战之一。
表1 欧盟国家已开展关于气候变化下海岸洪水的部分研究项目信息
Tab.1 Non-exhaustive list of EU funded research projects about coastal flood under climate change
| 项目及执行时间 | 项目中英文全称 | 目标 |
|---|---|---|
| DINAS-COAST (2001—2004年) | 应对气候变化及海平面上升全球沿海地区动态交互脆弱性评价(Dynamic and Interactive Assessment of National, Regional and Global Vulnerability of Coastal Zones to Climate Change and Sea Level Rise) | 集成多学科的知识(海岸地貌学、生态学、经济学、环境地理和计算机科学),建模开发有助于支持决策者分析的关于气候变化和海平面上升影响的评估模型 |
| XtremRisK (2008—2012年) | 极端风暴潮综合洪水风险评估(Integrated Flood Risk Analysis for Extreme Storm Surges) | 开展在开放海岸和河口地区因极端水位导致的海岸洪水灾害风险分析 |
| THESEUS (2009—2013年) | 气候变化下欧洲沿岸创新适应性措施研究(Innovative Technologies for Safe European Coasts in a Changing Climate) | 提供针对海岸洪水和海岸侵蚀的综合评估方法,结合多学科知识,从风险评估、应对策略和应用3个具体方向展开,为维护海岸带可持续发展提供创新的适应性措施 |
| RISES-AM (2013—2016年) | 气候变化下沿海地区应对极端情景创新战略研究——适应与减缓(Responses to Coastal Climate Change: Innovative Strategies for High End Scenarios — Adaptation and Mitigation) | 为应对气候变化下沿海地区发生的极端情景,开发创新性的减轻和适应性措施 |
| SPP 1889 (2016-2019年) | 区域海平面变化与社会(Regional Sea Level Change and Society) | 开展气候相关的海平面变化问题的交叉研究,通过全面、跨学科的集成手段,同时考虑人类环境的交互作用和沿海地区的社会经济发展 |
综上,开展全球气候变化背景下海岸洪水灾害风险评估研究,是国际科学研究前沿问题,对满足国家及区域发展需要、制定减灾策略、实施海岸带可持续发展有重大意义。然而,当前关于海岸洪水风险的研究,对其定义和成因要素、机制、动力学等理解不深,有关概念模糊,导致研究口径不一致,影响研究成果应用等问题。因此,本文从区域灾害系统的角度出发,综述国内外海岸洪水相关研究进展和存在的问题,为更好地明确研究方向、凝练研究问题及相关研究提供参考。
当前国内外学术界对海岸洪水(coastal flood)这一术语的定义还不统一,可分为广义和狭义2种。
广义的海岸洪水(图1),指发生在沿海地区的洪水,除了海平面上升、天文大潮和风暴潮引起的极值水位影响,还可能包括河道型洪水(riverine flood)和强降水导致的城市内涝(waterlogging)综合作用的结果,主要致灾因子可包括超设防陆源洪水、极端降水和极值海水位。在欧盟THESEUS项目中,Zheng等(2014)和Zscheischler等(2018)皆采用了广义海岸洪水概念。广义海岸洪水研究多在河口大城市区域,这类地区不仅受到海洋因素的威胁,还受到陆源洪水的影响,叠加极端降水事件,和复杂城市系统中高比例的不透水层,导致城市内涝频发,上海便是典型地区。
图1 广义(a)与狭义(b)海岸洪水示意图
注:广义海岸洪水示意图由美国中佛罗里达大学(University of Central Florida)Thomas Wahl博士提供。
Fig.1 Coastal flooding in the broad sense (a) and the narrow sense (b)
狭义的海岸洪水,一般是指沿海地区气候变化下海平面上升、风暴潮增水和天文大潮引起的极值水位导致的洪水。这也是IPCC系列报告中常用的概念,是基于重现期的极值水位叠加海平面上升进行淹没结果的分析(IPCC, 2013)。广义海岸洪水研究涉及多个致灾因子,研究问题较为复杂。当前大多数国际研究提及海岸洪水时,一般指狭义海岸洪水,是由于海洋系统不稳定,如热带气旋风暴潮所导致的洪水灾害,水源来自海洋(Nicholls, 2004; Hinkel et al, 2014)。因此本文重点综述气候变化下狭义海岸洪水风险评估研究进展。
狭义海岸洪水所考虑的致灾因子主要可分为2部分:代表趋势性的相对海平面变化和代表极端性的极值水位变化。在20世纪60年代,极值水位的研究主要考虑了因热带气旋引发的风暴潮增水与高潮位叠加的结果,开发出一系列风暴潮数值模型(冯士筰, 1982),但该阶段对海平面上升的考虑十分有限。80年代以来,气候变化和海平面上升问题开始得到重视,出现了一系列预测未来海平面上升的研究(IPCC, 1990)。两者研究早期相对独立,20世纪末相关学者意识到,与海平面缓慢上升引起的静止水位淹没相比,叠加极端气候事件引起的极值高水位导致的灾害后果更为严重,进而将两者综合考虑进行研究(Nicholls et al, 2014)。Hoozemans等(1993)和Baarse(1995)初步构建了海平面上升时极值水位影响的评估方法,建立了基础数据库,给出了全球尺度的影响评估初步结果。Nicholls等(1998)、Klein等(1999)以及Nicholls(2004)对评估方法不断改进,开展了全球范围海岸洪水风险评估研究,成为IPCC第三、四次报告海岸带章节引用的主要成果之一。狭义海岸洪水主要的致灾因子组成部分可由式(1)定义:
式中:
极值水位的研究主要集中在其历史变化规律和影响因素,以及模拟评估极值水位的危险性。国内外学者对极值水位历史长期变化规律开展了研究,发现全球大部分验潮站的极值水位呈现增加趋势,但将极值水位减去平均海平面变化后发现这种增加趋势大幅减少,由此认为极值水位的大部分变化是由于海平面变化引起的(Woodworth et al, 2004; Marcos et al, 2009; Menéndez et al, 2010)。也有研究指出极值水位增加速度明显高于平均海平面增长(Woodworth et al, 2011)。中国沿海极值水位呈现显著增长趋势,在1954—2012年间,以2.0~14.1 mm/a 速率增加(Feng et al, 2014; Feng et al, 2015)。海平面变化除了在极值水位长期变化中起到重要作用,也会导致极值水位频率增加。早期研究表明,极值水位重现期会因海平面的轻微变化有巨大改变(Nicholls et al, 1999)。其他国内外研究也得到类似结论(施雅风等, 1994; 施雅风等, 2000; Wu et al, 2017)。极值水位除受到海平面变化的影响外,还受到台风、风暴潮、风场和大气环流指数等因素的影响(Wahl, Chambers, 2015)。除了研究极值水位的历史变化规律和其影响因素,也有大量研究评估极值水位的危险性。极值水位危险性评估是风险评估研究的基础,主要通过2种方法,即统计模型和数值模拟。国际上已建立了较为成熟的风暴潮数值模型,如SLOSH、ADCIRC、DELFT3D、MIKE21和GCOM 2D/3D模型等(石先武等, 2013)。荷兰学者基于水动力模型开发了全球第一套风暴潮和极值水位数据集(Muis et al, 2016)。目前针对中国沿海地区极值水位的研究,由于沿海站点分布较为稀疏且时间序列较短,多以验潮站的站点数据计算不同重现期下风暴潮增水高度(Wahl et al, 2017; Wu et al, 2017; 李阔等, 2017),在此基础上开展风险评估工作。
海平面变化常被划分为因海洋水体总体质量变化和比容效应导致的绝对海平面变化和相对某一基准面(如大地基准或历史平均海平面)的相对海平面变化(陈美香等, 2013)。预测未来海平面变化趋势的常用方法分2类:一是利用奇异谱分析、灰色模型、经验模态法、自回归模型、小波分析等统计模型方法对历史观测数据进行分析,找出其规律进行外推预测(段晓峰等, 2014);二是使用全球耦合模式对未来不同温室气体排放情景下,对海平面变化进行模拟分析(左军成等, 2015)。利用统计模型的外推来预测未来变化,受数据序列长度和质量的影响较大,且假设未来海平面变化系统处于稳定状态,其变化规律保持不变,因此不能反映因气候变化导致的海洋系统变化的实际情况。相比而言,基于大型数值模式的全球海平面变化研究是当前研究的主流,也是IPCC系列报告采用的主要方法(Church et al, 2013; Jevrejeva et al, 2014; Kopp et al, 2014)。在IPCC AR5报告中,基于CMIP5全球气候模式对未来多种排放情景进行了模拟(温家洪等, 2018)。当前耦合数值模型存在对全球气候变化过程模拟刻画得不够完善、模型中不确定因素较多且模式的精度不够高等问题,全球大量的学者在试图改进模型模拟的物理机制,提高海平面上升数据产品的分辨率,使得模拟过程更合理,数据产品质量和精度更高。
表2给出了已有(狭义)海岸洪水风险评估的相关案例及其考虑的因素。大部分研究考虑平均海平面的变化、天文大潮和风暴潮增水叠加作用,但由于海浪观测数据较少且模拟的技术难度较大,因而在相关风险评估中考虑较少;对于区域海平面差异考虑也较少;对自然因素的地面升降考虑较多,但对人为因素导致地面升降考虑较少。值得注意的是,以上研究是将海平面上升和极值水位进行线性叠加,未考虑两者耦合机制。Lin等(2012)就这一问题的研究有了突破,基于物理机制,用数值模型分析海平面上升情景下纽约地区风暴潮水位的变化。但由于研究涉及大量数值运算,难度较大,需要多学科、多单位的合作努力,相关研究成果较少。因此当前相关研究中,大多依然对海平面上升和极值水位进行线性叠加。
表2 已有海岸洪水风险评估的相关案例
Tab.2 Non-exhaustive examples of coastal flooding assessment
| 文献 | 内容 | 海平面组成 | ||||||
|---|---|---|---|---|---|---|---|---|
| △SLG | △SLRM | △SLRG | △SLMN | △SLMH | △SS | |||
| Lowe et al, 2009 | 国家层面(英国) | √ | √ | √ | √ | |||
| Rosenzweig, 2010 | 城市(纽约) | √ | √ | √ | ||||
| Hanson et al, 2011 | 全球(城市) | √ | √ | √ | √ | |||
| Parris et al, 2012 | 国家层面(美国) | √ | √ | √ | √ | |||
| Wang et al, 2012 | 城市(中国上海) | √ | √ | √ | √ | |||
| Kebede et al, 2012 | 城市(坦桑尼亚首都) | √ | √ | √ | ||||
地形地貌、海岸工程和地面沉降等自然和人文孕灾环境,对沿海地区海岸洪水致灾-成害过程有重要影响。随着研究深入,近年来学者们越来越重视实际设防水平和地面沉降在海岸洪水致灾过程中的影响(Ward et al, 2017)。关于沿海设防水平的数据十分有限,当前国内外相关评估研究根据人均GDP来简化设防水平,或直接不考虑设防(Aerts et al, 2016)。但在实际情况中,在人口聚集地和重大沿海城市都有一定程度的设防。在中国沿海地区,为了抵御海岸侵蚀、海岸洪水和灾难性海浪等沿海极端气象海洋灾害事件,已建立了一系列防护措施来保护沿海的人口安全和经济活动,研究表明全国超过60%的海岸线已受到海堤保护(Cai et al, 2009; Ma et al, 2014)。若不考虑设防,会使得其风险评估结果偏高。此外,全球沿海三角洲和重大城市存在严重的地面沉降问题(Syvitski et al, 2009),使得地面高程降低,相对海平面上升加快,进而降低了设防能力,因此在风险评估中越来越重视自然因素和人为因素导致的地面升降影响(Woodruff et al, 2013)。已有研究将这一孕灾环境考虑在致灾因子危险性中,指出地面沉降改变了相对海平面上升高度,放大了危险性(Nicholls et al, 2010)。在中国沿海大城市,人为因素导致的地面沉降已十分严重(郑铣鑫等, 2001),但目前有关风险评估中考虑地面沉降的研究十分有限。
近年来国内外学者针对人口、经济、农业和湿地等承灾体,评估了海平面变化下极值水位对社会经济和自然环境的影响。Nicholls(2004)和Spencer等(2016)评估了海岸洪水的影响和湿地损失;Hanson等(2011)评估了全球136个港口城市未来在百年一遇海岸洪水事件下的人口和资产风险;Jongman等(2012)计算了在百年一遇河道型和海岸洪水事件下的2010年和2050年资产暴露度;Hallegatte等(2013)评估了136个沿海主要城市在未来海岸洪水下的暴露、损失和风险,并对其进行了风险排名;Hinkel等(2014)分析了未来全球海岸洪水下的人口与资产风险,强调了适应性措施的重要性;Vousdoukas等(2018)分析了多种气候情景和社会经济情景对海岸洪水风险变化的贡献率。承灾体并非静止不变,而是在动态变化,如未来老龄人口将不断增多,沿海城市的流动性人口存在季节性特点,土地利用类型在不断变化,沿海暴露可能不断增多。虽然已有结合未来多种气候情景和社会经济情景的风险评估,但此类研究多集中于人口和经济总量方面,如Hinkel 等(2014) 和Vousdoukas等(2018),且其他承灾体的动态研究十分有限。另外,对影响灾害损失的关键暴露的研究较少,特别是包括电力设施、交通枢纽、避难所、物资储备基地、水闸和提防设施等在内的沿海重要关键基础设施(Brown et al, 2014; Willis et al, 2016)。关键基础设施的破坏会导致区域基础设施功能的系统性、级联性瘫痪,进而引发其他间接损失,而目前间接损失的评估和对系统动态网络功能影响评估的研究还较少。
承灾体脆弱性指社会经济系统和生态系统遭受到致灾因子打击的可能性大小,最常见的是物理脆弱性和社会脆弱性(UNISDR, 2009)。承灾体物理脆弱性侧重于致灾因子物理特性和承灾体的响应。物理脆弱性分析采用定量分析的手段,基于灾情数据、现场调研数据、保险数据、模型模拟等手段,获取损失与致灾因子之间的关系,给出定量风险评估结果(周瑶等, 2012)。通过构建淹没水深与沿岸承灾体(人口、房屋、海堤等)损失之间的函数关系,可以构造脆弱性损失矩阵或建立脆弱性曲线来确定不同致灾强度作用下承灾体的损失率(石先武等, 2016)。国外对洪水灾害脆弱性曲线开展了大量的研究,如美国、英国和荷兰已针对不同建筑物类型建立损失曲线(FEMA, 2015; Jonkman et al, 2008)。国内在上海等部分地区也开展了较为详细的研究(尹占娥等, 2012)。因物理脆弱性研究对历史灾情数据要求较高,需要大量的实地调研,而当前灾情数据公开较少或质量不高,资料获取困难,水深和损失之间的脆弱性曲线研究十分有限,难以构建出普适、实用的物理脆弱性曲线,使得在目前研究中较多依赖于国际的物理脆弱性曲线。社会脆弱性可以理解为社会系统遭遇致灾事件冲击的敏感性,以及应对灾害事件的适应能力(Cutter et al, 2008)。评价方法通常采用指标体系法,通过建立指标评价体系,用专家打分法、因子分析法等手段给因子赋予权重,对社会脆弱性等级进行划分。利用这些方法,就中国沿海地区不同尺度和不同研究区的社会脆弱性评价已有一定进展,如对沿海市级(谭丽荣, 2012; Su et al, 2015)和沿海县级为单元(方佳毅等, 2015)开展了社会脆弱性评价。但评价指标选取和建立,权重赋予方法各不相同,对结果影响较大,主观性较大。此外,指标体系法得到的是无单位的标量或相对值,可以用于识别高脆弱性区域,或脆弱性变化趋势,但它与损失之间的定量关系还不清晰,因此较难应用于定量风险评估中。
针对海岸带系统,大量学者也开展了海岸带承灾体综合脆弱性和易损性方面的研究,建立了脆弱性评估模型,如PSR模型(Pressure-State-Response-Framework)、DPSIR模型(Driving force-Pressure-State-Impact-Response)和SPRC(Source-Pathways-Receptor-Consequence)等(王宁等, 2012; 王腾等, 2015)。基于以上概念模型,相关学者建立了海岸带综合脆弱性评级模型,一般是指标体系法(李恒鹏等, 2002; 储金龙等, 2005; 孙蕾等, 2007; Yin et al, 2013; 李响等, 2016),但以上研究所得的脆弱性也是标量结果,较难与定量风险评估联系起来。
在确定了海岸洪水需要考虑的要素后,如何确定极值水位下的海岸洪水淹没范围成为风险分析中最关键的问题(Mcleod et al, 2010)。目前确定海岸洪水淹没范围的手段主要可以总结为2类:一类是基于GIS支持下的高程-面积法,二是基于水动力演化的数值模型。
当前研究使用最普遍的方法是基于GIS手段的评估模型,特别在大尺度海岸洪水研究中有广泛应用(Hall et al, 2003; Rowley et al, 2007; Fang et al, 2014)。但该类方法的缺陷是没有考虑极值水位的持续时间,未考虑地面粗糙度,并非某特定水位下的区域都是受灾区,容易高估风险;优点是能较快划分出高风险区域,特别是针对未来多种气候情景下的影响,可以为全球和国家相关决策者提供海岸带宏观灾害风险防范的信息。
基于水动力演化的数值模型,如ADCIRC、DELFD3D等大型风暴潮数值模型,能够较好地模拟风暴潮增水和漫滩等过程,但应用于大尺度海岸洪水灾害风险评估中却较难实现,主要原因是:① 模型所需数据庞大复杂;② 求解过程复杂耗时;③ 对致灾因子强度有较好的模拟,但对风险评估中承灾体脆弱性等其他因素考虑不足。随着地形数据精度的提高,例如5 m及5 m以下的LiDAR高程数据,使得基于GIS栅格数据二维洪水模型的使用更为广泛,例如Lisflood(Bates et al, 2000)、JFLOW(Bradbrook, 2006)和Floodmap(Yu et al, 2006a; 2006b)等。该类二维洪水模型简化了物理过程,对求解效率有很大的提高,对小尺度研究有很好的表现(Yin et al, 2016)。为了提高极值水位模拟,简化求解过程,提高效率,一些学者采用其他研究团队开发的相关风暴潮产品,一般是基于大型风暴潮数值模式且针对某些特定区域的产品,如多种重现期下的极值水位高度,作为陆地上漫滩过程的输入,再使用基于GIS栅格数据的二维洪水模型作为洪水过程的演进(例如Yin et al, 2017)。但该方法目前也较难应用于大尺度海岸洪水风险评估中,主要由于对基础数据精度要求极高,而且就大尺度而言,基础数据量庞大也较难获得。
综上所述,在大尺度,如全球尺度或国家层面上,开展全球气候变化下海岸洪水对沿海地区的影响评估中更多依赖于基于GIS模型的高程面积法。除了普遍的GIS手段的评估模型,表3总结了目前已有的海岸洪水影响评估模型及其主要参数。这类评估模型集成了多学科知识,一定程度上考虑了自然环境和社会经济环境的动态反馈,可为决策者和利益相关者提供更有效的信息,提高了评估效率。
表3 海岸洪水影响评估模型及其主要参数
Tab.3 Key attributes of coastal flood impact models
| 模型 | 尺度 | 空间分辨率 | 时间尺度 | 输入数据 | 输出数据 | 文献 |
|---|---|---|---|---|---|---|
| 淹没模型(如GIS) | 地方、区域和全球 | 多变 | 用户定义 | 高程、海平面上升情景、社会经济数据 | 潜在淹没地区和影响人口地图 | Rowley et al, 2007 |
| SLAMM (Sea Level Affecting Marshes Model) | 地方和区域 | 10~100 m | 5~25 a时间步长 | 高程地图、湿地覆盖、发展足迹和海堤位置 | 潜在淹没地区和影响人口地图 | Galbraith et al, 2003 |
| DIVA (Dynamic Interactive Vulnerability Assessment) | 国家、区域、全球 | 海岸线分段(全球分为1.2万段,平均每段70 km) | 1~5 a,长达100 a | 高程、地貌类型、海岸人口、土地利用、行政边界、GDP | 预计海岸洪水影响人口、湿地改变、损失和适应成本、土地损失 | Hinkel et al, 2009 |
| LISCoAsT (Large scale Integrated Sea-level and Coastal Assessment Tool) | 欧洲区域 | 海岸线分段,长度不等 | 多变,用户定义 | 高程、气象数据、人口等 | 期望人口与经济损失等 | Vousdoukas et al, 2018 |
通过国内外研究,本文发现欧美发达国家在多种气候情景下的海岸洪水灾害风险评估研究已较为深入,已开展了国家层面的海岸洪水风险评估工作,如德国(Sterr, 2008)、美国(Parris et al, 2012)、加拿大(Lemmen et al, 2016)和英国(Sayers et al, 2017)等,但中国尚未有国家层面上的相关评估报告。相比于国外,国内关于海平面上升和极值水位叠加的海岸洪水相关研究起步较晚,且目前还大多针对致灾因子的危险性,对未来气候情景下区域尺度的海平面上升的预估研究较多,而对未来不同气候情景下,中国沿海地区的灾害风险评估较少。国内已有的相关研究大多针对某一区域,如珠三角地区(Kang et al, 2016)和上海(Wang et al, 2012),在国家层面上开展海平面上升和极值水位叠加的海岸洪水风险评估工作十分有限。与此同时,国内相关自主开发并公开的数据产品较少,社会经济数据、灾情数据存在统计口径不统一、年份缺失较多的情况,成为当前研究的一大瓶颈。
(1) 缺少致灾因子耦合危险性研究。大多相关研究中假定平均海平面上升和导致极值水位的风暴潮系统相对独立,两者之间是线性叠加的关系,并假定系统是稳定的,未考虑全球气候变化对风暴潮整体系统的改变,也未考虑区域波动性。全球气候变化可能会使得海洋系统整体发生相应变化,需要警惕极端情景(high-end scenario)和“灰天鹅”事件(Grey Swan)的出现(Lin et al, 2016; Rahmstorf, 2017),注意非一致性和平稳性过程。在海岸河口地区,由于近岸地形作用和多种水源叠加,容易出现多灾种叠加问题,可能会使得致灾程度高于仅考虑单一极值海水位的影响,是目前国际关注的重点(Zscheischler et al, 2018)。国外已开展用联合概率分布研究多种海岸洪水致灾因子叠加的非线性效应,如将河流径流洪水与海岸洪水结合(Lamb et al, 2010),或将海岸洪水与极端降水结合(Wahl, Jain et al, 2015)。目前国内相关研究较为薄弱,是未来突破的难点之一。
(2) 缺乏学科间的融合,缺少对孕灾环境和人为因素的考虑。从灾害系统的角度理解,海岸洪水灾害风险变化受到自然和人类社会多方面要素的影响,但目前评估研究中考虑的要素较少,并且缺少考虑多情景和人为要素。虽然各领域专家分别从海洋学、地质学和地理学的角度进行了研究,但缺乏融合各学科的系统研究(Hinkel et al, 2015)。目前中国相关研究大多是从全球气候变化角度开展的工作,通常基于某一种气候模式或者某种排放情景开展海岸灾害风险评估,缺少对陆面系统及人类经济系统的考虑,在评估中考虑沿海设防和地面沉降控制等因素十分有限,同时考虑未来气候情景变化和社会经济情景变化这两者因素的研究更少。虽然已有分别对中国未来人口和经济的模拟研究(姜彤等, 2017; 姜彤等, 2018),但目前评估研究中还未将两者结合。
(3) 沿海地区适应性措施研究和韧性研究较为欠缺。用定量化的成本-效益分析的手段,开展评估各种海岸工程或非工程的适应性与减缓性措施,以预防、应对或减缓气候变化和灾害风险是当前的流行研究趋势(Aerts et al, 2014; Ward et al, 2017)。沿海地区在应对全球气候变化的适应性措施除了设防,还有其他措施,可总结为防护(protection)、后退(retreat)和顺应(accommodation) 3类;按工程性质,可分为工程性措施和非工程性措施(Linham et al, 2012)。但目前中国沿海地区适应性措施研究处于初步阶段(冯爱青等, 2016)。另外大多数研究开始从脆弱性视角向韧性(Resilience)视角转变,韧性在越来越多的海岸带研究中得到关注(Aerts et al, 2014)。韧性研究是一个多学科框架下探索系统内部的应激、恢复、适应以及转型能力,强调系统对外界干扰的自主抵抗(Pelling et al, 2014)。但目前关注中国沿海地区韧性的研究也十分有限。
随着中国沿海地区经济的持续发展,以及“一带一路”倡议下,需要加强沿海地区应对全球气候变化风险的研究。基于以上不足,本文提出了以下几点展望。
(1) 加强气候变化下多致灾因子耦合危险性和不确定性研究。未来需加强全球海平面上升对热带气旋系统的影响和海岸带系统的交互影响,基于物理机制,用数值模型模拟全球海平面上升下热带气旋系统和极值水位的变化。加强对灾害链和灾害群的致灾机制研究,用统计模型或动力模型分析多致灾因子耦合的非线性效应。加强致灾因子不确定性研究,用随机模拟生成大量台风路径和强度的随机数据集,利用数值模式计算并分析模拟中不确定性。在海岸致灾因子危险性深化研究的基础上,自主开发针对整个中国沿海的致灾因子产品和相关评估软件,强化自主模型研究,更好地为海洋工程服务,为利益相关者提供信息。
(2) 加强对沿海关键地区和关键暴露(关键基础设施)的风险评估研究。未来应当抓紧开展对沿海关键地区和关键暴露的调查与隐患排查工作,重点调查高脆弱人群(如老龄人口和流动人口),并对可能造成重大影响的关键基础设施(如堤坝、电力设施、交通枢纽)进行排查。可选择典型区,尝试对未来承灾体的预测研究,针对不同土地利用类型和基础设施等关键暴露建立相应的脆弱性曲线,开展综合人口与经济风险评估工作。
(3) 加强全球气候变化风险适应与减缓性措施的成本效益评价研究。目前多种适应性和减缓性措施对海岸带环境的影响研究十分有限,特别是堤坝建立、土地围垦等措施。未来应加强在全球气候变化背景下设防、围填海等工程性措施对海岸带环境综合影响的研究。对于海岸带系统而言,面对未来全球气候变化和极端灾害事件时,如何提高沿海地区韧性,更好地适应全球变化,这些研究将显得越来越重要。
(4) 加强数据开放力度与多学科的交叉研究。建议有关部门加强对用于科研项目所需数据的开放力度,加强对基础社会经济数据的收集和统计,制定统计规范标准,建立更有效的社会信息收集系统和更为完备的数据资料库。随着网络技术的快速发展,利用大数据进行研究也是未来一大趋势。未来应加强多学科之间的基础数据共享机制,采用交叉学科手段,将其他学科(如经济学、社会学、系统动力学)的新兴手段应用到沿海地区,以便更综合、系统、动态地研究海岸带问题。
The authors have declared that no competing interests exist.
| [1] |
我国沿海海平面变化预测方法探究 [J].
本文基于相对海平面和绝对海平 面的概念明确了相对海平面变化是影响沿海地区的直接因素;系统回顾了中国沿海未来相对海平面变化的三种预测方法并对其实质进行了分析。在充分认识引起相对 海平面变化的因素及其变化特征的基础上对三种预测方法的合理性进行了剖析并指出正确区分相对海平面与绝对海平面,认识绝对海平面变化的时空特征以及合理考 虑气候变化和人类活动对绝对海平面以及地面沉降的影响是实现相对海平面合理预测的关键,提出应利用长时间序列的卫星高度计资料外推结果或者高精度气候系统 耦合模式预测结果叠加GPS资料外推结果来预测中国沿海未来相对海平面变化。
Discussion of sea level prediction along the coastal of China .
本文基于相对海平面和绝对海平 面的概念明确了相对海平面变化是影响沿海地区的直接因素;系统回顾了中国沿海未来相对海平面变化的三种预测方法并对其实质进行了分析。在充分认识引起相对 海平面变化的因素及其变化特征的基础上对三种预测方法的合理性进行了剖析并指出正确区分相对海平面与绝对海平面,认识绝对海平面变化的时空特征以及合理考 虑气候变化和人类活动对绝对海平面以及地面沉降的影响是实现相对海平面合理预测的关键,提出应利用长时间序列的卫星高度计资料外推结果或者高精度气候系统 耦合模式预测结果叠加GPS资料外推结果来预测中国沿海未来相对海平面变化。
|
| [2] |
海岸带脆弱性评估方法研究进展 [J].Risk and safety evaluation methodologies for coastal systems: A review . |
| [3] |
基于长期验潮数据的海平面预测方法与案例应用 [J].https://doi.org/10.13209/j.0479-8023.2014.147 URL Magsci [本文引用: 1] 摘要
在充分考虑长时间序列潮位具有周期性、趋势性和随机性特征的基础上, 建立一套基于随机动态预测模型的海平面变化分析方法。模型中的周期项模拟首次采用小波分析与谱分析相结合的方法; 趋势项采用逐步回归法拟合; 残差序列采用自回归移动平均混合模型进行拟合; 三项叠加建立随机动态预测模型, 参数的确定采用非线性最小二乘迭代法。应用塘沽验潮站57年的月平均海平面高度数据进行案例分析, 通过实测数据验证和预测精度统计学检验, 表明此方法对海平面变化的模拟与预测具有较高精度, 可为海平面上升预测研究提供有效可行的借鉴与范例。
Methodology and case study of sea level prediction based on secular tide gauge data .https://doi.org/10.13209/j.0479-8023.2014.147 URL Magsci [本文引用: 1] 摘要
在充分考虑长时间序列潮位具有周期性、趋势性和随机性特征的基础上, 建立一套基于随机动态预测模型的海平面变化分析方法。模型中的周期项模拟首次采用小波分析与谱分析相结合的方法; 趋势项采用逐步回归法拟合; 残差序列采用自回归移动平均混合模型进行拟合; 三项叠加建立随机动态预测模型, 参数的确定采用非线性最小二乘迭代法。应用塘沽验潮站57年的月平均海平面高度数据进行案例分析, 通过实测数据验证和预测精度统计学检验, 表明此方法对海平面变化的模拟与预测具有较高精度, 可为海平面上升预测研究提供有效可行的借鉴与范例。
|
| [4] |
中国沿海地区社会脆弱性评价 [J].https://doi.org/10.16360/j.cnki.jbnuns.2015.03.011 URL [本文引用: 1] 摘要
将美国社会脆弱性指数(SoVI)方法用于中国沿海地区,并基于中国国情进行改进,以探索中国沿海地区社会脆弱性的空间分布及其社会经济文化驱动因素.基于SoVI方法,选取31个指标对我国沿海的300个研究单元进行评价,采用主成分分析法得到社会脆弱性的6个主要影响因子:城镇化水平,经济条件,年龄与性别,民族与特需人群,居住条件与文盲,医疗水平.对这些因子按照对社会脆弱性的正向或负向作用进行加和,得到最终的社会脆弱性指数.结果显示,最高的社会脆弱性集中在海南省及北部湾沿岸,江苏北岸和辽宁省北岸社会脆弱性也较高.
Measuring social vulnerability to natural hazards of the coastal areas in China .https://doi.org/10.16360/j.cnki.jbnuns.2015.03.011 URL [本文引用: 1] 摘要
将美国社会脆弱性指数(SoVI)方法用于中国沿海地区,并基于中国国情进行改进,以探索中国沿海地区社会脆弱性的空间分布及其社会经济文化驱动因素.基于SoVI方法,选取31个指标对我国沿海的300个研究单元进行评价,采用主成分分析法得到社会脆弱性的6个主要影响因子:城镇化水平,经济条件,年龄与性别,民族与特需人群,居住条件与文盲,医疗水平.对这些因子按照对社会脆弱性的正向或负向作用进行加和,得到最终的社会脆弱性指数.结果显示,最高的社会脆弱性集中在海南省及北部湾沿岸,江苏北岸和辽宁省北岸社会脆弱性也较高.
|
| [5] |
气候变化背景下中国风暴潮灾害风险及适应对策研究进展 [J].https://doi.org/10.18306/dlkxjz.2016.11.011 URL [本文引用: 1] 摘要
风暴潮是沿海地区在强烈的大气扰动条件下产生的异常增水现象,并受海平面上升等因素的影响。中国风暴潮灾害频繁,其中尤以东南沿海地区发生频率较高,灾害损失严重。本文从风暴潮灾害的危险性、承灾体的易损性、综合风险区划3个方面系统总结风暴潮灾害的研究进展及存在的主要问题;并以风暴潮灾情特征及风险评估为基础,探讨气候变化对风暴潮灾害风险的影响及其适应对策。气候变化引起的海平面上升将影响风暴潮的趋势、周期及风险区域,因而亟待开展结合海平面上升等因素的综合风险评估。充分考虑气候变化背景下沿海地区自然条件变化及社会经济发展状况,注重短期与长期相结合,完善风险评估体系。为适度、有序的适应气候变化下风暴潮灾害风险,中国在应急预警机制、工程防御及政策法规等适应能力建设方面不断完善,以提高风暴潮灾害的防灾减灾能力。
A review of storm surge disaster risk research and adaptation in China under climate change .https://doi.org/10.18306/dlkxjz.2016.11.011 URL [本文引用: 1] 摘要
风暴潮是沿海地区在强烈的大气扰动条件下产生的异常增水现象,并受海平面上升等因素的影响。中国风暴潮灾害频繁,其中尤以东南沿海地区发生频率较高,灾害损失严重。本文从风暴潮灾害的危险性、承灾体的易损性、综合风险区划3个方面系统总结风暴潮灾害的研究进展及存在的主要问题;并以风暴潮灾情特征及风险评估为基础,探讨气候变化对风暴潮灾害风险的影响及其适应对策。气候变化引起的海平面上升将影响风暴潮的趋势、周期及风险区域,因而亟待开展结合海平面上升等因素的综合风险评估。充分考虑气候变化背景下沿海地区自然条件变化及社会经济发展状况,注重短期与长期相结合,完善风险评估体系。为适度、有序的适应气候变化下风暴潮灾害风险,中国在应急预警机制、工程防御及政策法规等适应能力建设方面不断完善,以提高风暴潮灾害的防灾减灾能力。
|
| [6] |
|
| [7] |
共享社会经济路径下中国及分省经济变化预测 [J].Projection of national and provincial economy under the shared socioeconomic pathways in China . |
| [8] |
IPCC共享社会经济路径下中国和分省人口变化预估 [J].https://doi.org/10.12006/j.issn.1673-1719.2016.249 URL [本文引用: 1] 摘要
基于2010年第六次中国人口普查数据,采用IPCC发布的可持续发展(SSP1)、中度发展(SSP2)、局部或不一致发展(SSP3)、不均衡发展(SSP4)、常规发展(SSP5)这5种共享社会经济路径,率定人口-发展-环境分析(PDE)模型中的人口生育率、死亡率、迁移率、教育水平等参数,对2011—2100年中国和31个省(区/市)人口变化进行预估。结果表明:1)不同SSP路径下,中国人口均呈先增加后减少的趋势,在高气候变化挑战的SSP3路径下人口最多,于2035年达到峰值,约14.27亿;在以适应挑战为主的SSP4路径下,人口出现最小值7.02亿。2)SSP1、SSP4和SSP5路径下人均寿命长,人口老龄化严重,其中SSP1和SSP5路径下人均教育水平高,到2100年教育水平在大学以上人口约占总人口的60%;SSP2路径下各年龄段分布比较均衡;SSP3路径下新生人口数量较多,劳动力充足,但教育水平较低。3)到2100年,SPP3路径下广西人口呈现最大值1.13亿,在其他路径下广东人口最多,达1.29亿。
National and provincial population projected to 2100 under the shared socioeconomic pathways in China .https://doi.org/10.12006/j.issn.1673-1719.2016.249 URL [本文引用: 1] 摘要
基于2010年第六次中国人口普查数据,采用IPCC发布的可持续发展(SSP1)、中度发展(SSP2)、局部或不一致发展(SSP3)、不均衡发展(SSP4)、常规发展(SSP5)这5种共享社会经济路径,率定人口-发展-环境分析(PDE)模型中的人口生育率、死亡率、迁移率、教育水平等参数,对2011—2100年中国和31个省(区/市)人口变化进行预估。结果表明:1)不同SSP路径下,中国人口均呈先增加后减少的趋势,在高气候变化挑战的SSP3路径下人口最多,于2035年达到峰值,约14.27亿;在以适应挑战为主的SSP4路径下,人口出现最小值7.02亿。2)SSP1、SSP4和SSP5路径下人均寿命长,人口老龄化严重,其中SSP1和SSP5路径下人均教育水平高,到2100年教育水平在大学以上人口约占总人口的60%;SSP2路径下各年龄段分布比较均衡;SSP3路径下新生人口数量较多,劳动力充足,但教育水平较低。3)到2100年,SPP3路径下广西人口呈现最大值1.13亿,在其他路径下广东人口最多,达1.29亿。
|
| [9] |
全球环境变化海岸易损性研究综述 [J].https://doi.org/10.3321/j.issn:1001-8166.2002.01.016 URL Magsci [本文引用: 1] 摘要
<p>全球变化海岸易损性评估是国际政府间气候变化专门委员会(IPCC)敦促沿海各国应优先开展的一项工作。根据近年来有关海岸易损性的研究成果,可以认为海岸易损性系指海岸带自然、社会经济综合体对全球环境变化和海平面上升的不适应程度。通过阐述IPCC易损性评估的基本方法、内容和目标,指出了海岸易损性评估中存在的问题及改善的方法,最后,结合我国海岸带易损性评估的已有成果,分析了我国海岸易损性评估工作中存在的问题及今后的研究方向。</p>
The advance in studies on coastal vulnerability to global change .https://doi.org/10.3321/j.issn:1001-8166.2002.01.016 URL Magsci [本文引用: 1] 摘要
<p>全球变化海岸易损性评估是国际政府间气候变化专门委员会(IPCC)敦促沿海各国应优先开展的一项工作。根据近年来有关海岸易损性的研究成果,可以认为海岸易损性系指海岸带自然、社会经济综合体对全球环境变化和海平面上升的不适应程度。通过阐述IPCC易损性评估的基本方法、内容和目标,指出了海岸易损性评估中存在的问题及改善的方法,最后,结合我国海岸带易损性评估的已有成果,分析了我国海岸易损性评估工作中存在的问题及今后的研究方向。</p>
|
| [10] |
气候变化影响下2050年广东沿海地区风暴潮风险评估 [J].
随着气候变化的影响,广东沿海地区台风风暴潮灾害时空分布逐渐发生变化。本文根据近30年来广东沿海地区18个验潮站的风暴潮资料以及近60年来西北太平洋热带气旋资料,结合前人对西北太平洋热带气旋与海表温度关系研究以及对珠江三角洲地区海平面上升趋势的预测研究,利用Arc GIS空间分析技术,对2050年广东省沿海地区风暴潮淹没范围进行了预测,并对不同区域风暴潮的危险性进行了分析评价。从社会经济、土地利用、生态环境、滨海构造物和承灾能力5个方面构建风暴潮承灾体脆弱性评估体系,完善了广东省沿海地区风暴潮脆弱性指标预测模型,通过该模型对2050年该地区风暴潮脆弱性进行了评估。在未来气候变化影响下风暴潮灾害危险性评价和脆弱性评估的基础上,对2050年广东沿海地区风暴潮灾害风险进行了综合评估,绘制了该地区风暴潮灾害风险评价图。
Risk assessment of storm surges in the coastal area of Guangdong Province in year 2050 under climate change .
随着气候变化的影响,广东沿海地区台风风暴潮灾害时空分布逐渐发生变化。本文根据近30年来广东沿海地区18个验潮站的风暴潮资料以及近60年来西北太平洋热带气旋资料,结合前人对西北太平洋热带气旋与海表温度关系研究以及对珠江三角洲地区海平面上升趋势的预测研究,利用Arc GIS空间分析技术,对2050年广东省沿海地区风暴潮淹没范围进行了预测,并对不同区域风暴潮的危险性进行了分析评价。从社会经济、土地利用、生态环境、滨海构造物和承灾能力5个方面构建风暴潮承灾体脆弱性评估体系,完善了广东省沿海地区风暴潮脆弱性指标预测模型,通过该模型对2050年该地区风暴潮脆弱性进行了评估。在未来气候变化影响下风暴潮灾害危险性评价和脆弱性评估的基础上,对2050年广东沿海地区风暴潮灾害风险进行了综合评估,绘制了该地区风暴潮灾害风险评价图。
|
| [11] |
中国沿海地区海平面上升脆弱性区划 [J].https://doi.org/10.3969/j.issn.1000-811X.2016.04.018 URL [本文引用: 1] 摘要
以沿海县级行政单元为评估单元,分别从海岸带自然环境和沿海社会经济两个方面,评估中国沿海各地区海平面上升背景下的海岸带脆弱程度,综合区划我国沿海海平面上升的脆弱性。结果表明,海平面上升对我国沿海城市群密集的地带影响甚大,尤其是环渤海沿岸、珠江三角洲和长江三角洲等三个区域是典型的海平面上升影响的脆弱区,沿海地区的发展应充分考虑海平面上升的影响。
The vulnerability zoning research on the sea-level rise of Chinese Coastal .https://doi.org/10.3969/j.issn.1000-811X.2016.04.018 URL [本文引用: 1] 摘要
以沿海县级行政单元为评估单元,分别从海岸带自然环境和沿海社会经济两个方面,评估中国沿海各地区海平面上升背景下的海岸带脆弱程度,综合区划我国沿海海平面上升的脆弱性。结果表明,海平面上升对我国沿海城市群密集的地带影响甚大,尤其是环渤海沿岸、珠江三角洲和长江三角洲等三个区域是典型的海平面上升影响的脆弱区,沿海地区的发展应充分考虑海平面上升的影响。
|
| [12] |
|
| [13] |
长江三角洲及毗连地区海平面上升影响预测与防治对策 [J].https://doi.org/10.3321/j.issn:1006-9267.2000.03.001 URL [本文引用: 1] 摘要
论述了研究地区21世纪前半期的相对海平面上升幅度.研究结论是,研究地区2050年相对海平面上升25~50cm,其中长江三角洲上升幅度较大,高出全球平均值的一倍.海平面上升将产生以下影响:(1)有些岸段侵蚀后退与潮滩下蚀的加剧,侵蚀海岸范围扩大;(2)潮滩与海岸湿地由于侵蚀与淹没而减少;(3)风暴潮频率与强度增加,威胁海岸防护工程的安全;(4)里下河低地与太湖湖东低地排水能力下降,洪涝灾害加剧;(5)长江口盐水入侵加剧.海平面上升影响的综合评估表明:对长江三角洲与太湖湖东低地,特别是上海市的影响最严重,其次是杭州湾北岸,第三是废黄河三角洲,苏北滨海平原与里下河低地的影响最轻。
Prediction and countermeasures of sea level rise in the Yangtze River Delta and adjacent areas .https://doi.org/10.3321/j.issn:1006-9267.2000.03.001 URL [本文引用: 1] 摘要
论述了研究地区21世纪前半期的相对海平面上升幅度.研究结论是,研究地区2050年相对海平面上升25~50cm,其中长江三角洲上升幅度较大,高出全球平均值的一倍.海平面上升将产生以下影响:(1)有些岸段侵蚀后退与潮滩下蚀的加剧,侵蚀海岸范围扩大;(2)潮滩与海岸湿地由于侵蚀与淹没而减少;(3)风暴潮频率与强度增加,威胁海岸防护工程的安全;(4)里下河低地与太湖湖东低地排水能力下降,洪涝灾害加剧;(5)长江口盐水入侵加剧.海平面上升影响的综合评估表明:对长江三角洲与太湖湖东低地,特别是上海市的影响最严重,其次是杭州湾北岸,第三是废黄河三角洲,苏北滨海平原与里下河低地的影响最轻。
|
| [14] |
风暴潮灾害脆弱性研究综述 [J].https://doi.org/10.18306/dlkxjz.2016.07.010 URL [本文引用: 1] 摘要
脆弱性是自然灾害风险研究的热点,风暴潮灾害脆弱性与风暴潮自然过程强度以及沿海社会经济、人口、自然环境等因素相关。本文从风暴潮灾害脆弱性定义出发,对国内外风暴潮灾害社会脆弱性和物理脆弱性进行了回顾,重点对人口、海堤、房屋等风暴潮灾害典型承灾体物理脆弱性研究进展进行了论述,分析了风暴潮灾害脆弱性评价中存在的不确定性,探讨了风暴潮灾害脆弱性在灾害损失评估、保险及再保险、防灾减灾决策支持等领域的应用,对未来风暴潮灾害脆弱性研究提出了以下展望:1开发符合中国沿海区域风暴潮灾害特征和承灾体分布的定量化、精细化脆弱性曲线,拓展风暴潮脆弱性评价结果在保险理赔、灾害损失评估等领域应用;2气候变化背景下中国沿海面临风暴潮巨灾风险,迫切需要建立科学的基于灾害实地踏勘以及物模实验、数值模拟相结合的风暴潮灾害典型承灾体脆弱性评估方法模型。
A review of research on vulnerability to storm surges .https://doi.org/10.18306/dlkxjz.2016.07.010 URL [本文引用: 1] 摘要
脆弱性是自然灾害风险研究的热点,风暴潮灾害脆弱性与风暴潮自然过程强度以及沿海社会经济、人口、自然环境等因素相关。本文从风暴潮灾害脆弱性定义出发,对国内外风暴潮灾害社会脆弱性和物理脆弱性进行了回顾,重点对人口、海堤、房屋等风暴潮灾害典型承灾体物理脆弱性研究进展进行了论述,分析了风暴潮灾害脆弱性评价中存在的不确定性,探讨了风暴潮灾害脆弱性在灾害损失评估、保险及再保险、防灾减灾决策支持等领域的应用,对未来风暴潮灾害脆弱性研究提出了以下展望:1开发符合中国沿海区域风暴潮灾害特征和承灾体分布的定量化、精细化脆弱性曲线,拓展风暴潮脆弱性评价结果在保险理赔、灾害损失评估等领域应用;2气候变化背景下中国沿海面临风暴潮巨灾风险,迫切需要建立科学的基于灾害实地踏勘以及物模实验、数值模拟相结合的风暴潮灾害典型承灾体脆弱性评估方法模型。
|
| [15] |
风暴潮灾害风险评估研究综述 [J].https://doi.org/10.11867/j.issn.1001-8166.2013.08.0866 URL Magsci [本文引用: 1] 摘要
<p>我国是受风暴潮影响最严重的少数国家之一,风暴潮灾害致灾机理的研究在过去几十年取得了极大的进展,而风暴潮脆弱性评估和综合风险评估还不能满足风暴潮灾害风险管理的需求。系统总结了风暴潮危险性、脆弱性、综合风险评估及其应用的研究进展,重点分析了典型重现期风暴潮估计、可能最大风暴潮计算、风暴潮物理脆弱性和社会脆弱性评估以及风暴潮风险评估及其应用的研究进展及不足,并对我国风暴潮风险评估急需解决的问题以及未来的研究重点进行了展望,指出了风暴潮灾害风险评估的模型化、系统化、定量化是未来风暴潮风险评估研究的发展趋势,风暴潮灾害的未来风险评估还需考虑全球气候变化以及海平面上升等因素的影响,而风暴潮灾害承灾体脆弱性的定量评价是风暴潮综合风险评估的重点和难点。</p>
A review of risk assessment of storm surge disaster .https://doi.org/10.11867/j.issn.1001-8166.2013.08.0866 URL Magsci [本文引用: 1] 摘要
<p>我国是受风暴潮影响最严重的少数国家之一,风暴潮灾害致灾机理的研究在过去几十年取得了极大的进展,而风暴潮脆弱性评估和综合风险评估还不能满足风暴潮灾害风险管理的需求。系统总结了风暴潮危险性、脆弱性、综合风险评估及其应用的研究进展,重点分析了典型重现期风暴潮估计、可能最大风暴潮计算、风暴潮物理脆弱性和社会脆弱性评估以及风暴潮风险评估及其应用的研究进展及不足,并对我国风暴潮风险评估急需解决的问题以及未来的研究重点进行了展望,指出了风暴潮灾害风险评估的模型化、系统化、定量化是未来风暴潮风险评估研究的发展趋势,风暴潮灾害的未来风险评估还需考虑全球气候变化以及海平面上升等因素的影响,而风暴潮灾害承灾体脆弱性的定量评价是风暴潮综合风险评估的重点和难点。</p>
|
| [16] |
沿海城市自然灾害脆弱性评估研究进展 [J].https://doi.org/10.3969/j.issn.1000-811X.2007.01.023 URL [本文引用: 1] 摘要
对于经济发达、人口密集,但自然灾害频发、易受损的沿海城市,自然灾害脆弱性评价研究具有重要的科学价值与现实意义。综述了该领域的国内外研究进展,对我国沿海城市所面临的自然灾害的高风险性提出了综合脆弱性评价理念。
Progress in vulnerability assessment of natural disasters in coastal cities .https://doi.org/10.3969/j.issn.1000-811X.2007.01.023 URL [本文引用: 1] 摘要
对于经济发达、人口密集,但自然灾害频发、易受损的沿海城市,自然灾害脆弱性评价研究具有重要的科学价值与现实意义。综述了该领域的国内外研究进展,对我国沿海城市所面临的自然灾害的高风险性提出了综合脆弱性评价理念。
|
| [17] |
中国沿海地区风暴潮灾害综合脆弱性评估 [D] .Assessment on comprehensive vulnerability of storm surge disasters of China's coastal regions . |
| [18] |
气候变化影响下海岸带脆弱性评估研究进展 [J].https://doi.org/10.5846/stxb201109291437 URL Magsci [本文引用: 2] 摘要
近百年来,全球气候系统正经历着以全球变暖为主要特征的显著变化。研究海岸带系统对气候变化的响应机制,评估气候变化对海岸带社会、经济和生态的潜在影响,提出切实可行的应对策略,是保障海岸带系统安全的重要前提。回顾了IPCC的四次评估报告,分析了全球气候变化对海岸带的影响。总结了海岸带脆弱性评估框架以及脆弱性评价指标体系,综述了国内外气候变化影响下海岸带脆弱性评估研究的进展。在综述国内外该领域研究进展的基础上,展望了气候变化影响下海岸带脆弱性评估研究。全球气候变化及其对海岸带的影响还有大量的科学技术问题需要进一步探讨,同时也需要对各种适应气候变化措施的可行性和有效性进行研究和验证。
Research into vulnerability assessment for coastal zones in the context of climate change .https://doi.org/10.5846/stxb201109291437 URL Magsci [本文引用: 2] 摘要
近百年来,全球气候系统正经历着以全球变暖为主要特征的显著变化。研究海岸带系统对气候变化的响应机制,评估气候变化对海岸带社会、经济和生态的潜在影响,提出切实可行的应对策略,是保障海岸带系统安全的重要前提。回顾了IPCC的四次评估报告,分析了全球气候变化对海岸带的影响。总结了海岸带脆弱性评估框架以及脆弱性评价指标体系,综述了国内外气候变化影响下海岸带脆弱性评估研究的进展。在综述国内外该领域研究进展的基础上,展望了气候变化影响下海岸带脆弱性评估研究。全球气候变化及其对海岸带的影响还有大量的科学技术问题需要进一步探讨,同时也需要对各种适应气候变化措施的可行性和有效性进行研究和验证。
|
| [19] |
多驱动因素下海岸带脆弱性研究进展 [J].https://doi.org/10.11840/j.issn.1001-6392.2015.04.001 URL [本文引用: 1] 摘要
基于大量有关海岸带脆弱性文献的分析梳理,从动态角度构建了海岸带脆弱性概念体系,重点总结了引发海岸带脆 弱性问题的驱动因素及其作用机制。在此基础上,深入分析了海岸带脆弱性定量评估方法与其适用范围和优缺点,包括 I PCC 通用方法、PSR 模型、CVI指数等。海岸带极端气候事件和相关风险事件发生机制研究、海岸带自然生态系统的适应能 力研究、人地系统要素过程的综合集成研究以及地方性在脆弱性评估中的应用研究将是未来海岸带脆弱性研究的主要方向。
Research progress of coastal vulnerability to varied driving factors .https://doi.org/10.11840/j.issn.1001-6392.2015.04.001 URL [本文引用: 1] 摘要
基于大量有关海岸带脆弱性文献的分析梳理,从动态角度构建了海岸带脆弱性概念体系,重点总结了引发海岸带脆 弱性问题的驱动因素及其作用机制。在此基础上,深入分析了海岸带脆弱性定量评估方法与其适用范围和优缺点,包括 I PCC 通用方法、PSR 模型、CVI指数等。海岸带极端气候事件和相关风险事件发生机制研究、海岸带自然生态系统的适应能 力研究、人地系统要素过程的综合集成研究以及地方性在脆弱性评估中的应用研究将是未来海岸带脆弱性研究的主要方向。
|
| [20] |
海平面上升及其风险管理 [J].https://doi.org/10.11867/j.issn.1001-8166.2018.04.0350 URL [本文引用: 1] 摘要
海平面上升是人为气候变暖最为严重的后果之一。近年来海平面上升及其风险管理研究与实践取得了突破性进展:(1)海平面上升作为一种致灾因子,需要预测未来可能的情景及其概率,并关注低概率高影响的上限情景。为此,近年来发展了完全概率估计方法,以典型浓度路径和共享社会经济路径情景为条件,对未来海平面上升进行多情景及其概率估算。(2)在高排放情景下,冰盖模式模拟得出南极冰盖到2100年对海平面的贡献高达0.78~1.50 m,远高出IPCC第五次报告的估计。(3)21世纪末的全球平均海平面(GMSL)上限由原来的2.0 m调高为2.5 m,并指出21世纪之后,海平面上升仍很可能加速,但上升的不确定性将增大。(4)发展了综合考虑极端情景和中间情景、适应对策路径和稳健决策等方法,进行长周期关键项目决策、规划和风险管理,以管理海平面上升的潜在影响和风险。海平面上升及其风险管理研究今后需要加强监测、分析和模拟来预测不同时间尺度全球、区域和地方海平面上升的情景和概率,加强冰盖的动力过程和突变研究,减小海平面上升预测的不确定性,评估其上限情景,加强深度不确定性下的风险决策方法及其应用研究,以满足沿海地区气候变化适应规划和风险管理决策的需求。
Sea level rise and its risk management .https://doi.org/10.11867/j.issn.1001-8166.2018.04.0350 URL [本文引用: 1] 摘要
海平面上升是人为气候变暖最为严重的后果之一。近年来海平面上升及其风险管理研究与实践取得了突破性进展:(1)海平面上升作为一种致灾因子,需要预测未来可能的情景及其概率,并关注低概率高影响的上限情景。为此,近年来发展了完全概率估计方法,以典型浓度路径和共享社会经济路径情景为条件,对未来海平面上升进行多情景及其概率估算。(2)在高排放情景下,冰盖模式模拟得出南极冰盖到2100年对海平面的贡献高达0.78~1.50 m,远高出IPCC第五次报告的估计。(3)21世纪末的全球平均海平面(GMSL)上限由原来的2.0 m调高为2.5 m,并指出21世纪之后,海平面上升仍很可能加速,但上升的不确定性将增大。(4)发展了综合考虑极端情景和中间情景、适应对策路径和稳健决策等方法,进行长周期关键项目决策、规划和风险管理,以管理海平面上升的潜在影响和风险。海平面上升及其风险管理研究今后需要加强监测、分析和模拟来预测不同时间尺度全球、区域和地方海平面上升的情景和概率,加强冰盖的动力过程和突变研究,减小海平面上升预测的不确定性,评估其上限情景,加强深度不确定性下的风险决策方法及其应用研究,以满足沿海地区气候变化适应规划和风险管理决策的需求。
|
| [21] |
|
| [22] |
中国沿海地区相对海平面上升的影响及地面沉降防治策略 [J].https://doi.org/10.3969/j.issn.1001-7119.2001.06.010 URL [本文引用: 1] 摘要
沿海地区为我国经济社会发展的重要区域,但地势低平,生态环境极 其敏感和脆弱.相对海平面上升已成为21世纪我国沿海地区实现可持续发展面临的重大环境问题,而地面沉降是造成我国沿海地区相对海平面上升的主导和决定因 素.为保证地下水资源的持续利用,以实现沿海地区资源、环境、经济和社会的可持续发展,必须对地下水资源进行科学规划、系统管理、优化开采、人工回灌,走 生态化道路.
Impacts of relative sea-level rising and strategies of control of land subsidence in coastal region of China .https://doi.org/10.3969/j.issn.1001-7119.2001.06.010 URL [本文引用: 1] 摘要
沿海地区为我国经济社会发展的重要区域,但地势低平,生态环境极 其敏感和脆弱.相对海平面上升已成为21世纪我国沿海地区实现可持续发展面临的重大环境问题,而地面沉降是造成我国沿海地区相对海平面上升的主导和决定因 素.为保证地下水资源的持续利用,以实现沿海地区资源、环境、经济和社会的可持续发展,必须对地下水资源进行科学规划、系统管理、优化开采、人工回灌,走 生态化道路.
|
| [23] |
自然灾害脆弱性曲线研究进展 [J].https://doi.org/10.11867/j.issn.1001-8166.2012.04.0435 URL Magsci [本文引用: 1] 摘要
<p>在全球变化与全球化背景下自然灾害风险逐年增大,灾害评估就成为风险防范的重要基础。灾害评估包括灾情估算与风险评估2个方面, 而脆弱性分析是把灾害与风险研究紧密联系起来的重要桥梁。脆弱性曲线作为定量精确评估承灾体脆弱性的方法,近年来在多领域被广泛运用,成为灾情估算、风险定量分析以及风险地图编制的关键环节。从致灾因子角度综述脆弱性曲线的研究进展,重点阐述基于灾情数据、已有曲线、调查和模型的脆弱性曲线构建。研究表明脆弱性曲线构建由单曲线向多曲线库、单一参数向综合参数、单一方法向多领域综合应用发展,具有综合化和精细化的趋势。进一步开展多领域、多方法综合脆弱性曲线研究,对灾损快速评估及风险评价,防灾减灾具有重要意义。</p>
A review on development of vulnerability curve of natural disaster .https://doi.org/10.11867/j.issn.1001-8166.2012.04.0435 URL Magsci [本文引用: 1] 摘要
<p>在全球变化与全球化背景下自然灾害风险逐年增大,灾害评估就成为风险防范的重要基础。灾害评估包括灾情估算与风险评估2个方面, 而脆弱性分析是把灾害与风险研究紧密联系起来的重要桥梁。脆弱性曲线作为定量精确评估承灾体脆弱性的方法,近年来在多领域被广泛运用,成为灾情估算、风险定量分析以及风险地图编制的关键环节。从致灾因子角度综述脆弱性曲线的研究进展,重点阐述基于灾情数据、已有曲线、调查和模型的脆弱性曲线构建。研究表明脆弱性曲线构建由单曲线向多曲线库、单一参数向综合参数、单一方法向多领域综合应用发展,具有综合化和精细化的趋势。进一步开展多领域、多方法综合脆弱性曲线研究,对灾损快速评估及风险评价,防灾减灾具有重要意义。</p>
|
| [24] |
近十年我国海平面变化研究进展 [J].https://doi.org/10.3876/j.issn.1000-1980.2015.05.008 URL [本文引用: 1] 摘要
系统地回顾了2006—2015年我国在海平面变化规律、机制及影响领域的最新研究进展。分析了全球及区域海平面以及比容海平面在不同时间尺度上的变化规律;探讨了海平面的变化机制,海表热通量、淡水通量、环流、风应力以及Rossby波对不同区域海平面变化的动力及热力影响;采用统计方法和数值模拟等手段,对21世纪海平面变化进行了预测;同时海平面变化会影响海洋的动力过程(如潮波系统的变化),并进而对近海和海岸带环境产生重要影响(如海岸侵蚀、海水入侵和土地盐渍化、河口咸潮入侵、近岸低地淹没、红树林衰退等)。
Advances in research on sea level variations in China from 2006 to 2015 .https://doi.org/10.3876/j.issn.1000-1980.2015.05.008 URL [本文引用: 1] 摘要
系统地回顾了2006—2015年我国在海平面变化规律、机制及影响领域的最新研究进展。分析了全球及区域海平面以及比容海平面在不同时间尺度上的变化规律;探讨了海平面的变化机制,海表热通量、淡水通量、环流、风应力以及Rossby波对不同区域海平面变化的动力及热力影响;采用统计方法和数值模拟等手段,对21世纪海平面变化进行了预测;同时海平面变化会影响海洋的动力过程(如潮波系统的变化),并进而对近海和海岸带环境产生重要影响(如海岸侵蚀、海水入侵和土地盐渍化、河口咸潮入侵、近岸低地淹没、红树林衰退等)。
|
| [25] |
Evaluating flood resilience strategies for coastal megacities [J].https://doi.org/10.1126/science.1248222 URL [本文引用: 2] |
| [26] |
FLOPROS: An evolving global database of flood protection standards [J].https://doi.org/10.5194/nhess-16-1049-2016 URL [本文引用: 1] 摘要
With projected changes in climate, population and socioeconomic activity located in flood-prone areas, the global assessment of flood risk is essential to inform climate change policy and disaster risk management. Whilst global flood risk models exist for this purpose, the accuracy of their results is greatly limited by the lack of information on the current standard of protection to floods, with studies either neglecting this aspect or resorting to crude assumptions. Here we present a first global database of FLOod PROtection Standards, FLOPROS, which comprises information in the form of the flood return period associated with protection measures, at different spatial scales. FLOPROS comprises three layers of information, and combines them into one consistent database. The design layer contains empirical information about the actual standard of existing protection already in place; the policy layer contains information on protection standards from policy regulations; and the model layer uses a validated modelling approach to calculate protection standards. The policy layer and the model layer can be considered adequate proxies for actual protection standards included in the design layer, and serve to increase the spatial coverage of the database. Based on this first version of FLOPROS, we suggest a number of strategies to further extend and increase the resolution of the database. Moreover, as the database is intended to be continually updated, while flood protection standards are changing with new interventions, FLOPROS requires input from the flood risk community. We therefore invite researchers and practitioners to contribute information to this evolving database by corresponding to the authors.
|
| [27] |
Development of an operational tool for Global Vulnerability Assessment (GVA): Update of the number of people at risk due to sea level rise and increasing flooding probability [M]. |
| [28] |
A simple raster-based model for flood inundation simulation [J].https://doi.org/10.1016/S0022-1694(00)00278-X URL [本文引用: 1] 摘要
In this paper the development of a new model for simulating flood inundation is outlined. The model is designed to operate with high-resolution raster Digital Elevation Models, which are becoming increasingly available for many lowland floodplain rivers and is based on what we hypothesise to be the simplest possible process representation capable of simulating dynamic flood inundation. This consists of a one-dimensional kinematic wave approximation for channel flow solved using an explicit finite difference scheme and a two-dimensional diffusion wave representation of floodplain flow. The model is applied to a 35 km reach of the River Meuse in The Netherlands using only published data sources and used to simulate a large flood event that occurred in January 1995. This event was chosen as air photo and Synthetic Aperture Radar (SAR) data for flood inundation extent are available to enable rigorous validation of the developed model. 100, 50 and 25 m resolution models were constructed and compared to two other inundation prediction techniques: a planar approximation to the free surface and a relatively coarse resolution two-dimensional finite element scheme. The model developed in this paper outperforms both the simpler and more complex process representations, with the best fit simulation correctly predicting 81.9% of inundated and non-inundated areas. This compares with 69.5% for the best fit planar surface and 63.8% for the best fit finite element code. However, when applied solely to the 7 km of river below the upstream gauging station at Borgharen the planar model performs almost as well (83.7% correct) as the raster model (85.5% correct). This is due to the proximity of the gauge, which acts as a control point for construction of the planar surface and the fact that here low-lying areas of the floodplain are hydraulically connected to the channel. Importantly though it is impossible to generalise such application rules and thus we cannot specify a priori where the planar approximation will work. Simulations also indicate that, for this event at least, dynamic effects are relatively unimportant for prediction of peak inundation. Lastly, consideration of errors in typically available gauging station and inundation extent data shows the raster-based model to be close to the current prediction limit for this class of problem.
|
| [29] |
JFLOW: A multiscale two-dimensional dynamic flood model [J].https://doi.org/10.1111/j.1747-6593.2005.00011.x URL [本文引用: 1] 摘要
A multiscale two-dimensional (2D) dynamic flood model, known as JFLOW, has been developed by JBA Consulting for simulation of overland flooding. This paper first describes the background to the model development before explaining its technical basis. The model is based on a 2D diffusion wave equation and the computational engine has been linked with a geographic information system interface to provide a stand-alone product. It has been applied on a variety of different scales which are illustrated in a number of example applications.
|
| [30] |
Implications of sea-level rise and extreme events around Europe: A review of coastal energy infrastructure [J].https://doi.org/10.1007/s10584-013-0996-9 URL [本文引用: 1] 摘要
Sea-level rise and extreme events have the potential to significantly impact coastal energy infrastructure through flooding and erosion. Disruptions to supply, transportation and storage of energy have global ramifications and potential contamination of the natural environment. On a European scale, there is limited information about energy facilities and their strategic plans for adapting to climate change. Using a Geographical Information System this paper assesses coastal energy infrastructure, comprising (1) oil/gas/LNG/tanker terminals and (2) nuclear power stations. It discusses planning and adaptation for sea-level rise and extreme events. Results indicate 158 major oil/gas/LNG/tanker terminals in the European coastal zone, with 40 % located on the North Sea coast. There are 71 operating nuclear reactors on the coast (37 % of the total of European coastal countries), with further locations planned in the Black, Mediterranean and Baltic Seas. The UK has three times more coastal energy facilities than any other country. Many north-west European countries who have a high reliance on coastal energy infrastructure have a high awareness of sea-level rise and plan for future change. With long design lives of energy facilities, anticipating short, medium and long-term environmental and climatic change is crucial in the design, future monitoring and maintenance of facilities. Adaptation of coastal infrastructure is of international importance, so will be an ongoing important issue throughout the 21 st century.
|
| [31] |
Coastal erosion in China under the condition of global climate change and measures for its prevention [J].https://doi.org/10.1016/j.pnsc.2008.05.034 URL [本文引用: 1] 摘要
The general characteristics of coastal erosion in China are described in terms of the regional geography, the form of erosion, the causes of erosion, and the challenges we are facing. The paper highlights the relationship between coastal erosion and sea level rises, storm waves and tides, and the influence of global climate changes on coastal erosion along the coastal zone of China. The response of the risk of coastal erosion in China to climate changes has obvious regional diversity. Research into and the forecasting of the effects of climate changes on coastal erosion are systemic work involving the natural environment, social economy, and alongshore engineering projects in the global system. Facing global warming and continual enhancement of coastal erosion, suggestions for basic theoretical study, prevention technology, management system assurance, and strengthening the legal system are presented here.
|
| [32] |
Sea-level rise by 2100 [J].URL PMID: 24357297 [本文引用: 1] 摘要
Not Available
|
| [33] |
Temporal and spatial changes in social vulnerability to natural hazards [J].https://doi.org/10.1073/pnas.0710375105 URL PMID: 18268336 [本文引用: 1] 摘要
During the past four decades (1960-2000), the United States experienced major transformations in population size, development patterns, economic conditions, and social characteristics. These social, economic, and built-environment changes altered the American hazardscape in profound ways, with more people living in high-hazard areas than ever before. To improve emergency management, it is important to recognize the variability in the vulnerable populations exposed to hazards and to develop place-based emergency plans accordingly. The concept of social vulnerability identifies sensitive populations that may be less likely to respond to, cope with, and recover from a natural disaster. Social vulnerability is complex and dynamic, changing over space and through time. This paper presents empirical evidence on the spatial and temporal patterns in social vulnerability in the United States from 1960 to the present. Using counties as our study unit, we found that those components that consistently increased social vulnerability for all time periods were density (urban), race/ethnicity, and socioeconomic status. The spatial patterning of social vulnerability, although initially concentrated in certain geographic regions, has become more dispersed over time. The national trend shows a steady reduction in social vulnerability, but there is considerable regional variability, with many counties increasing in social vulnerability during the past five decades.
|
| [34] |
Spatial-temporal changes of coastal and marine disasters risks and impacts in Mainland China [J].https://doi.org/10.1016/j.ocecoaman.2017.02.003 URL [本文引用: 1] 摘要
61A regional database of multiple coastal and marine disaster impacts was built for China.61Substantial progress in coastal and marine disasters prevention and migration.61Regional variation exits in spatial patterns of hazard, exposure and vulnerability.61Growing risk from climate change and increasing human-induced pressures.
|
| [35] |
Assessment and mapping of potential storm surge impacts on global population and economy [J].https://doi.org/10.1007/s13753-014-0035-0 URL [本文引用: 1] 摘要
With global climate change, population growth, and economic development in the twenty-first century, large cyclonic storm surges may result in devastating effects in some coastal areas of the world. However, due to the deficiency of global data and large-scale modeling efforts, the assessment and mapping of potential storm surge impacts at the global level are limited. In this article, the potential inundated area of global coastal zones is projected using information diffusion theory, based on the historical hourly sea-level observation records from the University of Hawaii Sea Level Center (UHSLC), considering variations in coastal morphology and tropical cyclone tracks. Combined with global demographic and GDP data, population and GDP at risk of storm surge impacts are calculated, mapped, and validated through the comparison with historical losses. The resulting potential impact maps provide a preliminary outlook on risks that may help governments of countries to make storm surge disaster prevention and reduction plans.
|
| [36] |
HAZUS-MH flood model: Technical manual [EB/OL]. 2015-12-01[ |
| [37] |
Assessing changes in extreme sea levels along the coast of China [J].https://doi.org/10.1002/2015JC011336 URL [本文引用: 1] 摘要
Hourly tide-gauge data along the coast of China are used to evaluate changes in extreme water levels in the past several decades. Mean sea level, astronomical tide, nontidal component and the tide-surge interaction was analyzed separately to assess their roles in the changes of extreme sea levels. Mean sea level at five tide gauges, Kanmen, Keelung, Zhapo, Xiamen and Quarrybay, show significant increasing trends during the past decades (1954-2013) with a rate of about 1.4-3.5 mm/yr. At Keelung, Kaohsiung and Quarrybay the mean high waters increased during 1954-2013 with a rate from 0.6 to 1.8 mm/yr, while the annual mean tidal range rose at the same time by 0.9 to 3.8 mm/yr. In terms of storm surge intensities, there is interannual variability and decadal variability but five tide gauges show significant decreasing trends, and three gauges, at Keelung, Xiamen and Quarrybay, exhibited significant increases of extreme sea levels with trends of 1.5-6.0 mm/yr during 1954-2013. Significant tide-surge interactions were found at all 12 tide gauges, but no obvious change was found during the past few decades. The changes in extreme sea levels in this area are strongly related to the changes of mean sea levels (MSL). At gauges, where the tide-surge interaction is large, the astronomic tides are also an important factor for the extreme sea levels, whereas tide gauges with little tide-surge interaction, the changes of wind driven storm surge component adds to the change of the extreme sea levels.
|
| [38] |
Sea level extremes at the coasts of China [J].https://doi.org/10.1002/2013JC009607 URL [本文引用: 1] 摘要
Hourly sea level records from 1954 to 2012 at 20 tide gauges at and adjacent to the Chinese coasts are used to analyze extremes in sea level and in tidal residual. Tides and tropical cyclones determine the spatial distribution of sea level maxima. Tidal residual maxima are predominantly determined by tropical cyclones. The 50 year return level is found to be sensitive to the number of extreme events used in the estimation. This is caused by the small number of tropical cyclone events happening each year which lead to other local storm events included thus significantly affecting the estimates. Significant increase in sea level extremes is found with trends in the range between 2.0 and 14.1 mm yr 1. The trends are primarily driven by changes in median sea level but also linked with increases in tidal amplitudes at three stations. Tropical cyclones cause significant interannual variations in the extremes. The interannual variability in the sea level extremes is also influenced by the changes in median sea level at the north and by the 18.6 year nodal cycle at the South China Sea. Neither of PDO and ENSO is found to be an indicator of changes in the size of extremes, but ENSO appears to regulate the number of tropical cyclones that reach the Chinese coasts. Global mean atmospheric temperature appears to be a good descriptor of the interannual variability of tidal residual extremes induced by tropical cyclones but the trend in global temperature is inconsistent with the lack of trend in the residuals.
|
| [39] |
Ecological forecasting: New tools for coastal and marine ecosystem management [M]. |
| [40] |
Integrated flood risk management in England and Wales [J].https://doi.org/10.1061/(ASCE)1527-6988(2003)4:3(126) URL [本文引用: 1] |
| [41] |
Future flood losses in major coastal cities [J]. |
| [42] |
A global ranking of port cities with high exposure to climate extremes [J].https://doi.org/10.1007/s10584-010-9977-4 URL [本文引用: 2] |
| [43] |
Integrating knowledge to assess coastal vulnerability to sea-level rise: The development of the DIVA tool [J].https://doi.org/10.1016/j.gloenvcha.2009.03.002 URL [本文引用: 1] 摘要
This paper describes the development of the DIVA tool, a user-friendly tool for assessing coastal vulnerability from subnational to global levels. The development involved the two major challenges of integrating knowledge in the form of data, scenarios and models from various natural, social and engineering science disciplines and making this integrated knowledge accessible to a broad community of end-users. These challenges were addressed by (i) creating and applying the DIVA method, an iterative, modular method for developing integrating models amongst distributed partners and (ii) making the data, scenarios and integrated model, equipped with a powerful graphical user interface, directly and freely available to end-users.
|
| [44] |
Coastal flood damage and adaptation costs under 21st century sea-level rise [J].https://doi.org/10.1073/pnas.1222469111 URL PMID: 24596428 [本文引用: 3] 摘要
Abstract Coastal flood damage and adaptation costs under 21st century sea-level rise are assessed on a global scale taking into account a wide range of uncertainties in continental topography data, population data, protection strategies, socioeconomic development and sea-level rise. Uncertainty in global mean and regional sea level was derived from four different climate models from the Coupled Model Intercomparison Project Phase 5, each combined with three land-ice scenarios based on the published range of contributions from ice sheets and glaciers. Without adaptation, 0.2-4.6% of global population is expected to be flooded annually in 2100 under 25-123 cm of global mean sea-level rise, with expected annual losses of 0.3-9.3% of global gross domestic product. Damages of this magnitude are very unlikely to be tolerated by society and adaptation will be widespread. The global costs of protecting the coast with dikes are significant with annual investment and maintenance costs of US$ 12-71 billion in 2100, but much smaller than the global cost of avoided damages even without accounting for indirect costs of damage to regional production supply. Flood damages by the end of this century are much more sensitive to the applied protection strategy than to variations in climate and socioeconomic scenarios as well as in physical data sources (topography and climate model). Our results emphasize the central role of long-term coastal adaptation strategies. These should also take into account that protecting large parts of the developed coast increases the risk of catastrophic consequences in the case of defense failure.
|
| [45] |
Sea-level rise scenarios and coastal risk management [J].https://doi.org/10.1038/nclimate2505 URL [本文引用: 1] 摘要
The IPCC's global mean sea-level rise scenarios do not necessarily provide the right information for coastal decision-making and risk management.
|
| [46] |
Sea level rise: A global vulnerability assessment: Vulnerability assessment for population, coastal wetlands and rice production on a global scale [M]. |
| [47] |
Flood-induced mortality across the globe: Spatiotemporal pattern and influencing factors [J].https://doi.org/10.1016/j.scitotenv.2018.06.197 URL [本文引用: 1] 摘要
Impacts of floods on human society have been drawing increasing human concerns in recent years. In this study, flood observations from EM-DAT (Emergency Events Database) and DFO (Dartmouth Flood Observatory) datasets were analyzed to investigate frequency and intensity of floods, and flood-induced mortality, flood-affected population as well during 1975 2016 across the globe. Results indicated that: (1) occurrence rate of floods, flood-induced mortality and flood-affected population were generally increasing globally. However, flood-induced mortality and flood-affected people per flood event were in slight decrease, indicating that flood-induced mortality and flood-affected people due to increased floods exceeded those by individual flood event; (2) annual variation of mortality per flood event is highly related to floods with higher intensity. Specifically, the flood frequency and flood-induced mortality are the largest in Asia, specifically in China, India, Indonesia and Philippine; while significantly increased flood-affected population and mean annual mortality was detected in China, USA and Australia; (3) tropical cyclones (TC) are closely related to flood-induced mortality in parts of the countries along the western coast of the oceans. The frequency of channel floods in these regions is the largest and large proportion of flood-induced deaths and the highest flood-induced mortality can be attributed to TC-induced flash floods; (4) Population density and GDP per unit area are in significantly positive correlation with the number of flood-related victims per unit area, number of deaths and economic losses with exception of low-income countries. However, the flood-affected population and flood-induced mortality increase with decrease of per capita GDP; while the per capita economic loss increases with the increase of per capita GDP, indicating that the higher the population density and GDP per unit for a region, the higher sensitivity of this area to flood hazards.
|
| [48] |
|
| [49] |
|
| [50] |
Upper limit for sea level projections by 2100 [J].
We construct the probability density function of global sea level at 2100, estimating that sea level rises larger than 180 cm are less than 5% probable. An upper limit for global sea level rise of 190 cm is assembled by summing the highest estimates of individual sea level rise components simulated by process based models with the RCP8.5 scenario. The agreement between the methods may suggest more confidence than is warranted since large uncertainties remain due to the lack of scenario-dependent projections from ice sheet dynamical models, particularly for mass loss from marine-based fast flowing outlet glaciers in Antarctica. This leads to an intrinsically hard to quantify fat tail in the probability distribution for global mean sea level rise. Thus our low probability upper limit of sea level projections cannot be considered definitive. Nevertheless, our upper limit of 180 cm for sea level rise by 2100 is based on both expert opinion and process studies and hence indicates that other lines of evidence are needed to justify a larger sea level rise this century. (letter)
|
| [51] |
Global exposure to river and coastal flooding: Long term trends and changes [J].https://doi.org/10.1016/j.gloenvcha.2012.07.004 URL [本文引用: 1] 摘要
Flood damage modelling has traditionally been limited to the local, regional or national scale. Recent flood events, population growth and climate change concerns have increased the need for global methods with both spatial and temporal dynamics. This paper presents a first estimation of global economic exposure to both river and coastal flooding for the period 1970 2050, using two different methods for damage assessment. One method is based on population and the second is based on land-use within areas subject to 1/100 year flood events. On the basis of population density and GDP per capita, we estimate a total global exposure to river and coastal flooding of 46 trillion USD in 2010. By 2050, these numbers are projected to increase to 158 trillion USD. Using a land-use based assessment, we estimated a total flood exposure of 27 trillion USD in 2010. For 2050 we simulate a total exposure of 80 trillion USD. The largest absolute exposure changes between 1970 and 2050 are simulated in North America and Asia. In relative terms we project the largest increases in North Africa and Sub-Saharan Africa. The models also show systematically larger growth in the population living within hazard zones compared to total population growth. While the methods unveil similar overall trends in flood exposure, there are significant differences in the estimates and geographical distribution. These differences result from inherent model characteristics and the varying relationship between population density and the total urban area in the regions of analysis. We propose further research on the modelling of inundation characteristics and flood protection standards, which can complement the methodologies presented in this paper to enable the development of a global flood risk framework.
|
| [52] |
Loss of life due to floods [J].https://doi.org/10.1111/j.1753-318X.2008.00006.x URL [本文引用: 1] 摘要
This article gives an overview of the research on loss of life due to floods. The limited information regarding this topic is presented and evaluated. Analysis of global data for different flood types shows that the magnitude of mortality is related to the severity of the flood effects and the possibilities for warning and evacuation. Information from historical flood events gives a more detailed insight into the factors that determine mortality for an event, such as flood characteristics and the effectiveness of warning and evacuation. At the individual level, the occurrence of fatalities will be influenced by behaviour and individual vulnerability factors. Existing methods for the estimation of loss of life that have been developed for different types of floods in different regions are briefly discussed. A new method is presented for the estimation of loss of life due to floods of low-lying areas protected by flood defences. It can be used to analyse the consequences and risks of flooding and thereby provide a basis for risk evaluation and decision-making. The results of this research can contribute to the development of strategies to prevent and mitigate the loss of life due to floods.
|
| [53] |
Evaluation of farmland losses from sea level rise and storm surges in the Pearl River Delta region under global climate change [J].https://doi.org/10.1007/s11442-016-1278-z URL [本文引用: 2] 摘要
The Pearl River Delta on China's coast is a region that is seriously threatened by sea level rise and storm surges induced by global climate change, which causes flooding of large areas of farmland and huge agricultural losses. Based on relevant research and experience, a loss evaluation model of farmland yield caused by sea level rise and storm surges was established. In this model, the area of submerged farmland, area of crops, and per unit yield of every type of crop were considered, but the impact of wind, flooding time, changes in land use and plant structure were not considered for long-term prediction. Taking the Pearl River Delta region in Guangdong as the study area, we estimated and analyzed the spatial distribution and loss of farmlands for different scenarios in the years 2030, 2050, and 2100, using a digital elevation model, land-use data, local crop structure, rotation patterns, and yield loss ratios for different submerged heights obtained from field survey and questionnaires. The results show that the proportion of submerged farmlands and losses of agricultural production in the Pearl River Delta region will increase gradually from 2030 to 2100. Yangjiang, Foshan, and Dongguan show obvious increases in submerged farmlands, while Guangzhou and Zhuhai show slow increases. In agricultural losses, vegetables would sustain the largest loss of production, followed by rice and peanuts. The greatest loss of rice crops would occur in Jiangmen, and the loss of vegetable crops would be high in Shanwei and Jiangmen. Although losses of peanut crops are generally lower, Jiangmen, Guangzhou, and Shanwei would experience relatively high losses. Finally, some measures to defend against storm surges are suggested, such as building sea walls and gates in Jiangmen, Huizhou, and Shanwei, enforcing ecological protection to reduce destruction from storm surges, and strengthening disaster warning systems.
|
| [54] |
Exposure and vulnerability to climate extremes: Population and asset exposure to coastal flooding in Dar es Salaam, Tanzania [J].https://doi.org/10.1007/s10113-011-0239-4 URL [本文引用: 1] 摘要
The paper provides a first quantitative estimate of the potential number of people and value of assets exposed to coastal flooding in Dar es Salaam, Tanzania. The study used an elevation-based geographic information system-analysis based on physical exposure and socio-economic vulnerability under a range of climate and socio-economic scenarios. It particularly considered a worst-case scenario assuming even if defences (natural and/or man-made) exist, they are subjected to failure under a 100-year flood event. About 8% of Dar es Salaam lies within the low-elevation coastal zone (below the 10 m contour lines). Over 210,000 people could be exposed to a 100-year coastal flood event by 2070, up from 30,000 people in 2005. The asset that could be damaged due to such event is also estimated to rise from US$35 million (2005) to US$10 billion (2070). Results show that socio-economic changes in terms of rapid population growth, urbanisation, economic growth, and their spatial distribution play a significant role over climate change in the overall increase in exposure. However, the study illustrates that steering development away from low-lying areas that are not (or less) threatened by sea-level rise and extreme climates could be an effective strategic response to reduce the future growth in exposure. Enforcement of such policy where informal settlements dominate urbanisation (as in many developing countries) could undoubtedly be a major issue. It should be recognised that this analysis only provides indicative results. Lack of sufficient and good quality observational local climate data (e.g. long-term sea-level measurements), finer-resolution spatial population and asset distribution and local elevation data, and detailed information about existing coastal defences and current protection levels are identified as limitations of the study. As such, it should be seen as a first step towards analysing these issues and needs to be followed by more detailed, city-based analyses.
|
| [55] |
Assessment of coastal vulnerability to climate change [J].https://doi.org/10.1080/027868299304679 URL [本文引用: 1] 摘要
The UNEP Handbook on Methods for Climate Change Impact Assessment and Adaptation Strategies provides an elaboration of the IPCC Technical Guidelines for Assessing Climate Change Impacts and Adaptations. This paper presents the concepts and ideas that underpin the chapter Coastal Zones of the UNEP Handbook. Particular emphasis is given to the conceptual framework, which is centered around the concept of vulnerability. Further, the IPCC Common Methodology for Assessing Coastal Vulnerability to Sea-Level Rise is evaluated and compared with the Technical Guidelines. One notable difference between the 2 approaches concerns the use of scenarios. In the Common Methodology scenarios are prescribed, while the Technical Guidelines allow users maximum freedom in selecting and developing scenarios. Finally, the paper discusses 3 levels of increasingly complex assessment in coastal zones. As more experience is acquired, coastal databases improve and better analytical tools and techniques are developed, more comprehensive and integrated assessments will become feasible.
|
| [56] |
Probabilistic 21st and 22nd century sea-level projections at a global network of tide-gauge sites [J].https://doi.org/10.1002/2014EF000239 URL [本文引用: 1] 摘要
Abstract Sea-level rise due to both climate change and non-climatic factors threatens coastal settlements, infrastructure, and ecosystems. Projections of mean global sea-level (GSL) rise provide insufficient information to plan adaptive responses; local decisions require local projections that accommodate different risk tolerances and time frames and that can be linked to storm surge projections. Here we present a global set of local sea-level (LSL) projections to inform decisions on timescales ranging from the coming decades through the 22nd century. We provide complete probability distributions, informed by a combination of expert community assessment, expert elicitation, and process modeling. Between the years 2000 and 2100, we project a very likely (90% probability) GSL rise of 0.5–1.265m under representative concentration pathway (RCP) 8.5, 0.4–0.965m under RCP 4.5, and 0.3–0.865m under RCP 2.6. Site-to-site differences in LSL projections are due to varying non-climatic background uplift or subsidence, oceanographic effects, and spatially variable responses of the geoid and the lithosphere to shrinking land ice. The Antarctic ice sheet (AIS) constitutes a growing share of variance in GSL and LSL projections. In the global average and at many locations, it is the dominant source of variance in late 21st century projections, though at some sites oceanographic processes contribute the largest share throughout the century. LSL rise dramatically reshapes flood risk, greatly increasing the expected number of “1-in-10” and “1-in-100” year events.
|
| [57] |
A new method to assess the risk of local and widespread flooding on rivers and coasts [J].https://doi.org/10.1111/j.1753-318X.2010.01081.x URL [本文引用: 1] 摘要
To date, national- and regional-scale flood risk assessments have provided valuable information about the annual expected consequences of flooding, but not the exposure to widespread concurrent flooding that could have damaging consequences for people and the economy. We present a new method for flood risk assessment that accommodates the risk of widespread flooding. It is based on a statistical conditional exceedance model, which is fitted to gauged data and describes the joint probability of extreme river flows or sea levels at multiple locations. The method can be applied together with data from models for flood defence systems and economic damages to calculate a risk profile describing the probability distribution of economic losses or other consequences aggregated over a region. The method has the potential to augment national or regional risk assessments of expected annual damage with new information about the likelihoods, extent and impacts of events that could contribute to the risk.
|
| [58] |
Canada's marine coasts in a changing climate [R]. |
| [59] |
Physically based assessment of hurricane surge threat under climate change [J].https://doi.org/10.1038/nclimate1389 URL [本文引用: 1] 摘要
Storm surges are responsible for much of the damage and loss of life associated with landfalling hurricanes. Understanding how global warming will affect hurricane surges thus holds great interest. As general circulation models (GCMs) cannot simulate hurricane surges directly, we couple a GCM-driven hurricane model with hydrodynamic models to simulate large numbers of synthetic surge events under projected climates and assess surge threat, as an example, for New York City (NYC). Struck by many intense hurricanes in recorded history and prehistory, NYC is highly vulnerable to storm surges. We show that the change of storm climatology will probably increase the surge risk for NYC; results based on two GCMs show the distribution of surge levels shifting to higher values by a magnitude comparable to the projected sea-level rise (SLR). The combined effects of storm climatology change and a 165m SLR may cause the present NYC 100-yr surge flooding to occur every 3–2065yr and the present 500-yr flooding to occur every 25–24065yr by the end of the century.
|
| [60] |
Grey swan tropical cyclones [J].https://doi.org/10.1038/nclimate2777 [本文引用: 1] |
| [61] |
Adaptation technologies for coastal erosion and flooding: A review [J]. |
| [62] |
Human settlement and regional development in the context of climate change: A spatial analysis of low elevation coastal zones in China [J].https://doi.org/10.1007/s11027-013-9506-7 URL [本文引用: 1] 摘要
Low elevation coastal zone (LECZ) in China is densely populated and economically developed, which is exposed to increasing risks of hazards related to climate change and sea level rise. To mitigate risks and achieve sustainable development, we need to better understand LECZ. As the first step, in this paper we define the extent of the LECZ in China, and analyze the spatial distribution of LECZ and its population, using a geographic information system software (ArcGIS) to combine elevation models and population data sets. Our findings show that, overall, this zone covers 2.002% of China’s land area but contains 12.302% of the total population, which is the largest population living in LECZ in the world. There are large regional variations in the distribution of both LECZ and LECZ population, with half of the LECZ within 3002km from the coastline, and Jiangsu Province having the largest LECZ area and population. The LECZ is also concentrated in three major economic zones in China, which accounts for 5402% of LECZ and three quarters of all LECZ population in China. The impact of future climate change on China’s LECZ is exacerbated by rapid economic and population growth, urbanization and environmental degradation. Coordinating development in coastal and inland China, enhancing adaptive capacity and implementing integrated risk management for LECZ are needed to reduce the risks related to climate change and to achieve sustainable development.
|
| [63] |
UK Climate Projections science report: Marine and coastal projections [M]. |
| [64] |
Rethinking China's new great wall [J].https://doi.org/10.1126/science.1257258 URL [本文引用: 1] |
| [65] |
Sea level extremes in southern Europe [J].
[1] Knowledge of sea level extremes is important for coastal planning purposes. Temporal changes in the extremes may indicate changes in the forcing parameters, most probably the storm surges. Sea level extremes and their spatial and temporal variability in southern Europe are explored on the basis of 73 tide gauge records from 1940. This study uses all data available to infer risks at the coast caused by extreme sea levels. Extreme values of 250 cm are observed at the Atlantic coasts with smaller values in the Mediterranean where, with the exception of the Strait of Gibraltar and the Adriatic Sea, the extreme values are less than 60 cm. At the Adriatic Sea values of up to 200 cm are found. When the tidal contribution is removed the differences between the various areas reduce. The spatial distribution of the extremes of the tidal residuals is well represented by the hindcast of a two-dimensional hydrodynamic model forced by the atmospheric pressure and the wind, although the model underestimates the extremes. Higher return levels (200 300 cm for the 50-year return level) are observed in the Atlantic stations due to the larger tides. In the Mediterranean, higher values are found in the northern Adriatic (between 150 and 200 cm) while in the rest of the domain they vary between 20 and 60 cm. The nonlinear interaction between tides and surges is negligible in the Mediterranean, thus the joint tides-surges distribution can be applied. The interannual and decadal variability in time of extremes is caused by mean sea level changes.
|
| [66] |
Spatial and temporal variability and long-term trends in skew surges globally [J]. |
| [67] |
Sea-level rise impact models and environmental conservation: A review of models and their applications [J].https://doi.org/10.1016/j.ocecoaman.2010.06.009 URL [本文引用: 1] 摘要
Conservation managers and policy makers need tools to identify coastal habitats and human communities that are vulnerable to sea-level rise. Coastal impact models can help determine the vulnerability of areas and populations to changes in sea level. Model outputs may be used to guide decisions about the location and design of future protected areas and development, and to prioritize adaptation of existing protected area investments. This paper reviews state-of-the-art coastal impact models that determine sea-level rise vulnerability and provides guidance to help managers and policy makers determine the appropriateness of various models at local, regional, and global scales. There are a variety of models, each with strengths and weaknesses, that are suited for different management objectives. We find important trade-offs exist regarding the cost and capacity needed to run and interpret the models, the range of impacts they cover, and regarding the spatial scale that each operates which may overstate impacts at one end and underestimate impacts at the other. Understanding these differences is critical for managers and policy makers to make informed decisions about which model to use and how to interpret and apply the results.
|
| [68] |
Changes in extreme high water levels based on a quasi-global tide-gauge data set [J].
http://www.agu.org/pubs/crossref/2010/2009JC005997.shtml
|
| [69] |
A global reanalysis of storm surges and extreme sea levels [J].URL PMID: 4931224 [本文引用: 1] 摘要
Extreme sea levels, caused by storm surges and high tides, can have devastating societal impacts. To effectively protect our coasts, global information on coastal flooding is needed. Here we present the first global reanalysis of storm surges and extreme sea levels (GTSR data set) based on hydrodynamic modelling. GTSR covers the entire world's coastline and consists of time series of tides and surges, and estimates of extreme sea levels. Validation shows that there is good agreement between modelled and observed sea levels, and that the performance of GTSR is similar to that of many regional hydrodynamic models. Due to the limited resolution of the meteorological forcing, extremes are slightly underestimated. This particularly affects tropical cyclones, which requires further research. We foresee applications in assessing flood risk and impacts of climate change. As a first application of GTSR, we estimate that 1.3% of the global population is exposed to a 1 in 100-year flood. Protection of coastlines from devastating flooding associated with sea-level extremes is impeded by a lack of continuous records. Here, the authors apply a hydrodynamic modelling approach and present the first reanalysis of tides, surges and extreme sea levels for the entire world's coastline.
|
| [70] |
Coastal flooding and wetland loss in the 21st century: Changes under the SRES climate and socio-economic scenarios [J].https://doi.org/10.1016/j.gloenvcha.2003.10.007 URL [本文引用: 3] 摘要
This paper considers the implications of a range of global-mean sea-level rise and socio-economic scenarios on: (1) changes in flooding by storm surges; and (2) potential losses of coastal wetlands through the 21st century. These scenarios are derived from the Intergovernmental Panel on Climate Change (IPCC) Special Report on Emissions Scenarios (SRES). Four different storylines are analysed: the A1FI, A2, B1 and B2 ‘worlds’. The climate scenarios are derived from the HadCM3 climate model driven by the SRES emission scenarios. The SRES scenarios for global-mean sea-level rise range from 22 cm (B1 world) to 34 cm (A1FI world) by the 2080s, relative to 1990. All other climate factors, including storm characteristics, are assumed to remain constant in the long term. Population and GDP scenarios are downscaled from the SRES regional analyses supplemented with other relevant scenarios for each impact analysis. The flood model predicts that about 10 million people/year experienced coastal flooding due to surges in 1990. The incidence of flooding will change without sea-level rise, but these changes are strongly controlled by assumptions on protection. Assuming that defence standards improve with growth in GDP/capita (lagged by 30 years), flood incidence increases in all four cases to the 2020s due to the growing exposed population. Then to the 2080s, the incidence of flooding declined significantly to 815 million people/ year in the B2 world, 812 million people/year in the B1 world and 811 million people/year in the A1FI world due to improving defence standards. In contrast, flood incidence continues to increase in the A2 world to the 2050s, and in the 2080s it is still 18–30 million people/year. This reflects the greater exposure and more limited adaptive capacity of the A2 world, compared to the other SRES storylines. Sea-level rise increases the flood impacts in all cases although significant impacts are not apparent until the 2080s when the additional people flooded are 7–10 million, 29–50 million, 2–3 million and 16–27 million people/year under the A1FI, A2, B1 and B2 worlds, respectively. Hence, the A2 world also experiences the highest increase in the incidence of flooding. This is true under all the realistic scenario combinations that were considered demonstrating that socio-economic factors can greatly influence vulnerability to sea-level rise. The trends of the results also suggest that flood impacts due to sea-level rise could become much more severe through the 22nd century in all cases, especially in the A1FI world. Note that impacts using a climate model with a higher climate sensitivity would produce larger impacts than HadCM3. Coastal wetlands will be lost due to sea-level rise in all world futures with 5–20% losses by the 2080s in the A1FI world. However, these losses are relatively small compared to the potential for direct and indirect human destruction. Thus, the difference in environmental attitudes between the A1/A2 worlds and the B1/B2 worlds would seem to have more important implications for the future of coastal wetlands, than the magnitude of the sea-level rise scenarios during the 21st Century. These results should be seen as broad analysis of the sensitivity of the coastal system to the HadCM3 SRES global-mean sea-level rise scenarios. While these impact estimates are only for one climate model, for both impact factors they stress the importance of socio-economic conditions and other non-climate factors as a fundamental control on the magnitude of impacts both with and without sea-level rise. The A2 world experiences the largest impacts during the 21st century, while the B1 world has the smallest impacts, with the differences more reflecting socio-economic factors than climate change. This suggests that the role of development pathways in influencing the impacts of climate change needs to be given more attention.
|
| [71] |
Sea-level rise and its impact on coastal zones [J].https://doi.org/10.1126/science.1185782 URL PMID: 20558707 [本文引用: 1] 摘要
Abstract Global sea levels have risen through the 20th century. These rises will almost certainly accelerate through the 21st century and beyond because of global warming, but their magnitude remains uncertain. Key uncertainties include the possible role of the Greenland and West Antarctic ice sheets and the amplitude of regional changes in sea level. In many areas, nonclimatic components of relative sea-level change (mainly subsidence) can also be locally appreciable. Although the impacts of sea-level rise are potentially large, the application and success of adaptation are large uncertainties that require more assessment and consideration.
|
| [72] |
Sea-level scenarios for evaluating coastal impacts [J].https://doi.org/10.1002/wcc.253 URL [本文引用: 2] 摘要
Global-mean sea-level rise will drive impacts and adaptation needs around the world's coasts over the 21st century and beyond. A key element in assessing these issues is the development of scenarios (or plausible futures) of local relative sea-level rise to support impact assessment and adaptation planning. This requires combining a number of different but uncertain components of sea level which can be linked to climatic and non-climatic (i.e., uplift/subsidence of coastal land) factors. A major concern remains about the possibility of significant contributions from the major Greenland and Antarctic ice sheets and this must be factored into the assessments, despite the uncertainty. This paper reviews the different mechanisms which contribute to sea-level change and considers a methodology for combining the available data to create relative (or local) sea-level rise scenarios suitable for impact and adaptation assessments across a range of sophistication of analysis. The methods that are developed are pragmatic and consider the different needs of impact assessment, adaptation planning, and long-term decision making. This includes the requirements of strategic decision makers who rightly focus on low probability but high consequence changes and their consequences. Hence plausible high end sea-level rise scenarios beyond the conventional Intergovernmental Panel on Climate Change (IPCC) range and which take into account evidence beyond that from the current generation of climate models are developed and their application discussed. Continued review and development of sea-level scenarios is recommended, starting with assimilating the insights of the forthcoming IPCC AR5 assessment. WIREs Clim Change 2014, 5:129 150. doi: 10.1002/wcc.253Conflict of interest: The authors have declared no conflicts of interest for this article.For further resources related to this article, please visit the WIREs website.
|
| [73] |
Increasing flood risk and wetland losses due to global sea-level rise: Regional and global analyses [J].https://doi.org/10.1016/S0959-3780(99)00019-9 URL [本文引用: 1] 摘要
To develop improved estimates of (1) flooding due to storm surges, and (2) wetland losses due to accelerated sea-level rise, the work of Hoozemans et al. (1993) is extended to a dynamic analysis. It considers the effects of several simultaneously changing factors, including: (1) global sea-level rise and subsidence; (2) increasing coastal population; and (3) improving standards of flood defence (using GNP/capita as an bility-to-pay parameter). The global sea-level rise scenarios are derived from two General Circulation Model (GCM) experiments of the Hadley Centre: (1) the HadCM2 greenhouse gas only ensemble experiment and (2) the more recent HadCM3 greenhouse gas only experiment. In all cases there is a global rise in sea level of about 38 cm from 1990 to the 2080s. No other climate change is considered. Relative to an evolving reference scenario without sea-level rise, this analysis suggests that the number of people flooded by storm surge in a typical year will be more than five times higher due to sea-level rise by the 2080s. Many of these people will experience annual or more frequent flooding, suggesting that the increase in flood frequency will be more than nuisance level and some response (increased protection, migration, etc.) will be required. In absolute terms, the areas most vulnerable to flooding are the southern Mediterranean, Africa, and most particularly, South and South-east Asia where there is a concentration of low-lying populated deltas. However, the Caribbean, the Indian Ocean islands and the Pacific Ocean small islands may experience the largest relative increase in flood risk. By the 2080s, sea-level rise could cause the loss of up to 22% of the world's coastal wetlands. When combined with other losses due to direct human action, up to 70% of the world's coastal wetlands could be lost by the 2080s, although there is considerable uncertainty. Therefore, sea-level rise would reinforce other adverse trends of wetland loss. The largest losses due to sea-level rise will be around the Mediterranean and Baltic and to a lesser extent on the Atlantic coast of Central and North America and the smaller islands of the Caribbean. Collectively, these results show that a relatively small global rise in sea level could have significant adverse impacts if there is no adaptive response. Given the ommitment to sea-level rise irrespective of any realistic future emissions policy, there is a need to start strategic planning of appropriate responses now. Given that coastal flooding and wetland loss are already important problems, such planning could have immediate benefits
|
| [74] |
Regional issues raised by sea-level rise and their policy implications [J].https://doi.org/10.3354/cr011005 URL [本文引用: 1] 摘要
Global sea levels are rising and this change is expected to accelerate in the coming century due to anthropogenic global warming. Any rise in sea level promotes land loss, increased flooding and salinisation. The impacts of and possible responses to sea-level rise vary at the local and regional scale due to variation in local and regional factors. Policy responses to the human-enhanced greenhouse effect need to address these different dimensions of climate change, including the regional scale. Based on global reviews and analyses of relative vulnerability, 4 contrasting regions are selected and examined in more detail using local and national assessments. These regions are (1) Europe, (2) West Africa, (3) South, South-East and East Asia and (4) the Pacific Small Islands. Some potential impacts of sea-level rise are found to have strong regional dimensions and regional cooperation to foster mitigation approaches (to reduce greenhouse gas emissions and, hence, the magnitude of climate change) and adaptive solutions to climate change impacts would be beneficial. For instance, in South, South-East and East Asia subsiding megacities and questions about long-term deltaic management are common and challenging issues. The debate on mitigation and stabilisation of greenhouse forcing also requires information on regional impacts of different emission pathways. These results will be provided by integrated models, calibrated against national assessments
|
| [75] |
Global sea level rise scenarios for the United States National Climate Assessment [R] . |
| [76] |
Megacities and the coast: Risk, resilience and transformation [M]. |
| [77] |
Rising hazard of storm-surge flooding [J].https://doi.org/10.1073/pnas.1715895114 URL PMID: 29078412 [本文引用: 1] 摘要
Eve Mosher's art project known as HighWaterLine, was aimed at increasing public awareness about climate change in the US. Eve Mosher undertook this project, as she knew that artists could create visceral and emotional connections that could make change possible in ways that data and reports were unable to accomplish. Her art project covered and included the neighborhoods of Chinatown, Coney... [Show full abstract]
|
| [78] |
Introduction to climate change adaptation in New York City: Building a risk management response [J].https://doi.org/10.1111/j.1749-6632.2009.05415.x URL PMID: 20545644 [本文引用: 1] 摘要
No abstract is available for this article.
|
| [79] |
Risk of rising sea level to population and land area [J].https://doi.org/10.1029/2007EO090001 URL [本文引用: 2] 摘要
Low-elevation land areas and their populations are at risk globally from rising sea level. Global sea level has risen by about 2 millimeters per year over the past century. About half of this rise may be attributed to thermal expansion of the ocean and the melting of temperate-latitude glaciers [Dyurgerov and Meier, 1997]. The remainder of the rise is believed to come from a net loss of mass from the Antarctic and Greenland ice sheets, although the exact contribution is unknown.
|
| [80] |
Climate change risk assessment 2017: Projections of future flood risk in the UK [R]. London, UK: Committee on |
| [81] |
Field surveys of recent storm surge disasters [J].https://doi.org/10.1016/j.proeng.2015.08.280 URL [本文引用: 1] 摘要
In these ten years since 2004, there were more than ten big disasters in coastal area including six storm surge events and five tsunami events. The author performed post disaster surveys on all these events as the team leaders of survey teams. Based on those experiences, the author describes lessons of these events. Tsunami is now generally well known to coastal residents. Evacuation plans gradually become common for tsunami disasters. Storm surges arise more frequently due to strong storms but coastal residents are not well protected and not informed how to evacuate in case of surge emergency. From the field surveys conducted, it appeared that the damage depend on the geographical and social conditions of each of the areas that were visited by the author. It is now clear that such issues play important roles in disaster mechanisms. Therefore disaster risk management should carefully include local topography and social conditions of each area during the formulation of disaster prevention plans. In order to establish a reliable disaster prevention system, appropriate protection structures should be constructed, and these should be accompanied by a clear and concise evacuation plan for residents of a given area.
|
| [82] |
Global coastal wetland change under sea-level rise and related stresses: The DIVA wetland change model [J].https://doi.org/10.1016/j.gloplacha.2015.12.018 URL [本文引用: 1] 摘要
61Database identifies estimated (in 2011) 756×103km2global coastal wetland stock.61With 50cm of sea-level rise by 2100, losses of 46–59% of global coastal wetlands61Under high sea-level rise (110cm by 2100), global wetland losses may reach 78%.61Under low sea-level rise, micro-tidal wetlands more vulnerable to loss61Wetland loss likely to be exacerbated by non-climate related, anthropogenic impacts
|
| [83] |
Assessment of vulnerability and adaptation to sea-level rise for the coastal zone of Germany [J].https://doi.org/10.2112/07A-0011.1 [本文引用: 1] 摘要
Germany's coast extends over 3700 km on both the North and Baltic Seas and is shared by five coastal states. Major seaport cities, Hamburg and Bremen, form two of these states, whereas rural areas and small and medium-size coastal towns comprise the other three coastal states. Along the coast large low-lying areas are already threatened by recurring storm flood events and erosion. Accelerated sea-level rise therefore exacerbates a high-risk situation. It is estimated that under a 1-m accelerated sea-level rise scenario the recurrence of devastating storm floods that presently have a probability of 1 in 100 will decrease to a 1 in 10 or even 1 in 1 probability. Vulnerability assessments have been carried out in Germany at three scales: (i) the national level, i.e., for all coastal areas lying below 5 m (Baltic Sea Coast) and 10 m (North Sea Coast), (ii) the regional level for the coastal state of Schleswig-Holstein, and (iii) the local level for selected communities within this state. When comparing findings from these analyses, the results show that the economic risks of flooding and erosion are highest when detailed studies covering the full range of infrastructure assets are used. However, the actual risk areas in detailed studies may be more confined when considering local topography and infrastructure such as road dams. Nationally, an accelerated sea-level rise of 1 m would put more than 300,000 people at risk in the coastal cities and communities, and economic values endangered by flooding and erosion would amount to more than 300 billion US$ (based on 1995 values). This is why German coastal states are following a strategy based on hard coastal protection measures against flooding, although authorities realize that maintaining and/or improving these defence structures might become rather costly in the long-term. Although additional investment in flood and erosion protection will be considerable (estimated at more than 500 million US$) this seems manageable for the national and regional economies. On the other hand, hard coastline defence and accelerated sea-level rise will increase "coastal squeeze" on the seaward side, endangering important coastal ecosystems such as tidal flats (Wadden Sea), saltmarshes, and dunes. Currently there is no strategy to remedy this increasing ecological vulnerability.
|
| [84] |
Categorizing social vulnerability patterns in Chinese coastal cities [J]. |
| [85] |
Sinking deltas due to human activities [J]. |
| [86] |
The federal response to hurricane katrina-lessons learned [R]. |
| [87] |
Terminology on disaster risk reduction [R]. |
| [88] |
Climatic and socioeconomic controls of future coastal flood risk in Europe [J].https://doi.org/10.1038/s41558-018-0260-4 URL [本文引用: 3] |
| [89] |
Evidence for multidecadal variability in US extreme sea level records [J].https://doi.org/10.1002/2014JC010443 URL [本文引用: 1] 摘要
Abstract We analyze a set of 20 tide gauge records covering the contiguous United States (US) coastline and the period from 1929 to 2013 to identify long-term trends and multidecadal variations in extreme sea levels (ESLs) relative to changes in mean sea level (MSL). Different data sampling and analysis techniques are applied to test the robustness of the results against the selected methodology. Significant but small long-term trends in ESLs above/below MSL are found at individual sites along most coastline stretches, but are mostly confined to the southeast coast and the winter season when storm surges are primarily driven by extratropical cyclones. We identify six regions with broadly coherent and considerable multidecadal ESL variations unrelated to MSL changes. Using a quasi-nonstationary extreme value analysis, we show that the latter would have caused variations in design relevant return water levels (50–200 year return periods) ranging from 6510 cm to as much as 110 cm across the six regions. The results raise questions as to the applicability of the “MSL offset method,” assuming that ESL changes are primarily driven by changes in MSL without allowing for distinct long-term trends or low-frequency variations. Identifying the coherent multidecadal ESL variability is crucial in order to understand the physical driving factors. Ultimately, this information must be included into coastal design and adaptation processes.
|
| [90] |
Understanding extreme sea levels for broad-scale coastal impact and adaptation analysis [J].URL PMID: 5504349 [本文引用: 1] 摘要
Abstract One of the main consequences of mean sea level rise (SLR) on human settlements is an increase in flood risk due to an increase in the intensity and frequency of extreme sea levels (ESL). While substantial research efforts are directed towards quantifying projections and uncertainties of future global and regional SLR, corresponding uncertainties in contemporary ESL have not been assessed and projections are limited. Here we quantify, for the first time at global scale, the uncertainties in present-day ESL estimates, which have by default been ignored in broad-scale sea-level rise impact assessments to date. ESL uncertainties exceed those from global SLR projections and, assuming that we meet the Paris agreement goals, the projected SLR itself by the end of the century in many regions. Both uncertainties in SLR projections and ESL estimates need to be understood and combined to fully assess potential impacts and adaptation needs.
|
| [91] |
Increasing risk of compound flooding from storm surge and rainfall for major US cities [J]. |
| [92] |
Evaluation of the combined risk of sea level rise, land subsidence, and storm surges on the coastal areas of Shanghai, China [J].https://doi.org/10.1007/s10584-012-0468-7 URL [本文引用: 1] |
| [93] |
A global framework for future costs and benefits of river-flood protection in urban areas [J].https://doi.org/10.1038/nclimate3350 URL [本文引用: 2] 摘要
Floods cause billions of dollars of damage each year, and flood risks are expected to increase due to socio-economic development, subsidence, and climate change. Implementing additional flood risk management measures can limit losses, protecting people and livelihoods. Whilst several models have been developed to assess global-scale river-flood risk, methods for evaluating flood risk management investments globally are lacking. Here, we present a framework for assessing costs and benefits of structural flood protection measures in urban areas around the world. We demonstrate its use under different assumptions of current and future climate change and socio-economic development. Under these assumptions, investments in dykes may be economically attractive for reducing risk in large parts of the world, but not everywhere. In some regions, economically efficient investments could reduce future flood risk below today's levels, in spite of climate change and economic growth. We also demonstrate the sensitivity of the results to different assumptions and parameters. The framework can be used to identify regions where river-flood protection investments should be prioritized, or where other risk-reducing strategies should be emphasized.
|
| [94] |
Current and future exposure of infrastructure in the United States to Natural Hazards [M]. |
| [95] |
Coastal flooding by tropical cyclones and sea-level rise [J].https://doi.org/10.1038/nature12855 URL PMID: 24305147 [本文引用: 1] 摘要
Abstract The future impacts of climate change on landfalling tropical cyclones are unclear. Regardless of this uncertainty, flooding by tropical cyclones will increase as a result of accelerated sea-level rise. Under similar rates of rapid sea-level rise during the early Holocene epoch most low-lying sedimentary coastlines were generally much less resilient to storm impacts. Society must learn to live with a rapidly evolving shoreline that is increasingly prone to flooding from tropical cyclones. These impacts can be mitigated partly with adaptive strategies, which include careful stewardship of sediments and reductions in human-induced land subsidence.
|
| [96] |
Evidence for systematic changes in extreme high waters since the mid-1970s [J].https://doi.org/10.1175/1520-0442(2004)017<1190:EFSCIE>2.0.CO;2 URL [本文引用: 1] |
| [97] |
Evidence for century-timescale acceleration in mean sea levels and for recent changes in extreme sea levels [J].https://doi.org/10.1007/s10712-011-9112-8 URL [本文引用: 1] 摘要
Two of the most important topics in Sea Level Science are addressed in this paper. One is concerned with the evidence for the apparent acceleration in the rate of global sea level change between the...
|
| [98] |
Shortening the recurrence periods of extreme water levels under future sea-level rise [J].https://doi.org/10.1007/s00477-016-1327-2 URL [本文引用: 2] |
| [99] |
Composite risk assessment of typhoon-induced disaster for China's coastal area [J].https://doi.org/10.1007/s11069-013-0755-2 URL [本文引用: 1] 摘要
Typhoons, as one of the most devastating natural hazards in China's coastal area, have caused considerable personal injury and property damage throughout history. An indicator system which included two aspects of hazard and vulnerability with 14 indicators was built up for composite risk assessment of typhoon-induced disaster. The analytic hierarchy process was used to calculate the weight of each indicator, and the composite risk assessment model was then built up. The results indicated that there were no very high- or very low-risk areas in China's coastal area. Out of the 18,000-km-long China land coastline, 30.99 % was at low risk, mostly along the coastal hill-mountain zone, Hainan and Guangxi coast; the major part (62.71 %) of the coastal area was classified as at moderate risk. Although only 6.30 % of the total was at high risk, the affected area was mainly distributed in Tianjin, Shanghai, and Guangzhou, the three main deltas with low topography, a highly developed economy, and a very dense population.
|
| [100] |
Evaluating the cascading impacts of sea level rise and coastal flooding on emergency response spatial accessibility in Lower Manhattan, New York City [J].https://doi.org/10.1016/j.jhydrol.2017.10.067 URL [本文引用: 1] 摘要
This paper describes a scenario-based approach for evaluating the cascading impacts of sea level rise (SLR) and coastal flooding on emergency responses. The analysis is applied to Lower Manhattan, New York City, considering FEMA 100- and 500-year flood scenarios and New York City Panel on Climate Change (NPCC2) high-end SLR projections for the 2050s and 2080s, using the current situation as the baseline scenario. Service areas for different response timeframes (3-, 5- and 8-minute) and various traffic conditions are simulated for three major emergency responders (i.e. New York Police Department (NYPD), Fire Department, New York (FDNY) and Emergency Medical Service (EMS)) under normal and flood scenarios. The modelling suggests that coastal flooding together with SLR could result in proportionate but non-linear impacts on emergency services at the city scale, and the performance of operational responses is largely determined by the positioning of emergency facilities and the functioning of traffic networks. Overall, emergency service accessibility to the city is primarily determined by traffic flow speed. However, the situation is expected to be further aggravated during coastal flooding, with is set to increase in frequency and magnitude due to SLR.
|
| [101] |
Evaluating the impact and risk of pluvial flash flood on intra-urban road network: A case study in the city center of Shanghai, China [J].https://doi.org/10.1016/j.jhydrol.2016.03.037 URL [本文引用: 1] 摘要
Urban pluvial flood are attracting growing public concern due to rising intense precipitation and increasing consequences. Accurate risk assessment is critical to an efficient urban pluvial flood management, particularly in transportation sector. This paper describes an integrated methodology, which initially makes use of high resolution 2D inundation modeling and flood depth-dependent measure to evaluate the potential impact and risk of pluvial flash flood on road network in the city center of Shanghai, China. Intensity uration requency relationships of Shanghai rainstorm and Chicago Design Storm are combined to generate ensemble rainfall scenarios. A hydrodynamic model (FloodMap-HydroInundation2D) is used to simulate overland flow and flood inundation for each scenario. Furthermore, road impact and risk assessment are respectively conducted by a new proposed algorithm and proxy. Results suggest that the flood response is a function of spatio-temporal distribution of precipitation and local characteristics (i.e. drainage and topography), and pluvial flash flood is found to lead to proportionate but nonlinear impact on intra-urban road inundation risk. The approach tested here would provide more detailed flood information for smart management of urban street network and may be applied to other big cities where road flood risk is evolving in the context of climate change and urbanization.
|
| [102] |
a. Urban fluvial flood modelling using a two-dimensional diffusion-wave treatment, part 1: Mesh resolution effects [J].https://doi.org/10.1002/hyp.5935 URL [本文引用: 1] 摘要
High-resolution data obtained from airborne remote sensing is increasing opportunities for representation of small-scale structural elements (e.g. walls, buildings) in complex floodplain systems using two-dimensional (2D) models of flood inundation. At the same time, 2D inundation models have been developed and shown to provide good predictions of flood inundation extent, with respect to both full solution of the depth-averaged Navier-Stokes equations and simplified diffusion-wave models. However, these models have yet to be applied extensively to urban areas. This paper applies a 2D raster-based diffusion-wave model to determine patterns of fluvial flood inundation in urban areas using high- resolution topographic data and explores the effects of spatial resolution upon estimated inundation extent and flow routing process. Model response shows that even relatively small changes in model resolution have considerable effects on the predicted inundation extent and the timing of flood inundation. Timing sensitivity would be expected, given the relatively poor representation of inertial processes in a diffusion-wave model. Sensitivity to inundation extent is more surprising, but is associated with: (1) the smoothing effect of mesh coarsening upon input topographical data; (2) poorer representation of both cell blockage and surface routing processes as the mesh is coarsened, where the flow routing is especially complex; and (3) the effects of (1) and (2) upon water levels and velocities, which in turn determine which parts of the floodplain the flow can actually travel to. It is shown that the combined effects of wetting and roughness parameters can compensate in part for a coarser mesh resolution. However, the coarser the resolution, the poorer the ability to control the inundation process, as these parameters not only affect the speed, but also the direction of wetting. Thus, high-resolution data will need to be coupled to a more sophisticated representation of the inundation process in order to obtain effective predictions of flood inundation extent. This is explored in a companion paper. Copyright 2005 John Wiley & Sons, Ltd.
|
| [103] |
b. Urban fluvial flood modelling using a two-dimensional diffusion-wave treatment, part 2: Development of a sub-grid-scale treatment [J].https://doi.org/10.1002/hyp.5936 URL [本文引用: 1] 摘要
This paper develops and tests a sub-grid-scale wetting and drying correction for use with two-dimensional diffusion-wave models of urban flood inundation. The method recognizes explicitly that representations of sub-grid-scale topography using roughness parameters will provide an inadequate representation of the effects of structural elements on the floodplain (e.g. buildings, walls), as such elements not only act as momentum sinks, but also have mass blockage effects. The latter may dominate, especially in structurally complex urban areas. The approach developed uses high-resolution topographic data to develop explicit parameterization of sub-grid-scale topographic variability to represent both the volume of a grid cell that can be occupied by the flow and the effect of that variability upon the timing and direction of the lateral fluxes. This approach is found to give significantly better prediction of fluvial flood inundation in urban areas than traditional calibration of sub-grid-scale effects using Manning's n . In particular, it simultaneously reduces the need to use exceptionally high values of n to represent the effects of using a coarser mesh process representation and increases the sensitivity of model predictions to variation in n . Copyright 2005 John Wiley & Sons, Ltd.
|
| [104] |
Modeling dependence between extreme rainfall and storm surge to estimate coastal flooding risk [J].https://doi.org/10.1002/2013WR014616 URL [本文引用: 1] 摘要
for dependence between extreme rainfall and storm surge can be critical for correctly estimating coastal flood risk. Several statistical methods are available for modeling such extremal dependence, but the comparative performance of these methods for quantifying the exceedance probability of rare coastal floods is unknown. This paper compares three classes of statistical methods hreshold-excess, point process, and conditional n terms of their ability to quantify flood risk. The threshold-excess method offers approximately unbiased estimates for dependence parameters, but its application for quantifying flood risk is limited because it is unable to handle situations where only one of the two variables is extreme. In contrast, the point process method (with the logistic and negative logistic models) and the conditional method describe the full distribution of extremes, but they overestimate and underestimate the dependence strength, respectively. We conclude that the point process method is the most suitable approach for modeling dependence between extreme rainfall and storm surge when the dependence is relatively strong, while none of the three methods produces satisfactory results for bivariate extremes with very weak dependence. It is therefore important to take the bias of each method into account when applying them to flood estimation problems. A case study is used to demonstrate the three statistical methods and illustrate the implication of dependence to flood risk.
|
| [105] |
Future climate risk from compound events [J].https://doi.org/10.1038/s41558-018-0156-3 URL [本文引用: 2] 摘要
Crops are vital for human society. Crop yields vary with climate and it is important to understand how climate and crop yields are linked to ensure future food security. Temperature and precipitation are among the key driving factors of crop yield variability. Previous studies have investigated mostly linear relationships between temperature and precipitation, and crop yields variability.... [Show full abstract]
|

/
| 〈 |
|
〉 |
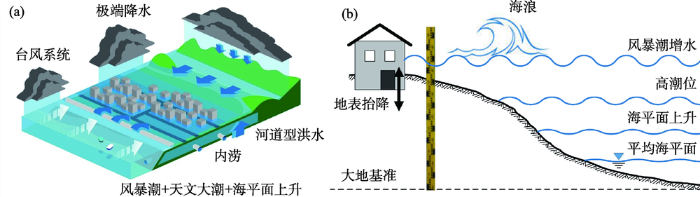