刘洋 , 吕建树
, 吕建树
LIU Yang, LV Jianshu
收稿日期: 2018-10-4
修回日期: 2019-02-2
网络出版日期: 2019-04-28
版权声明: 2019 地理科学进展 《地理科学进展》杂志 版权所有
基金资助:
作者简介:
第一作者简介:刘洋(1986— ),女,山东济南人,副教授,硕士生导师,主要从事生态系统服务与生态补偿研究。E-mail: liuyang0531py@126.com
展开
摘要
陆地生态系统的水体净化服务能过滤地表径流中的污染物,有助于防控流域非点源污染。准确表征该服务的时空变化特征,定量探索其驱动机制则是生态系统服务应用的前提。论文以太湖流域典型地区为例,利用空间分布式的生物物理模型,研究流域陆地水体净化服务的空间格局与时间演变特征,并借助GIS空间统计方法及面板数据模型分析其主导驱动力。结果显示:2000—2010年间研究区59.19%、58.27%的面积分别为氮、磷净化服务的弱降低区。2000—2005年与2005—2010年两个时间段内研究区氮净化服务先下降后略有上升,其中苏州市区增幅最大;磷净化服务为下降趋势,以无锡和苏州市区降幅最大。气候因素和水网密度对水体净化服务具有显著正影响,而负向驱动力则存在差异。为此应采取适当的措施调整主导因素,提高陆地生态系统的水体净化服务,减少氮、磷排放,为流域非点源污染治理及水环境管理提供支撑。
关键词:
Abstract
Water purification services of the terrestrial ecosystem can filter out pollutants in surface runoff, which helps to reduce emissions into the water body. Therefore, improving these services is an effective way to control non-point source pollution in watersheds, and accurately quantifying the spatiotemporal characteristics and driving factors of change of the services is the precondition for such improvement. Purification services for nitrogen and phosphorus are two typical water purification services, which can be quantified by nitrogen and phosphorus exports as the reverse proxy indicators. Taking a representative area of the Taihu Lake Basin in 2000-2010 as a case, we used the nutrient purification model in the Integrated Valuation of Ecosystem Services and Tradeoffs (InVEST) tool to quantify nitrogen and phosphorus indicators of terrestrial ecosystem. The spatial pattern and temporal variation of purification services for nitrogen and phosphorus were characterized by the spatial analysis method in ArcGIS. In order to quantify the driving factors of change of the services, we developed a panel data model based on 31 selected factors and GIS spatial statistics methods. The results show that there were obvious spatial heterogeneities between nitrogen and phosphorus indicators and change over time. Both nitrogen and phosphorus purification services showed a spatial characteristic of widely weak decrease from 2000 to 2010, with the areal ratios of 59.19% and 58.27%, respectively. With regard to the temporal variation of service amount, nitrogen purification service of the study area first reduced then increased slightly during 2000-2005 and 2005-2010, and the increase in Suzhou urban district, Wuxi urban district, and Kunshan City were obvious. Phosphorus purification service was always in decline during 2000-2005 and 2005-2010, and the urban districts of Wuxi and Suzhou experienced the largest reduction. Water purification services are influenced by multiple driving factors in the physical, social, and economic domains. Climatic factors and water network density had significant positive influences on these two services, while the negative driving factors differed. Arable land proportion, village density, and agricultural population density had major negative effects on nitrogen purification service; while urban land density mainly impacted negatively on phosphorus purification service. Therefore, appropriate measures should be implemented to improve these two water purification services according to the driving factor analysis. Climate change adaptation policy can contribute to synergistically manage nitrogen and phosphorus purification services. Meanwhile, different control measures should be taken because of the varied driving factors between nitrogen and phosphorus purification services. Improving production and living conditions in rural areas and guiding individual behaviors of farmers can help to reduce the impact of agricultural activities on nitrogen purification service. Adjusting production and daily living activities in urban areas can reduce phosphorus emissions and enhance the phosphorus purification service of the terrestrial ecosystem. This study can provide support for non-point source pollution control and water management in watersheds.
Keywords:
生态系统服务作为联系自然生态系统与人类福祉的重要纽带,已成为人类可持续发展面临的重要议题之一。流域是自然过程和人类活动相互作用强烈的复合生态系统,产生多种生态系统服务。其中,陆地生态系统的水体净化服务可减少地表径流中的氮、磷营养盐,调节区域非点源污染,有助于流域水环境健康和可持续发展。目前有关流域陆地生态系统的水体净化服务研究主要集中于对该服务的评价、制图及价值化(Andrew et al, 2015; Chen et al, 2018; La Notte et al, 2018),与其他服务的关系识别(Hu et al, 2018; Xiao et al, 2018; 赵文武等, 2018),管理实践应用(Guswa et al, 2014; Wong et al, 2015; Grizzetti et al, 2016),不同管理方式下该服务物理量及价值量变化(Ouyang et al, 2016; Pennington et al, 2017; Qi et al, 2019)以及驱动力分析(Kirsten et al, 2018; Nazmul et al, 2019)等。
尽管已有研究取得了一定成果,但由于水文循环和水陆交互作用的复杂性(Grizzetti et al, 2016),导致水体净化服务的时空评价存在不足,如替代指标选取的差异性、量化方法的多样性及研究数据的精准度等对量化结果的影响(Guswa et al, 2014),尤其是空间异质性显著的地区尺度上。在驱动力分析方面,已有研究多集中于对土地利用、城市化、气候变化等单一驱动力分析(Gao et al, 2017; 陈晓红等, 2018; Jorda-Capdevila et al, 2019),较少考虑多因素的综合作用机制和主导驱动力识别,从而阻碍了水体净化服务在管理实践中的应用。
中国流域普遍面临水质退化、水资源短缺、土壤侵蚀等问题,而以氮、磷为主的非点源污染则是多数流域治理的重点和难点(Zhou et al, 2017)。为此,本文结合中国流域的现实问题,采用空间精细化的生物物理模型、经验统计模型等多种方法,在区域尺度上对流域陆地生态系统的水体净化服务进行精确的时空演变研究,并在驱动因子空间栅格化的基础上,定量分析主导影响因素及驱动机制,为区域水环境管理政策的制定提供科学参考和技术支撑。
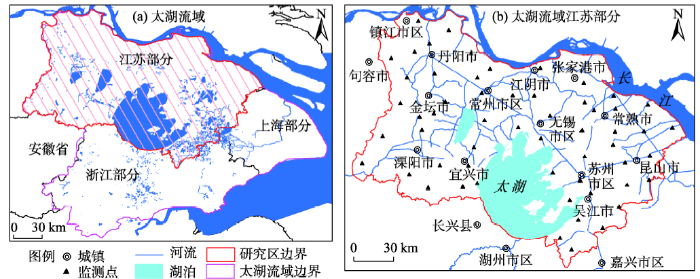
研究区为太湖流域的典型地区,位于长江三角洲的核心区域——太湖流域的江苏省,包括苏州市、无锡市、常州市、镇江市及南京市的部分区域(图1)。同时,该区域又属于太湖流域水利分区中的湖西区、武澄锡虞区、阳澄淀泖区及太湖区,是独立的水利分区,便于数据收集及生态环境模拟。研究区是中国经济最发达、城市化水平最高的地区之一;气候温暖湿润,也是中国重要的粮食产区;土地利用/覆被类型以耕地为主,其次为水体和城镇用地(图2)。目前,该区面临的主要水环境问题是水质退化,尤其是农业非点源污染已成为流域首要水环境问题(Reidsma et al, 2012; Liu et al, 2013)。因此,研究该区生态系统的水体净化服务对区域水环境管理具有重要意义。
研究数据为2000、2005及2010年的气象、土壤、土地及社会经济等数据。其中,气象数据来源于中国气象数据共享平台(http://data.cma.cn),包括研究区及其周边200 km范围内40个气象站点的降雨量、气温及太阳辐射等,并采用普通克里格法进行插值。DEM数据(30 m×30 m)来源于地理空间数据云平台(http://www.gscloud.cn),利用ArcGIS中水文分析模块进行处理。用于计算植被覆盖度(NDVI)的TM遥感影像同样来源于地理空间数据云平台,并借助ENVI软件进行计算。土地利用、道路及河流矢量数据来源于地球系统科学数据共享平台(http://www.geodata.cn);而土壤理化数据、最大深度及植被有效含水量等数据(100 m×100 m)的来源于中国科学院南京土壤研究所(Shi et al, 2010)。人口和GDP的栅格数据来源于中国科学院地理科学与资源研究所(闫庆武等, 2005),并结合研究区各乡镇的统计数据进行修正。农业及其他相关社会经济统计数据来源于研究区各县(市、区)统计年鉴①(①包括江阴、宜兴、武进、溧阳、金坛、常熟、张家港、昆山、吴江、太仓、丹徒、丹阳、句容、溧水、高淳,以及无锡市区、常州市区、苏州市区、镇江市区2001、2006及2011年的统计年鉴。为避免行政区变化的影响,将各县(市、区)边界统一到2010年的行政边界,对应的乡镇数据也进行了调整。)。此外,用于模型计算的水文、水质数据来源于溧阳、宜兴、吴江等县(市、区)的水文局和环境监测站点(图1)。为便于后续计算分析,通过投影变化、栅格化及重采样等操作将所有空间数据统一到30 m的分辨率。
流域陆地生态系统通过植被、土壤等生态要素吸收径流中的营养盐,以减少随着径流排放到河流、湖泊等水域中的污染物,达到净化水质的目的。因此可利用陆地生态单元的氮输出量(Nitrogen Export, NE)与磷输出量(Phosphorus Export, PE)2个反向指标表征流域生态系统的氮、磷营养盐净化服务,其输出量值越低表示相应的水体净化服务越高,反之亦然。
常用计算模型主要有InVEST (Integrated Valuation of Ecosystem Services and Tradeoffs)、ARIES (Artificial Intelligence for Ecosystem Services)、LUCI (Land Utilisation and Capability Indicator)、SWAT(Soil and Water Assessment Tool)及VIC(Variable Infiltration Capacity)等。其中,InVEST模型具有界面友好、数据较易获取、输出结果可视化及便于情景分析等优势(白杨等, 2013)。该模型中的营养盐净化模块通过地表径流模拟,结合不同地类的氮、磷营养盐输出系数与滤除系数,计算研究区氮、磷输出量。本文中各地类的氮、磷输出系数与滤除系数主要参考前人研究(段亮等, 2006; 李恒鹏等, 2007; 闫丽珍等, 2010),并结合专家咨询意见及InVEST指导手册最终确定,如表1所示。模型原理如下所示:
表1 研究区InVEST模型参数值
Tab.1 Parameter values of the InVEST model in the study area
| 地类 | 编码 | 根系长度/mm | 蒸散系数 | 氮输出系数/(kg/hm2) | 氮滤除率/% | 磷输出系数/(kg/hm2) | 磷滤除率/% |
|---|---|---|---|---|---|---|---|
| 水田 | 1 | 700 | 0.85 | 19.40 | 30 | 1.22 | 30 |
| 旱地 | 2 | 800 | 0.60 | 14.70 | 40 | 0.59 | 40 |
| 有林地 | 3 | 7000 | 1.00 | 2.12 | 80 | 0.15 | 80 |
| 灌木林 | 4 | 6000 | 1.00 | 2.12 | 70 | 0.15 | 70 |
| 疏林地 | 5 | 5500 | 0.90 | 3.12 | 60 | 0.18 | 60 |
| 其他林地 | 6 | 3000 | 0.85 | 2.62 | 50 | 0.16 | 50 |
| 草地 | 7 | 2000 | 0.65 | 3.20 | 48 | 0.20 | 40 |
| 河渠 | 8 | 800 | 0.95 | 0.001 | 5 | 0.001 | 5 |
| 湖泊 | 9 | 1000 | 1.00 | 0.001 | 5 | 0.001 | 5 |
| 水库坑塘 | 10 | 1000 | 1.00 | 0.001 | 5 | 0.001 | 5 |
| 湿地 | 11 | 6000 | 0.95 | 2.00 | 80 | 0.05 | 80 |
| 城镇用地 | 12 | 1 | 0.65 | 12.00 | 5 | 2.10 | 5 |
| 农村居民点 | 13 | 1 | 0.30 | 20.00 | 10 | 2.50 | 5 |
| 其他建设用地 | 14 | 1 | 0.20 | 6.00 | 0.01 | 1.50 | 0.01 |
| 未利用地 | 15 | 1 | 0.22 | 1.45 | 5 | 0.045 | 5 |
式中:
式中:
在自然-社会-经济复合系统中,生态系统服务驱动力错综复杂,通过咨询相关领域专家,考虑研究数据的可得性,选取与生态系统服务供给密切相关的43个驱动因子进行分析。为消除驱动因子量纲及空间尺度来源的影响,运用最值标准化方法,结合镇级行政区的面积比,对数据进行了标准化处理。在建立驱动力数据集的基础上,检验驱动力变量之间的多重共线性,以避免驱动力分析模型的参数估计误差。首先利用斯皮尔曼相关分析法计算驱动力变量之间的相关性;然后对相关性超过0.8的2个变量保留其一(Jose-Manuel et al, 2011),去除InVEST模型中已含的参数变量,确保驱动力分析结果的准确性。例如,年均降雨量与年均相对湿度的相关性超过0.8,由于InVEST模型的输入参数中包括降雨量,因此将其删除,而保留年均相对湿度。最终,12个驱动因子被排除,保留31个驱动因子用于后续模型分析,并将其分为10个大类,如表2所示。
表2 水体净化服务的驱动力
Tab.2 Driving factors of water purification services
| 驱动力类别 | 驱动力简称 | 驱动力指标 | 单位 |
|---|---|---|---|
| 气候因素 | SUN | 日照百分率 | % |
| ARH | 年均相对湿度 | % | |
| TEM | 年均气温 | ℃ | |
| 地形因素 | ALT | 高程 | m |
| SLOP | 坡度 | ° | |
| 水文因素 | WATER | 水网密度 | hm2/km2 |
| 土壤因素 | TN | 土壤表层(0~20 cm)的总氮含量 | mg/m3 |
| TP | 土壤表层(0~20 cm)的总磷含量 | mg/m3 | |
| TK | 土壤表层(0~20 cm)的总钾含量 | mg/m3 | |
| SOM | 土壤表层(0~20 cm)的有机质含量 | mg/m3 | |
| BULK | 土壤容重 | g/cm3 | |
| SAND | 土壤表层(0~20 cm)的砂粒(0.05~2.0 mm)含量百分比 | % | |
| SILT | 土壤表层(0~20 cm)的粉砂(0.002~0.05 mm)含量百分比 | % | |
| CLAY | 土壤表层(0~20 cm)的粘粒(<0.002 mm)含量百分比 | % | |
| 植被覆盖度 | NDVI | 植被覆盖指数 | [-1, 1] |
| 人口经济情况 | POP | 人口密度 | 人/km2 |
| GDP | 单位面积国内生产总值 | 万元/km2 | |
| 建设用地密度 | URBDENS | 城镇建设用地密度 | hm2/km2 |
| VILLDENS | 农村居民点密度 | hm2/km2 | |
| ROADENS | 道路密度 | km/km2 | |
| 农业发达程度 | AGRIPOP | 农业人口密度 | 人/km2 |
| AGRIGDP | 单位面积农业生产总值 | 万元/km2 | |
| AGRPOWER | 农业机械总动力 | kW/hm2 | |
| FARINCM | 农民年收入 | 元/人 | |
| 植被用地状况 | ARABLE | 单位面积耕地比例 | % |
| FOREST | 单位面积林地比例 | % | |
| GRASS | 单位面积草地比例 | % | |
| WETLAND | 单位面积湿地比例 | % | |
| 区位可达性 | DISWAT | 离水体的距离 | m |
| DISURB | 离城镇的距离 | m | |
| DISVILL | 离农村的距离 | m |
运用ArcGIS软件生成研究区的10000个随机点,将水体净化服务和驱动力的栅格值赋予这些点,形成水体净化服务为因变量、驱动因素为自变量的数据集。由于该数据是综合了横截面和时间序列的随机点数据,可以采用面板回归的混合效应模型进行驱动力分析。为减少异方差的影响,使结果具有可比性,本文对所有变量进行对数化处理,并在回归过程中进行稳健性检验。面板回归分析均在Stata 13.1平台实现。
参考Hou等(2016)和Yan等(2018)的研究,通过与前人研究数据进行对比以验证模拟结果。已有研究数据涉及不同空间尺度,分别为无锡市(夏敏等, 2013)、昆山市(王小治等, 2009)、大浦镇(王宁等, 2008)以及常州东南部环太湖3个村庄(Huang et al, 2013)的氮、磷非点源负荷。Sharps 等(2017)与Redhead 等(2017)的研究表明,氮磷输出系数、滤除率、水文输入值等参数是InVEST模型的敏感因子。因此根据验证结果,在合理的范围内不断调试这些参数,直到偏差控制在20%之内。
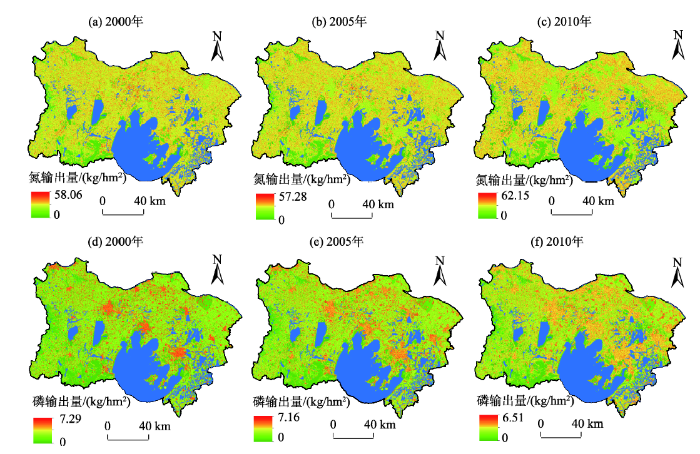
此外,通过将氮、磷净化服务的空间布局(图3)与研究区土地利用/覆被状况(图2)进行对比,以进一步验证模型结果的准确性。结果表明,氮、磷净化服务的高值区均分布在林地、草地等生态用地,而低值区则存在明显差异,分别位于耕地、农村居民点及城镇用地。由于化肥施用、畜禽养殖等农业活动的影响,使得氮、磷负荷的空间分布与耕地、农村居民点等农业用地紧密相关(吴攀等, 2015)。同时,农村生活污染和城镇污水导致磷富集,进而影响农村居民点和城镇用地的磷净化服务,从而使磷输出量在这些地区分布明显(Salvia-Castellvi et al, 2005; Mekonnen et al, 2018)。
图3 2000—2010年水体净化服务指标的空间分布
Fig.3 Spatial distribution of water purification service indicators, 2000-2010
2000—2010年研究区各期水体净化服务指标的空间分布格局如图3所示。其中,绿色、红色、黄色分别表示服务供给的高值区、低值区及中值区。总体来看,氮净化服务的高值区(氮输出量的低值区)主要分布在研究区周边、南部及湖体周围的林地、湿地等生态用地,低值区(氮输出量的高值区)在中部和北部的耕地、农村居民点等地区较为突出,而中值区分布广泛。通过对比研究区土地利用/覆被状况(图2)可知,磷净化服务的高值区(磷输出量的低值区)主要分布在研究区周边的林地、草地、湿地等生态用地,低值区(磷输出量的高值区)则零散分布于建设用地区域,中值区分布广泛且呈逐年增加趋势。
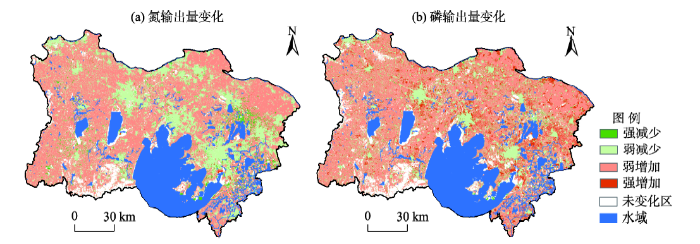
由图3可知,2000—2010年间研究区水体净化服务的空间分布发生了较为显著的变化,且变化强度具有较为显著的空间异质性。在ArcGIS中将2010年和2000年每种服务指标的栅格数据相减,得到其空间变化格局,再根据相应的变化程度,将其划分为5个等级,如图4所示。
图4 水体净化服务指标的空间变化格局
Fig.4 Spatial variation pattern of water purification service indicators
结果表明,氮输出量变化等级中,强减少区(<-11.01 kg/hm2)碎片化分布,仅在研究区东部集中,占统计面积的4.02%;弱减少区(-11.00~0 kg/hm2)主要位于区域建设用地及其附近,占25.05%;弱增加区(0~11.00 kg/hm2)广泛分布于整个研究区,占59.19%;强增加区(>11.01 kg/hm2)零星分布于区域东部,仅占1.19%。磷输出量变化等级中,强减少区(<-1.11 kg/hm2)零星分布,占统计面积的2.29%;弱减少区(-1.10~0 kg/hm2)与研究区原有城镇建设用地分布相近,占17.14%;弱增加区(0~1.10 kg/hm2)分布范围最广,占58.27%;强增加区(>1.11 kg/hm2)分布于研究区建设用地的外围扩展区,占10.23%。总之,研究区氮、磷输出量的弱增加区面积均最大,表明区域水体净化服务普遍存在弱降低的趋势。
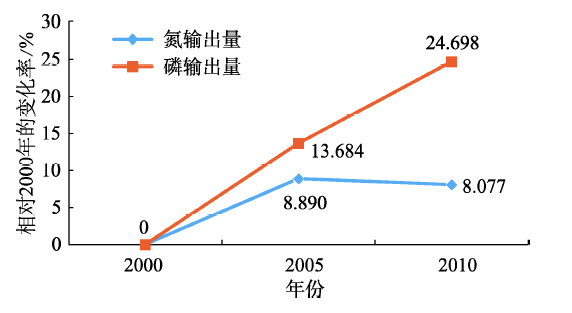
借助ArcGIS的统计分析模块得到研究区各时期的氮、磷输出总量,并以此计算各期相对基期(2000年)的变化率,从而分析区域水体净化服务的整体变化趋势(图5)。可见,磷输出量一直在增加,而氮输出量在2005年后开始下降,表明2种水体净化服务总体变化不同,磷净化服务处于下降趋势,而氮净化服务的降低程度有所缓解。
图5 研究区水体净化服务指标总量变化趋势
Fig.5 Trend of change of the total value of water purification service indicators in the study area
基于2010年县级行政分区的矢量数据,利用GIS统计分析模块得到2000—2005、2005—2010年2个时间段各区服务指标的变化量,如图6所示。其中2000—2005年间各区的氮输出量均增加,且宜兴、溧阳、丹阳的增加量最大,表明氮净化服务的降低程度最大;溧水、高淳、句容及镇江市的市辖区由于所占面积较小,其增加程度也最小;2005—2010年间,无锡市区、江阴、常州市区、苏州市区、常熟、昆山、吴江及镇江市区的氮输出量则呈现减少趋势,以苏州市区减少程度最大,表明氮净化服务增加程度最大。2个时间段各地区的磷输出量均增加,其中无锡市区和苏州市区增幅最大,表明磷净化服务的降低程度最大;其次是常熟、宜兴、昆山、吴江;而溧水、高淳、句容增加程度则最小。
图6 研究区各县级行政区的氮、磷输出量变化
注:编号1~19依次代表南京市的溧水、高淳,无锡市的市辖区、江阴、宜兴,常州市的市辖区、武进、溧阳、金坛,苏州市的市辖区、常熟、张家港、昆山、吴江、太仓,镇江市的市辖区、丹徒、丹阳、句容。
Fig.6 Nitrogen and phosphorus export variation in counties and districts of the study area
2种水体净化服务的驱动力分析结果如表3所示。其中,氮驱动力回归模型拟合的R2为0.819,F值在0.01的水平上显著,说明模型拟合较理想。自变量t值多在1%的水平上显著,说明多数驱动力对氮输出量的解释力较强。从回归系数来看,气候因素对氮输出量的作用程度最大,尤其是相对湿度,其系数值达到-7.022;水网密度也是促进生态系统水体净化功能的重要因素,回归系数为-6.382;促进氮输出量增加的主要因素是农村居民点和耕地比例,回归系数分别为2.198和1.324;其他农业因子对氮输出量的影响也为正,但仅有农业人口密度通过了0.05水平的显著性检验。该回归结果说明:区域农业活动对生态系统的氮净化服务具有负面影响,尤其是农村住宅用地扩展、农耕活动增加及农业人口密度增大。土壤因素对氮输出量的影响均较为显著,其中土壤总氮含量、有机质含量及砂粒含量的回归系数为正,表明这些因素对生态系统的氮输出量增加有促进作用;植被覆盖度和林地比例对氮输出量的影响为负,表明提高地区生态植被用地可以有效地促进氮净化服务,减少区域氮输出量。此外,氮输出量还受到区位因素的显著影响,其中离水体、城镇距离的回归系数为正,而离农村距离的回归系数为负,表明离农村越近,氮输出量越大,这进一步验证了农村居民点对氮净化服务的负作用。
表3 研究区水体净化服务指标变化的驱动力回归结果
Tab.3 Regression analysis results of driving factors of water purification services variation in the study area
| 驱动力类型 | 驱动力 | 氮输出量变化的回归结果 | 磷输出量变化的回归结果 | |||||
|---|---|---|---|---|---|---|---|---|
| 回归系数 | 标准差 | t值 | 回归系数 | 标准差 | t值 | |||
| 气候因子 | 日照百分率 | -3.935*** | 0.513 | -7.660 | -2.258*** | 0.419 | -5.390 | |
| 相对湿度 | -7.022*** | 0.531 | -13.220 | -6.017*** | 0.435 | -13.840 | ||
| 年均气温 | -4.313*** | 0.840 | -5.130 | -2.365*** | 0.687 | -3.440 | ||
| 地形因子 | 高程 | -0.582*** | 0.025 | -22.970 | -0.537*** | 0.021 | -25.930 | |
| 坡度 | 0.003 | 0.004 | 0.760 | 0.000 | 0.005 | -0.060 | ||
| 水文因子 | 水网密度 | -6.382*** | 0.476 | -13.420 | -4.144*** | 0.480 | -8.630 | |
| 土壤因子 | 土壤表层总氮含量 | 0.149*** | 0.028 | 5.410 | 0.123*** | 0.023 | 5.410 | |
| 土壤表层总磷含量 | -0.202*** | 0.029 | -7.050 | 0.164*** | 0.023 | 7.010 | ||
| 土壤表层总钾含量 | -0.205*** | 0.043 | -4.740 | -0.153*** | 0.036 | -4.300 | ||
| 土壤表层有机质含量 | 0.148*** | 0.038 | 3.890 | 0.193*** | 0.053 | 3.650 | ||
| 土壤容重 | -0.320* | 0.185 | 1.730 | 0.131 | 0.084 | 1.570 | ||
| 土壤表层砂粒含量比 | 0.217*** | 0.072 | -3.020 | 0.163*** | 0.059 | -2.750 | ||
| 土壤表层粉砂含量比 | -0.360*** | 0.052 | 6.910 | -0.253*** | 0.043 | 5.910 | ||
| 土壤表层粘粒含量比 | -0.097** | 0.043 | -2.230 | -0.128*** | 0.036 | -3.510 | ||
| 植被因子 | 植被覆盖指数 | -0.281** | 0.126 | -2.220 | -0.012** | 0.006 | -2.080 | |
| 人口经济因子 | 单位面积GDP | 0.009 | 0.010 | 0.860 | 0.004 | 0.009 | 0.430 | |
| 人口密度 | 0.001 | 0.005 | 0.140 | 0.002 | 0.002 | 1.220 | ||
| 建设用地密度 | 城镇用地密度 | -3.008 | 1.936 | -1.550 | 3.444** | 1.584 | 2.170 | |
| 农村居民点密度 | 2.198*** | 0.514 | 4.270 | 2.242*** | 0.526 | 4.260 | ||
| 道路密度 | -0.005 | 0.004 | -1.270 | -0.006** | 0.003 | -2.030 | ||
| 农业发展因子 | 农业人口密度 | 0.194** | 0.101 | 2.930 | 0.162** | 0.082 | -1.970 | |
| 农业GDP | 0.050 | 0.061 | 0.820 | 0.031 | 0.045 | 0.690 | ||
| 农业机械总动力 | 0.022 | 0.044 | 0.500 | 0.022 | 0.036 | 0.610 | ||
| 农民年收入 | 0.041 | 0.069 | 0.590 | 0.016 | 0.055 | 0.280 | ||
| 植被用地因子 | 耕地比例 | 1.324*** | 0.212 | 6.240 | 1.159*** | 0.353 | 3.280 | |
| 林地比例 | -0.375*** | 0.065 | 2.890 | -0.123** | 0.217 | -2.030 | ||
| 草地比例 | -2.343 | 1.499 | -1.560 | -1.972 | 1.221 | -1.610 | ||
| 湿地比例 | -0.411 | 0.428 | -0.960 | -0.831** | 0.467 | -2.100 | ||
| 区位可达性因子 | 离水体的距离 | 0.459*** | 0.006 | 77.680 | 0.081*** | 0.019 | 4.350 | |
| 离城镇的距离 | 0.016*** | 0.004 | 4.160 | -0.039*** | 0.003 | -12.140 | ||
| 离农村的距离 | -0.025*** | 0.003 | -7.830 | -0.065*** | 0.003 | -23.850 | ||
| 常量 | 4.402 | 11.333 | 0.390 | -3.238 | 9.212 | -0.350 | ||
磷驱动力回归模型拟合的R2为0.792,其F值在0.01的水平上显著,多数自变量的t值也在1%的水平上显著。从回归系数来看,对磷输出量作用程度最大的驱动力也是气候因素中的相对湿度因子,其系数值为-6.017,表明相对湿度每增加1%,区域磷输出量将减少6.017%;水网密度也是重要的负向因素,其回归系数表明水网密度每增加1个百分点,磷输出量会减少4.144%;城镇建设用地密度、农村居民点及耕地比例对磷输出量增加有显著的促进作用,回归系数分别为3.444、2.242和1.159;土壤因素中,总钾含量、粉砂含量和粘粒含量的回归系数为负,表明这些因素对磷输出量具有消极作用,其含量的增加将提高生态系统净化磷的服务功能;与氮输出量相似的是,植被覆盖度、林地和湿地比例对磷输出量的影响也为负,进一步表明提高地区生态植被用地,尤其是林地和湿地,可对生态系统磷净化服务有促进作用。此外,磷输出量也受到区位因素的影响,其中离水体的回归系数为正,表明离水体越近,磷输出量越低;而离城镇和农村距离的回归系数为负,表明离其越近,磷输出量越高,生态系统的磷净化服务越低,这也间接说明研究区城镇和农村居民生活均对生态系统功能产生压力,降低了生态系统的磷净化服务。
生态系统服务的时空变化表征有助于识别其数量、位置及热点区,为生态环境保护、土地利用规划提供定量、直观及动态的决策信息。本文以太湖流域江苏省为案例区,利用生物物理模型和GIS空间分析方法表征了流域陆地生态系统的水体净化服务。结果显示,氮、磷净化服务具有较明显的空间异质性和总体下降的时间变化性,其中磷净化服务的下降趋势更显著,表明区域存在潜在的生态风险。Xu等(2016)的研究发现,1985—2010年间太湖流域水体净化服务以20.9%的中度退化为主,增加了流域生态风险程度。Li等(2016)采用生态系统服务供给率与供需比2个指标进行研究,结果也表明2000—2010年太湖流域的生态系统服务显著降低。Chen等(2018)的研究结果则表明2000—2010年间太湖流域的氮、磷净化服务轻微下降,且氮、磷服务分布高值区主要为流域周边的生态功能区,与本文的模拟结果具有一定的相似性。总之,这些研究从不同视角,运用多种方法对流域层面的水体净化服务进行模拟,其结果也间接验证了本文服务表征的准确性。
模型选择是水体净化服务表征的基础。在生态系统服务量化模型中,InVEST和ARIES模型主要运用年份数据量化水体净化服务,而SWAT等水文模型则需逐日的水文数据以模拟水质的变化过程;VIC模型仅适合大尺度研究区,难以进行站点层面的评价,而InVEST模型多用于国家和区域尺度研究,在局地尺度则需要更精准的数据校正。总之,应基于研究问题分析,根据模型尺度特征和研究数据类型确定表征模型。也有研究(Keeler et al, 2013; Sharps et al, 2017)认为,尽管模型所需数据、输出形式存在差异,但模拟结果却存在一定的相似性。本文重在分析流域水体净化服务在不同年份的空间格局及其变化情况,因此选择区域尺度上广泛应用的InVEST模型进行服务表征。此外,考虑到研究数据的可得性和多期结果的可对比性,本文仅以精确度较高的2000—2010年数据为例进行模拟,未来应在获取相同精度新数据的基础上,尝试更长时间序列的研究。
由于实际监测数据普遍难以获取,使得生态系统服务模型验证相对困难(Hou et al, 2016)。Seppelt等(2011)对153篇相关文献进行综述,发现仅有18%的研究尝试全面验证模型,不到1/3的研究进行了不确定性评价。Ochoa等(2017)的研究也发现,在65篇公开发表的文章中仅有12.9%的研究利用统计软件进行模型验证,26篇采用地图资料对比、专家咨询等其他方法进行验证。考虑到研究区范围及数据获取情况,本文通过对比不同空间尺度上的前人研究数据进行模型验证。未来可结合实地监测数据,在排除点源污染的基础上,对比模拟数据,进一步校验模型。此外,该模型也存在一些不足,不能分析季节性及更短时间尺度上的服务特征,仅考虑了植被及土壤对污染物的过滤作用,而忽略了生态系统中污染物被吸收、降解的化学或生物效应(Sun et al, 2018),导致水体净化服务可能被低估(Sharps et al, 2017)。因此,未来可进行该模型的扩展研究,根据研究区实际情况对模型结构进行改进,并尝试整合验证模块,有效结合专家知识,以提高模拟的精准度,拓展模型的适用范围。
水体净化服务的研究结果可用于流域水环境管理及相关政策制定。通过本文的研究可明确多种水体净化服务的变化程度,对下降明显的服务采取更加严格的污染物减排措施,减少人类活动对该类生态系统净化功能的影响。从空间分布来看,水体净化服务的高值区和低值区是流域及行政区层面管控的热点地区,应进一步加强对高值区的保护,促进服务的持续供给,同时重点监控低值区的氮、磷排放情况。此外,服务显著下降区也是非点源污染治理的关键区(Yan et al, 2018),应结合氮磷拦截技术、生态系统修复工程、环境保护奖罚制度等措施进行管控。
生态系统服务的驱动力分析一直是研究难点,本文在驱动因子空间栅格化的基础上,借助面板回归方法定量分析了水体净化服务变化的主导驱动力,以期为区域非点源污染治理及生态系统管理等相关政策的制定提供技术与信息支撑。驱动力研究结果表明,通过采取气候适应性的政策措施可协同管理氮、磷净化服务,但由于驱动力存在一定的差异性,也应采取不同的管控措施。对于氮净化服务,农村居住地、农耕活动及农业人口密度是重要驱动力,因此通过完善农村生产生活条件,引导农户个体行为,以降低农业活动对生态系统的影响,例如合理规划农村宅基地建设、建立配套的污水处理设施,以及有效施肥、耕作等田间管理措施等。对于磷净化服务,城镇建设用地和农村居民点的影响相对显著,通过调整相关建设用地上的生产生活行为可在较大程度缓解人类对区域生态系统的压力,从而减少区域磷排放。
The authors have declared that no competing interests exist.
| [1] |
白洋淀流域生态系统服务评估及其调控 [J].https://doi.org/10.5846/stxb201203270417 URL Magsci [本文引用: 1] 摘要
政策制定者在制定土地利用相关政策时需要权衡各方面的利益关系,协调资源保护和经济发展之间的关系。由于缺乏有效的评价与权衡办法,目前对这方面研究还较少。采用InVEST模型,评价了白洋淀流域7种服务功能指标,分析了其空间分布特征。通过情景(政策情景与保护情景)分析,较好的反映了农业直接经济收入与服务功能之间的关系。结果表明:生物多样性、水源涵养、土壤保持和固碳重要区域主要分布在流域西部、北部和流域中部山区;水质保护和授粉重要区域主要分布于流域东部、南部和中部平原区。政策情景下,产水量第二,农业产出有所下降,固碳能力较保护模式差,N/P输出最少。保护情景下产水量最大,农田产出价值不变,氮磷保持与政策情景差不多,但固碳效果最好。通过权衡不同情景下服务功能得失,筛选既不损害流域居民实际经济收入,又能使得水文服务功能得到提高的管理模式。研究表明InVEST模型可以很好的用于对自然资本评估和空间化特征分析,通过建立不同情景,评价结果可以用于权衡不同管理策略下服务功能得失,是一种评价和预测自然资本变化的有效方法,对政策制定和策略筛选具有重要的指导意义。
Ecosystem services valuation and its regulation in Baiyangdian Basin: Based on InVEST model .https://doi.org/10.5846/stxb201203270417 URL Magsci [本文引用: 1] 摘要
政策制定者在制定土地利用相关政策时需要权衡各方面的利益关系,协调资源保护和经济发展之间的关系。由于缺乏有效的评价与权衡办法,目前对这方面研究还较少。采用InVEST模型,评价了白洋淀流域7种服务功能指标,分析了其空间分布特征。通过情景(政策情景与保护情景)分析,较好的反映了农业直接经济收入与服务功能之间的关系。结果表明:生物多样性、水源涵养、土壤保持和固碳重要区域主要分布在流域西部、北部和流域中部山区;水质保护和授粉重要区域主要分布于流域东部、南部和中部平原区。政策情景下,产水量第二,农业产出有所下降,固碳能力较保护模式差,N/P输出最少。保护情景下产水量最大,农田产出价值不变,氮磷保持与政策情景差不多,但固碳效果最好。通过权衡不同情景下服务功能得失,筛选既不损害流域居民实际经济收入,又能使得水文服务功能得到提高的管理模式。研究表明InVEST模型可以很好的用于对自然资本评估和空间化特征分析,通过建立不同情景,评价结果可以用于权衡不同管理策略下服务功能得失,是一种评价和预测自然资本变化的有效方法,对政策制定和策略筛选具有重要的指导意义。
|
| [2] |
城市化与生态环境关系研究热点与前沿的图谱分析 [J].
城市化与生态环境关系的相关研究已成为人地关系地域系统研究的热点问题与前沿领域.基于1999-2016年WOS和CNKI数据库中城市化与生态环境相关研究主题的文献样本数据,利用Excel、SPSS和CiteSpace软件,通过学科共现分析、文献共被引分析、突现词探测、关键词共现分析和多维尺度分析等,系统梳理了城市化与生态环境关系研究领域的前沿、知识基础、现状热点与发展动态,结果显示:①研究前沿从城市化与生态环境系统的单一要素逐渐走向多要素综合研究,由单向作用逐步转向系统间和系统外部的相互作用研究;②快速城市化背景下土地利用变化、生态系统服务、气候变化、景观格局和生态环境效应等方面已成为近期研究热点;③国内相关研究缺乏在多尺度视角下利用新技术集成方法进行跨学科的综合性研究.最后,提出了城市化与生态环境的基本格局—过程—机理、跨区域的多尺度研究、城市化的生态环境效应及其影响因素、快速城市化过程中生态环境问题形成与优化调控、城市化与生态环境的可持续发展等领域的研究展望.
Research hotspots and prospects of urbanization and ecological environment relationship based on visual knowledge mapping .
城市化与生态环境关系的相关研究已成为人地关系地域系统研究的热点问题与前沿领域.基于1999-2016年WOS和CNKI数据库中城市化与生态环境相关研究主题的文献样本数据,利用Excel、SPSS和CiteSpace软件,通过学科共现分析、文献共被引分析、突现词探测、关键词共现分析和多维尺度分析等,系统梳理了城市化与生态环境关系研究领域的前沿、知识基础、现状热点与发展动态,结果显示:①研究前沿从城市化与生态环境系统的单一要素逐渐走向多要素综合研究,由单向作用逐步转向系统间和系统外部的相互作用研究;②快速城市化背景下土地利用变化、生态系统服务、气候变化、景观格局和生态环境效应等方面已成为近期研究热点;③国内相关研究缺乏在多尺度视角下利用新技术集成方法进行跨学科的综合性研究.最后,提出了城市化与生态环境的基本格局—过程—机理、跨区域的多尺度研究、城市化的生态环境效应及其影响因素、快速城市化过程中生态环境问题形成与优化调控、城市化与生态环境的可持续发展等领域的研究展望.
|
| [3] |
太湖旱地非点源污染定量化研究 [J].https://doi.org/10.3969/j.issn.1000-288X.2006.06.010 URL [本文引用: 1] 摘要
采用田间试验方法,研究了太湖地区早地氮磷向水体排放的年负荷。结果表明,太湖流域典型旱地 氮磷向水体迁移的年负荷分别为12.66,4.05kg/hm^2,分别约占年施肥量的5.6%和4.1%。示范区内旱地氮磷向水体迁移的年总量为 3.86t和1.24t。NO3^--N和PN是氮流失的主要形式,应重点控制NO3^--N和PN的流失;而PP是磷流失的主要形式,占总磷的76%, 是控制的重点。氮磷向水体迁移具有明显的季节特征,夏季和秋季为氮磷高负荷季节,6—11月占全年氮磷输出总量的83.4%和79.8%。在当前的非点源 污染治理中,应采取有力措施控制农田养分流失。
Quantification of non-point pollution from uplands in Taihu Lake Catchment .https://doi.org/10.3969/j.issn.1000-288X.2006.06.010 URL [本文引用: 1] 摘要
采用田间试验方法,研究了太湖地区早地氮磷向水体排放的年负荷。结果表明,太湖流域典型旱地 氮磷向水体迁移的年负荷分别为12.66,4.05kg/hm^2,分别约占年施肥量的5.6%和4.1%。示范区内旱地氮磷向水体迁移的年总量为 3.86t和1.24t。NO3^--N和PN是氮流失的主要形式,应重点控制NO3^--N和PN的流失;而PP是磷流失的主要形式,占总磷的76%, 是控制的重点。氮磷向水体迁移具有明显的季节特征,夏季和秋季为氮磷高负荷季节,6—11月占全年氮磷输出总量的83.4%和79.8%。在当前的非点源 污染治理中,应采取有力措施控制农田养分流失。
|
| [4] |
不同森林类型根系分布与土壤性质的关系 [J].https://doi.org/10.5846/stxb201108281254 URL Magsci [本文引用: 1] 摘要
在红壤丘陵区选取8种典型森林类型,对不同土层深度、不同径级的根长密度分布特征、根长分维数,以及根系特征与土壤容重、有机碳、全氮的关系进行了研究。结果表明:马尾松低效林根长密度最小,杉木低效林和湿地松林较大,表层土壤根长密度与灌草覆盖度显著相关(<em>r</em>=0.793,<em>P</em><0.05)。各种森林类型的根长密度随着土壤深度的增加均表现为递减规律,但随深度的增加,不同森林类型的差异逐步缩小,且植物种类及生长状况对根长密度分布的影响越来越小。在相同的土层中,根长密度随径级的变化并不一致,马尾松低效林0<<em>L</em>≤0.2 mm径级根长密度最大,其他类型各土层均表现为0.2<<em>L</em>≤0.5 mm径级根长密度最大的偏峰曲线特征。各径级根长密度随土层加深也表现为递减趋势,根系径级越大,表层与底层的根长密度差异越明显。根长密度与容重呈显著负相关,与有机碳、全氮呈极显著正相关,说明根长密度越大,既有利于改良土壤结构性状,也有利于丰富土壤有机碳和全氮含量;从不同径级来看,径级1-2 mm根系对改良土壤结构和增加土壤有机碳、全氮含量作用最为显著,径级≤1.0 mm的根系对土壤性状改良作用不明显。各森林类型的根长分维数在2.0973-2.6063之间,分维数越大,根系长度更集中分布于0-0.2 mm径级内,根长分维数反映了不同径级范围根系长度的组成状况。
Root distribution in the different forest types and their relationship to soil properties .https://doi.org/10.5846/stxb201108281254 URL Magsci [本文引用: 1] 摘要
在红壤丘陵区选取8种典型森林类型,对不同土层深度、不同径级的根长密度分布特征、根长分维数,以及根系特征与土壤容重、有机碳、全氮的关系进行了研究。结果表明:马尾松低效林根长密度最小,杉木低效林和湿地松林较大,表层土壤根长密度与灌草覆盖度显著相关(<em>r</em>=0.793,<em>P</em><0.05)。各种森林类型的根长密度随着土壤深度的增加均表现为递减规律,但随深度的增加,不同森林类型的差异逐步缩小,且植物种类及生长状况对根长密度分布的影响越来越小。在相同的土层中,根长密度随径级的变化并不一致,马尾松低效林0<<em>L</em>≤0.2 mm径级根长密度最大,其他类型各土层均表现为0.2<<em>L</em>≤0.5 mm径级根长密度最大的偏峰曲线特征。各径级根长密度随土层加深也表现为递减趋势,根系径级越大,表层与底层的根长密度差异越明显。根长密度与容重呈显著负相关,与有机碳、全氮呈极显著正相关,说明根长密度越大,既有利于改良土壤结构性状,也有利于丰富土壤有机碳和全氮含量;从不同径级来看,径级1-2 mm根系对改良土壤结构和增加土壤有机碳、全氮含量作用最为显著,径级≤1.0 mm的根系对土壤性状改良作用不明显。各森林类型的根长分维数在2.0973-2.6063之间,分维数越大,根系长度更集中分布于0-0.2 mm径级内,根长分维数反映了不同径级范围根系长度的组成状况。
|
| [5] |
太湖流域下垫面改变与气候变化的响应关系 [J].https://doi.org/10.11849/zrzyxb.2013.01.006 URL Magsci [本文引用: 1] 摘要
<p>运用两种NDVI数据集(Pathfinder AVHRR和SPOT VEGETATION)和卫星遥感数据,采用3S技术,通过人机交互式目视方法解译出1979、1984、2000和2009年太湖流域的土地利用数据,结合1956—2007年太湖流域主要气象站点的气象资料,研究了太湖流域下垫面(NDVI和土地利用)变化与各主要气候因子的响应关系。结果表明:①近30 a太湖流域NDVI变化呈先增后减的趋势,空间上呈由东北向西南递增的趋势,浙江省区域植被覆盖较好,其次为苏锡常镇地区,上海植被较为稀少;②太湖流域耕地面积显著减少,城镇用地显著增加,林地与草地呈缓慢增长趋势,其中上海和苏州城市化进程速度最快,其次是无锡、常州,而杭州、嘉兴、湖州和镇江城市化进程较为缓慢;③20世纪80年代初期太湖流域出现显著的增温,并在近20 a增温幅度显著增加,平均相对湿度呈波动下降趋势,其下降速率为-1.25%/10 a,近50 a降水总量呈现小幅上升趋势,但近20 a降水量呈减少趋势,速率达到-37.31 mm/10 a,日照时数呈现下降趋势,其下降速率为-56.66 h/10 a;④与太湖流域NDVI变化响应最为显著的气候因子为气温,其次为平均相对湿度以及日照时数,降水总量与NDVI的相关性比较弱;⑤城市化进程迅速的地区相较于城市化缓慢的地区,其增温更快、相对湿度降幅更大、降水量增加更为缓慢,日照时数减少越快。</p>
The response relationship between underlying surface changing and climate change in the Taihu Basin .https://doi.org/10.11849/zrzyxb.2013.01.006 URL Magsci [本文引用: 1] 摘要
<p>运用两种NDVI数据集(Pathfinder AVHRR和SPOT VEGETATION)和卫星遥感数据,采用3S技术,通过人机交互式目视方法解译出1979、1984、2000和2009年太湖流域的土地利用数据,结合1956—2007年太湖流域主要气象站点的气象资料,研究了太湖流域下垫面(NDVI和土地利用)变化与各主要气候因子的响应关系。结果表明:①近30 a太湖流域NDVI变化呈先增后减的趋势,空间上呈由东北向西南递增的趋势,浙江省区域植被覆盖较好,其次为苏锡常镇地区,上海植被较为稀少;②太湖流域耕地面积显著减少,城镇用地显著增加,林地与草地呈缓慢增长趋势,其中上海和苏州城市化进程速度最快,其次是无锡、常州,而杭州、嘉兴、湖州和镇江城市化进程较为缓慢;③20世纪80年代初期太湖流域出现显著的增温,并在近20 a增温幅度显著增加,平均相对湿度呈波动下降趋势,其下降速率为-1.25%/10 a,近50 a降水总量呈现小幅上升趋势,但近20 a降水量呈减少趋势,速率达到-37.31 mm/10 a,日照时数呈现下降趋势,其下降速率为-56.66 h/10 a;④与太湖流域NDVI变化响应最为显著的气候因子为气温,其次为平均相对湿度以及日照时数,降水总量与NDVI的相关性比较弱;⑤城市化进程迅速的地区相较于城市化缓慢的地区,其增温更快、相对湿度降幅更大、降水量增加更为缓慢,日照时数减少越快。</p>
|
| [6] |
太湖上游地区面源污染氮素入湖量模拟研究 [J].https://doi.org/10.11766/trxb200608240615 URL [本文引用: 1] 摘要
A study was carried out with the upriver region of the Taihu Basin as a subject.Land use information about the area was acquired by means of TM/ETM image interpretation,and the upriver region was divided into small catchments with the aid of the IDRISI software.Field monitoring was performed in some selected catchments for analysis of relationships between the land use and river water quality in the catchments,and estimation of total concentration of the nonpoint source nitrogen in runoff from forest land and farmland.Based on the analysis and estimation,a cellbased model for simulating nonpoint source pollution is developed by combining the distributed hydrological model with measured values of the typical catchment.The model is well calibrated and validated with the monthly runoff data in the period from 1980 to 2000 and then used to simulate spatial distribution and flux of nonpoint source nitrogen to the Taihu Lake.Results show that the mean concentration of total nitrogen is 0.778 mg L in runoff from forest land,and 2.518 mg L from farm land.The modeled runoff volume and total nitrogen fluxes match well the observed ones,respectively,in the validation area.The average error value is 13% for the former,and 11.6% for the latter.The nonpoint source total nitrogen flux from the upriver region to Taihu Lake is 7 632 t a,contributing about 40.8% to the total nitrogen flux of the entire basin.The flux varies with the type of land use.For farm land,the total nitrogen flux is 4 289 t a,accounting for about 24.22% of the total nonpoint source nitrogen output,and for forest land and builtup land,the total nitrogen flux is 1 849 t a and 1 270 t a,for about 24.22% and 16.64%,respectively.
Simulating fluxes of non-point source nitrogen from upriver region of Taihu Basin .https://doi.org/10.11766/trxb200608240615 URL [本文引用: 1] 摘要
A study was carried out with the upriver region of the Taihu Basin as a subject.Land use information about the area was acquired by means of TM/ETM image interpretation,and the upriver region was divided into small catchments with the aid of the IDRISI software.Field monitoring was performed in some selected catchments for analysis of relationships between the land use and river water quality in the catchments,and estimation of total concentration of the nonpoint source nitrogen in runoff from forest land and farmland.Based on the analysis and estimation,a cellbased model for simulating nonpoint source pollution is developed by combining the distributed hydrological model with measured values of the typical catchment.The model is well calibrated and validated with the monthly runoff data in the period from 1980 to 2000 and then used to simulate spatial distribution and flux of nonpoint source nitrogen to the Taihu Lake.Results show that the mean concentration of total nitrogen is 0.778 mg L in runoff from forest land,and 2.518 mg L from farm land.The modeled runoff volume and total nitrogen fluxes match well the observed ones,respectively,in the validation area.The average error value is 13% for the former,and 11.6% for the latter.The nonpoint source total nitrogen flux from the upriver region to Taihu Lake is 7 632 t a,contributing about 40.8% to the total nitrogen flux of the entire basin.The flux varies with the type of land use.For farm land,the total nitrogen flux is 4 289 t a,accounting for about 24.22% of the total nonpoint source nitrogen output,and for forest land and builtup land,the total nitrogen flux is 1 849 t a and 1 270 t a,for about 24.22% and 16.64%,respectively.
|
| [7] |
不同土地利用类型植物根系与土壤抗蚀性关系研究 [J].https://doi.org/10.3969/j.issn.1000-7601.2013.02.021 URL [本文引用: 1] 摘要
对紫色土四种土地利用类型耕层土壤中植被根系分布特征进行量化分 析,并在此基础上揭示根系分布与土壤抗蚀性评价指标的内在关系,以明确根系对土壤抗蚀性的影响机理.结果表明:小径级根系特别是径级<1 mm的根系对于<0.25 mm土壤团聚体形成和<0.5 mm土壤团聚体形成均有促进作用;<0.5 mm的根系长度与结构体破坏率、团聚状况、< 0.001 mm颗粒含量和<0.01 mm颗粒含量均显著相关;竹林地根系含量最为丰富,<0.5 mm根系平均长度值最大,土壤团粒结构最好,其抗蚀性最强,传统农耕地根系稀少,其抗蚀性最差.
Study on relationship between plant roots and soil anti-erodibility of different land utilization types .https://doi.org/10.3969/j.issn.1000-7601.2013.02.021 URL [本文引用: 1] 摘要
对紫色土四种土地利用类型耕层土壤中植被根系分布特征进行量化分 析,并在此基础上揭示根系分布与土壤抗蚀性评价指标的内在关系,以明确根系对土壤抗蚀性的影响机理.结果表明:小径级根系特别是径级<1 mm的根系对于<0.25 mm土壤团聚体形成和<0.5 mm土壤团聚体形成均有促进作用;<0.5 mm的根系长度与结构体破坏率、团聚状况、< 0.001 mm颗粒含量和<0.01 mm颗粒含量均显著相关;竹林地根系含量最为丰富,<0.5 mm根系平均长度值最大,土壤团粒结构最好,其抗蚀性最强,传统农耕地根系稀少,其抗蚀性最差.
|
| [8] |
太湖流域春季不同土地利用类型蒸散速率的比较 [J].
运用静态箱/红外气体分析仪法 (static chamber/IRGA),研究了太湖流域茶园、油菜地、小麦地和撂荒地4种不同土地利用类型春季蒸散速率的变化特征,分别对3—5月不同生育期以及 6:00—15:00不同时段4种土地利用类型蒸散速率进行了比较。结果表明,太湖流域春季不同土地利用类型蒸散速率总体呈现逐渐增大的趋势,但茶园修剪 后蒸散速率大幅下降(36.73%),油菜地在始花期亦突现一峰值〔2.14mmol/(m2·s)〕;4种土地利用类型蒸散速率的日变化呈以12:00 —15:00为峰值的单峰曲线,但茶园修剪后蒸散速率的日变化平缓,油菜地和小麦地蒸散速率的日变化幅逐渐增大。4种土地利用类型3—5月蒸散速率日均值 从大到小依次为:茶园〔2.24mmol/(m2·s)〕油菜地〔1.48mmol/(m2·s)〕小麦地〔1.28mmol/(m2·s)〕撂荒地 〔1.16mmol/(m2·s)〕;3月下旬12:00—15:00,以及4月中旬9:00—15:00为茶园蒸散速率极显著高于油菜地、小麦地和撂荒 地的关键时期,差异最大。
Comparison study on evapotranspiation characteristics of different landuse types in Taihu Lake Wastershed .
运用静态箱/红外气体分析仪法 (static chamber/IRGA),研究了太湖流域茶园、油菜地、小麦地和撂荒地4种不同土地利用类型春季蒸散速率的变化特征,分别对3—5月不同生育期以及 6:00—15:00不同时段4种土地利用类型蒸散速率进行了比较。结果表明,太湖流域春季不同土地利用类型蒸散速率总体呈现逐渐增大的趋势,但茶园修剪 后蒸散速率大幅下降(36.73%),油菜地在始花期亦突现一峰值〔2.14mmol/(m2·s)〕;4种土地利用类型蒸散速率的日变化呈以12:00 —15:00为峰值的单峰曲线,但茶园修剪后蒸散速率的日变化平缓,油菜地和小麦地蒸散速率的日变化幅逐渐增大。4种土地利用类型3—5月蒸散速率日均值 从大到小依次为:茶园〔2.24mmol/(m2·s)〕油菜地〔1.48mmol/(m2·s)〕小麦地〔1.28mmol/(m2·s)〕撂荒地 〔1.16mmol/(m2·s)〕;3月下旬12:00—15:00,以及4月中旬9:00—15:00为茶园蒸散速率极显著高于油菜地、小麦地和撂荒 地的关键时期,差异最大。
|
| [9] |
太湖河网地区农村非点源氮负荷: 以宜兴市大浦镇为例 [J].
<FONT face=Verdana>采用野外试验与实地调查相结合,利用泥沙流失方程和GIS平台,定量估算了江苏<BR>宜兴市大浦镇农村非点源氮排放负荷。结果表明:大浦镇农村非点源氮排放负荷为207.0 t<BR>·a<SUP>-1</SUP>,其中农田、生活污水、养殖、垃圾和非农田泥沙流失的排放负荷分别为80.6、61.1、49.3、10.5和5.4 t·a<SUP>-1</SUP>,分别占39.0%、29.5%、23.8%、5.1%和2.6%;5种排放源中,农田、生活污水和养殖为优先控制因子;方钱、大浦、浦北和浦南4村平均氮排放负荷为80.4、73.0、60.4和52.3 kg·hm<SUP>-2</SUP>·a<SUP>-1</SUP>,远高于其他区域,为优先控制区。</FONT>
Nitrogen load from ruralnon-point source in river network region, Taihu Lake: A case study from Dapu Town in Yixing City .
<FONT face=Verdana>采用野外试验与实地调查相结合,利用泥沙流失方程和GIS平台,定量估算了江苏<BR>宜兴市大浦镇农村非点源氮排放负荷。结果表明:大浦镇农村非点源氮排放负荷为207.0 t<BR>·a<SUP>-1</SUP>,其中农田、生活污水、养殖、垃圾和非农田泥沙流失的排放负荷分别为80.6、61.1、49.3、10.5和5.4 t·a<SUP>-1</SUP>,分别占39.0%、29.5%、23.8%、5.1%和2.6%;5种排放源中,农田、生活污水和养殖为优先控制因子;方钱、大浦、浦北和浦南4村平均氮排放负荷为80.4、73.0、60.4和52.3 kg·hm<SUP>-2</SUP>·a<SUP>-1</SUP>,远高于其他区域,为优先控制区。</FONT>
|
| [10] |
太湖流域农业非点源污染优先识别区研究: 以昆山为例 [J].https://doi.org/10.3321/j.issn:1672-2043.2009.09.017 URL [本文引用: 1] 摘要
在现场调查和收集农业环境数据的基础上,通过地理信息系统及计算机等辅助手段,将已建立的农业非点源污染发生潜力评价系统(APPI)应用于县域范围,研究了昆山市11个城镇非点源污染负荷情况并识别出优先控制区。结果表明,昆山市非点源污染氮磷总排放量约为4.54×10⁶kg·a-1,其中农田氮磷排放总量约为4.30×10⁵kg·a-1,农村居民氮磷排放总量约为1.44×10⁶kg·a-1,城镇居民氮磷排放总量约为1.36×10⁶kg·a-1,畜禽氮磷排放总量约为1.31×10⁶kg·a-1。昆山市农业非点源污染发生潜力最大的3个乡镇为千灯镇、张浦镇和淀山湖镇,并对各乡镇不同类型污染源的负荷做了分析。该评价系统在太湖地区县域范围有一定的推广价值,具体参数仍需进一步完善。
Application of agricultural non-point source pollution potential index in typical area of Taihu: A case study in Kunshan City. Journal of https://doi.org/10.3321/j.issn:1672-2043.2009.09.017 URL [本文引用: 1] 摘要
在现场调查和收集农业环境数据的基础上,通过地理信息系统及计算机等辅助手段,将已建立的农业非点源污染发生潜力评价系统(APPI)应用于县域范围,研究了昆山市11个城镇非点源污染负荷情况并识别出优先控制区。结果表明,昆山市非点源污染氮磷总排放量约为4.54×10⁶kg·a-1,其中农田氮磷排放总量约为4.30×10⁵kg·a-1,农村居民氮磷排放总量约为1.44×10⁶kg·a-1,城镇居民氮磷排放总量约为1.36×10⁶kg·a-1,畜禽氮磷排放总量约为1.31×10⁶kg·a-1。昆山市农业非点源污染发生潜力最大的3个乡镇为千灯镇、张浦镇和淀山湖镇,并对各乡镇不同类型污染源的负荷做了分析。该评价系统在太湖地区县域范围有一定的推广价值,具体参数仍需进一步完善。
|
| [11] |
太湖上游流域经济发展对废水排放及入湖总磷的影响 [J].https://doi.org/10.18307/2015.0616 URL [本文引用: 1] 摘要
为探索太湖流域水环境质量随经济发展的变化趋势,利用环境库兹涅茨曲线模型模拟1978-2012年太湖上游流域人均GDP与废水排放量、入湖总磷负荷的关系.结果表明:以1978年为计算基期,太湖上游流域人均GDP年均增速为10.3%~11.8%;1990-2012年,太湖上游流域年均工业废水排放量和废水排放总量分别为64799×104、93707×104t,与人均GDP均呈倒U型关系,从2006-2007年、2008-2009年呈下降趋势;入湖总磷负荷与太湖上游流域废水排放总量呈显著正相关,且与人均GDP呈倒U型关系,从2007-2008年呈下降趋势,在1990s以前为850~1200 t/a,1990s以后为1300~2000 t/a.该研究为从经济学角度评估太湖上游流域废水排放、入湖总磷负荷及其变化趋势提供科学依据.
Effects of economic development on wastewater discharge and influent total phosphorus load in the upstream of Lake Taihu Basin .https://doi.org/10.18307/2015.0616 URL [本文引用: 1] 摘要
为探索太湖流域水环境质量随经济发展的变化趋势,利用环境库兹涅茨曲线模型模拟1978-2012年太湖上游流域人均GDP与废水排放量、入湖总磷负荷的关系.结果表明:以1978年为计算基期,太湖上游流域人均GDP年均增速为10.3%~11.8%;1990-2012年,太湖上游流域年均工业废水排放量和废水排放总量分别为64799×104、93707×104t,与人均GDP均呈倒U型关系,从2006-2007年、2008-2009年呈下降趋势;入湖总磷负荷与太湖上游流域废水排放总量呈显著正相关,且与人均GDP呈倒U型关系,从2007-2008年呈下降趋势,在1990s以前为850~1200 t/a,1990s以后为1300~2000 t/a.该研究为从经济学角度评估太湖上游流域废水排放、入湖总磷负荷及其变化趋势提供科学依据.
|
| [12] |
太湖流域非点源污染负荷估算系统的设计与应用 [J].
非点源污染是太湖流域水环境污染的主要来源,定量研究太湖流域非点源污染负荷,可为非点源污染的预报与防治提供决策依据。传统非点源污染负荷研究中GIS与非点源污染模型松散式结合的方式存在数据管理与转换工作量大的问题,尝试采用嵌合模式设计和开发太湖流域非点源污染负荷估算系统。介绍了系统的结构与功能,分析了系统主要功能模块——SCS模型、USLE模型和非点源污染负荷模型的实现流程。基于该系统进行了无锡市2005年非点源污染TN负荷的估算,结果显示其负荷总量为8 014.43t。农业生产和生活污水的排放是该区非点源污染的主要来源。系统的应用表明其简化了模型计算的复杂过程,结果能够较客观地反映研究区域的非点源污染状况及其与土地利用的关系,具有较强的实用性。
Design and application of norrpoint source pollution load estimating system in Taihu Lake Basin .
非点源污染是太湖流域水环境污染的主要来源,定量研究太湖流域非点源污染负荷,可为非点源污染的预报与防治提供决策依据。传统非点源污染负荷研究中GIS与非点源污染模型松散式结合的方式存在数据管理与转换工作量大的问题,尝试采用嵌合模式设计和开发太湖流域非点源污染负荷估算系统。介绍了系统的结构与功能,分析了系统主要功能模块——SCS模型、USLE模型和非点源污染负荷模型的实现流程。基于该系统进行了无锡市2005年非点源污染TN负荷的估算,结果显示其负荷总量为8 014.43t。农业生产和生活污水的排放是该区非点源污染的主要来源。系统的应用表明其简化了模型计算的复杂过程,结果能够较客观地反映研究区域的非点源污染状况及其与土地利用的关系,具有较强的实用性。
|
| [13] |
太湖流域农业面源污染及控制研究进展 [J].https://doi.org/10.3969/j.issn.1002-2104.2010.01.018 URL [本文引用: 1] 摘要
太湖及其流域的水环境质量呈现严重恶化趋势,农业面源污染是太湖流域水体环境恶化的主要原因之一.论文通过文献分析,总结了太湖流域农业面源污染的影响因素、相应的治理措施以及农业面源污染控制的特点.结果表明:①虽然太湖流域典型区域的面源污染影响及排污系数的研究较多,但是着眼于太湖流域整体的农业面源污染负荷总量的研究并没有明确答案:②农业面源污染的治理技术研究较多,但将这些自然科学成果应用到实际的管理实践中的政策研究较少;③对农田面源污染的研究较多,对畜禽渔业养殖废弃物处理的研究比较薄弱,并且两者没有很好地结合起来进行研究;④虽然已经有了一些关于农业面源污染控制管理的讨论,但缺乏管理实施标准的研究;⑤围绕农业面源污染治理的主要手段都与农户行为有关,例如土地利用方式、耕作方式等,但现在很少有从环境污染主体即农户行为的角度去研究如何减少环境污染.
Review of agricultural non-point pollution in Taihu Lake and Taihu Basin .https://doi.org/10.3969/j.issn.1002-2104.2010.01.018 URL [本文引用: 1] 摘要
太湖及其流域的水环境质量呈现严重恶化趋势,农业面源污染是太湖流域水体环境恶化的主要原因之一.论文通过文献分析,总结了太湖流域农业面源污染的影响因素、相应的治理措施以及农业面源污染控制的特点.结果表明:①虽然太湖流域典型区域的面源污染影响及排污系数的研究较多,但是着眼于太湖流域整体的农业面源污染负荷总量的研究并没有明确答案:②农业面源污染的治理技术研究较多,但将这些自然科学成果应用到实际的管理实践中的政策研究较少;③对农田面源污染的研究较多,对畜禽渔业养殖废弃物处理的研究比较薄弱,并且两者没有很好地结合起来进行研究;④虽然已经有了一些关于农业面源污染控制管理的讨论,但缺乏管理实施标准的研究;⑤围绕农业面源污染治理的主要手段都与农户行为有关,例如土地利用方式、耕作方式等,但现在很少有从环境污染主体即农户行为的角度去研究如何减少环境污染.
|
| [14] |
人口密度空间化的一种方法 [J].https://doi.org/10.3969/j.issn.1672-0504.2005.05.011 URL [本文引用: 1] 摘要
人口密度空间化是地理学中一个重要的研究课题,但是传统方法直接生成的人口密度分布图具有不同区域间突变的缺点.该文中基于面积权重内插法与邻域平均法原理,以MapInfo为软件平台,在缺乏地形图、RS图片等资料的情况下,提出人口密度空间化的一种方法--网格单元面积权重内插法,并以丰县为研究区域进行例证.结果表明:该方法有效缓和了传统方法直接生成的人口密度图中的突变线,制作的人口密度Grid专题地图能够很好地反映人口密度的平均性,生成的人口密度三维可视化地图符合人口密度的空间分布特点.
A method of spatialization of population density .https://doi.org/10.3969/j.issn.1672-0504.2005.05.011 URL [本文引用: 1] 摘要
人口密度空间化是地理学中一个重要的研究课题,但是传统方法直接生成的人口密度分布图具有不同区域间突变的缺点.该文中基于面积权重内插法与邻域平均法原理,以MapInfo为软件平台,在缺乏地形图、RS图片等资料的情况下,提出人口密度空间化的一种方法--网格单元面积权重内插法,并以丰县为研究区域进行例证.结果表明:该方法有效缓和了传统方法直接生成的人口密度图中的突变线,制作的人口密度Grid专题地图能够很好地反映人口密度的平均性,生成的人口密度三维可视化地图符合人口密度的空间分布特点.
|
| [15] |
人地系统耦合框架下的生态系统服务 [J].https://doi.org/10.18306/dlkxjz.2018.01.015 URL [本文引用: 1] 摘要
生态系统服务是连接自然环境与人类福祉的桥梁,是人地系统耦合研究的核心内容。本文在构建生态系统服务与人地系统耦合研究框架的基础上,系统梳理了生态系统服务评估、生态系统服务权衡、生态系统服务影响因素、生态系统服务供给流动与需求等研究前沿,提出了未来生态系统服务研究的重点领域。主要研究结论认为:(1)国际生态系统服务模型发展迅速,SAORES模型是中国生态系统服务模型优化与参数本地化的突出代表;(2)生态系统服务权衡具有相对复杂的时空尺度,权衡分析的前提是辨析不同尺度生态系统结构—过程—功能—服务的作用机制;(3)自然因素是生态系统服务时空分布的基础,土地利用能改变生态系统结构、功能与生态系统服务变化,社会经济因素会导致生态系统服务权衡的差异;(4)为明晰生态系统服务供给与需求耦合关系,需进一步识别生态系统服务流的运移路径;(5)未来生态系统服务研究需加强生态系统服务对全球变化的响应特征和机制分析、面向可持续发展目标的生态系统服务供给流动与需求研究、生态系统服务的动态评价集成与优化、生态系统服务与人地系统耦合、生态系统服务与大数据集成等。
Ecosystem services for coupled human and environment systems .https://doi.org/10.18306/dlkxjz.2018.01.015 URL [本文引用: 1] 摘要
生态系统服务是连接自然环境与人类福祉的桥梁,是人地系统耦合研究的核心内容。本文在构建生态系统服务与人地系统耦合研究框架的基础上,系统梳理了生态系统服务评估、生态系统服务权衡、生态系统服务影响因素、生态系统服务供给流动与需求等研究前沿,提出了未来生态系统服务研究的重点领域。主要研究结论认为:(1)国际生态系统服务模型发展迅速,SAORES模型是中国生态系统服务模型优化与参数本地化的突出代表;(2)生态系统服务权衡具有相对复杂的时空尺度,权衡分析的前提是辨析不同尺度生态系统结构—过程—功能—服务的作用机制;(3)自然因素是生态系统服务时空分布的基础,土地利用能改变生态系统结构、功能与生态系统服务变化,社会经济因素会导致生态系统服务权衡的差异;(4)为明晰生态系统服务供给与需求耦合关系,需进一步识别生态系统服务流的运移路径;(5)未来生态系统服务研究需加强生态系统服务对全球变化的响应特征和机制分析、面向可持续发展目标的生态系统服务供给流动与需求研究、生态系统服务的动态评价集成与优化、生态系统服务与人地系统耦合、生态系统服务与大数据集成等。
|
| [16] |
Spatial data, analysis approaches, and information needs for spatial ecosystem service assessments: A review [J]. |
| [17] |
Spatio-temporal evolution of water-related ecosystem services: Taihu Basin, China [J].
Water-related ecosystem services (WESs) arise from the interaction between water ecosystems and their surrounding terrestrial ecosystems. They are critical for human well-being as well as for the whole ecological circle. An urgent service-oriented reform for the utilization and supervision of WESs can assist in avoiding ecological risks and achieving a more sustainable development in the Taihu Basin, China (THB). Spatially distributed models allow the multiple impacts of land use/land cover conversion and climate variation on WESs to be estimated and visualized efficiently, and such models can form a useful component in the toolbox for integrated water ecosystem management. The Integrated Valuation of Ecosystem Services and Tradeoffs model is used here to evaluate and visualize the spatiotemporal evolution of WESs in the THB from 2000 to 2010. Results indicate that water retention service experienced a decline from 2000 to 2005 with a recovery after 2005, while there was ongoing water scarcity in urban areas. Both the water purification service and the soil retention service underwent a slight decrease over the study period. Nutrients export mainly came from developed land and cultivated land, with the hilly areas in the south of the THB forming the primary area for soil loss. The quantity and distribution of WESs were impacted significantly by the shrinkage of cultivated land and the expansion of developed land. These findings will lay a foundation for a service-oriented management of WESs in the THB and support evidence-based decision making.
|
| [18] |
The impact of land-use change on water-related ecosystem services: A study of the Guishui River Basin, Beijing, China [J].https://doi.org/10.1016/j.jclepro.2016.01.049 URL [本文引用: 1] 摘要
61This paper assessed the land-use change from 1980 to 2011.61Four future land-use scenarios were developed.61The impact of past and future land-use changes on ecosystem services was examined.61The InVEST model was selected to quantify the changes in ecosystem services.
|
| [19] |
Assessing water ecosystem services for water resource management [J].https://doi.org/10.1016/j.envsci.2016.04.008 URL [本文引用: 2] 摘要
Ecosystem service concepts can offer a valuable approach for linking human and nature, and arguments for the conservation and restoration of natural ecosystems. Despite an increasing interest in the topic, the application of these concepts for water resource management has been hampered by the lack of practical definitions and methodologies. In this study we review and analyse the current literature and propose an approach for assessing and valuing ecosystem services in the context of water management. In particular, to study the link between multiple pressures, ecological status and delivery of ecosystem services in aquatic ecosystems under different scenarios of measures or future changes. This is of interest for the development of River Basin Management Plans under the EU Water Framework Directive. We provide a list of proxies/indicators of natural capacity, actual flow and social benefit for the biophysical assessment of the ecosystem services. We advocate the use of indicators of sustainability, combining information on capacity and flow of services. We also suggest methods for economic valuation of aquatic ecosystem for each service and spatial scale of application. We argue that biophysical assessment and economic valuation should be conducted jointly to account for the different values of ecosystem services (ecologic, social and economic) and to strengthen the recognition of human dependency on nature. The proposed approach can be used for assessing the benefits of conservation and restoration of aquatic ecosystems in the implementation of the EU water policy.
|
| [20] |
Ecosystem services: Challenges and opportunities for hydrologic modeling to support decision making [J].https://doi.org/10.1002/2014WR015497 URL [本文引用: 2] 摘要
Ecosystem characteristics and processes provide significant value to human health and well‐being, and there is growing interest in quantifying those values. Of particular interest are water‐related ecosystem services and the incorporation of their value into local and regional decision making. This presents multiple challenges and opportunities to the hydrologic‐modeling community. To motivate advances in water‐resources research, we first present three common decision contexts that draw upon an ecosystem‐service framework: scenario analysis, payments for watershed services, and spatial planning. Within these contexts, we highlight the particular challenges to hydrologic modeling, and then present a set of opportunities that arise from ecosystem‐service decisions. The paper concludes with a set of recommendations regarding how we can prioritize our work to support decisions based on ecosystem‐service valuation.
|
| [21] |
Ecosystem services of human-dominated watersheds and land use influences: A case study from the Dianchi Lake Watershed in China [J].https://doi.org/10.1007/s10661-016-5629-0 URL PMID: 27822787 [本文引用: 2] 摘要
Abstract Watersheds provide multiple ecosystem services. Ecosystem service assessment is a promising approach to investigate human-environment interaction at the watershed scale. The spatial characteristics of ecosystem services are closely related to land use statuses in human-dominated watersheds. This study aims to investigate the effects of land use on the spatial variations of ecosystem services at the Dianchi Lake watershed in Southwest China. We investigated the spatial variations of six ecosystem services-food supply, net primary productivity (NPP), habitat quality, evapotranspiration, water yield, and nitrogen retention. These services were selected based on their significance at the Dianchi Lake watershed and the availability of their data. The quantification of these services was based on modeling, value transference, and spatial analysis in combination with biophysical and socioeconomic data. Furthermore, we calculated the values of ecosystem services provided by different land use types and quantified the correlations between ecosystem service values and land use area proportions. The results show considerable spatial variations in the six ecosystem services associated with land use influences in the Dianchi Lake watershed. The cropland and forest land use types had predominantly positive influences on food productivity and NPP, respectively. The rural residential area and forest land use types reduced and enhanced habitat quality, respectively; these influences were identical to those of evapotranspiration. Urban area and rural residential area exerted significantly positive influences on water yield. In contrast, water yield was negatively correlated with forest area proportion. Finally, cropland and forest had significantly positive and negative influences, respectively, on nitrogen retention. Our study emphasizes the importance of consideration of the influences from land use composition and distribution on ecosystem services for managing the ecosystems of human-dominated watersheds.
|
| [22] |
Integrating ecosystem services trade-offs with paddy land-to-dry land decisions: A scenario approach in Erhai Lake Basin, Southwest China [J].https://doi.org/10.1016/j.scitotenv.2017.12.340 URL PMID: 29306828 [本文引用: 1] 摘要
Ecosystem services are the benefits people obtain from ecosystems, and ecosystem services trade-offs have been widely applied to the development of land-use policy. Although previous studies have focused on trade-offs of ecosystem services, a scenario approach has been seldom used. The scenario approach can reveal the changes of ecosystem services for different land-use patterns in the future, and is of great significance for land-use decisions and ecosystem management. Based on the actual situation of deteriorating water quality and dwindling water supply in the Erhai Lake Basin of southwest China, this study put forward to convert paddy land to dry land (PLDL) in the basin, and simulated its potential impact on ecosystem services. Taking environmental pollution, social impact, economic benefit and residential participation into consideration, four scenarios of PLDL were designed. Then, four ecosystem services (water purification, water yield, soil conservation and rice production) were calculated for each scenario. The optimal scenario of PLDL in the Erhai Lake Basin was identified by trade-offs of the four ecosystem services. The results showed that the total nitrogen export could be reduced by 42.07% and water yield can be increased by 5.61% after converting 100% of paddy lands to dry land, thereby greatly improving the water quality and increasing the water yield of Erhai Lake. However, PLDL involving 100% of paddy lands also increased the sediment export by 17.22%, and eliminated rice production in the region. By comparing the four PLDL scenarios for converting just 50% of paddy lands, the residential participation scenario was identified to be the best choice for PLDL implementation because it achieved the best level of water purification and had the smallest negative effect on other ecosystem services. The optimal scenario for each township showed spatial differentiation, and there were conflicts between the optimal scenarios at basin scale and township scale, suggesting that the object and the spatial-temporal scale should be taken into consideration in land-use decisions using ecosystem services trade-offs.
|
| [23] |
Multi-angle indicators system of non-point pollution source assessment in rural areas: A case study near Taihu Lake [J].https://doi.org/10.1007/s00267-013-0024-x URL PMID: 23456193 [本文引用: 1] 摘要
This study aims to identify key environmental risk sources contributing to water eutrophication and to suggest certain risk management strategies for rural areas. The multi-angle indicators included in the risk source assessment system were non-point source pollution, deficient waste treatment, and public awareness of environmental risk, which combined psychometric paradigm methods, the contingent valuation method, and personal interviews to describe the environmental sensitivity of local residents. Total risk values of different villages near Taihu Lake were calculated in the case study, which resulted in a geographic risk map showing which village was the critical risk source of Taihu eutrophication. The increased application of phosphorus (P) and nitrogen (N), loss vulnerability of pollutant, and a lack of environmental risk awareness led to more serious non-point pollution, especially in rural China. Interesting results revealed by the quotient between the scores of objective risk sources and subjective risk sources showed what should be improved for each study village. More environmental investments, control of agricultural activities, and promotion of environmental education are critical considerations for rural environmental management. These findings are helpful for developing targeted and effective risk management strategies in rural areas.
|
| [24] |
Impact and mitigation of global change on freshwater-related ecosystem services in southern Europe [J].https://doi.org/10.1016/j.scitotenv.2018.09.228 URL [本文引用: 1] |
| [25] |
Modelling the risk of land cover change from environmental and socio-economic drivers in heterogeneous and changing landscapes: The role of uncertainty [J].https://doi.org/10.1016/j.landurbplan.2011.01.009 URL [本文引用: 1] 摘要
Knowledge of land cover dynamics and driving forces is a fundamental tool for landscape planning and management. Nevertheless, this understanding is often limited by the paucity of accurate land cover data. In this sense, remote-sensing offers the possibility of acquiring detailed land cover inventories by applying different methods of image classification. However, in heterogeneous and changing landscapes, these data may be insufficient to detect temporal changes (and their causes) because of the uncertainty associated with misclassification and the spatio-temporal variability of change patterns. In this work, we present a multi-temporal uncertainty-based method that incorporates regression models to establish the risk (probability) of land cover change (RLCC), as a function of a set of environmental and socioeconomic driving factors. After filtering out uncertainty for dependent variables (land cover changes), the accuracy of the models increased and regression yielded more parsimonious models that identified the relevant predictors more efficiently. Considering all land cover changes as a whole, drivers relating to the physical environment (i.e., soil properties, accessibility, altitude, slope, solar radiation and rainfall) were more frequently selected than those related to agriculture, society or economy, which may be due to the poor quality of the available socioeconomic data at the municipality level. When analysing changes separately, several differences appeared (e.g. woody vegetation cover was related with fire events and water availability or human management with forest expansion). Our methodological approach has demonstrated that uncertainty plays an important role in model characterisation and identification of potential drivers of change. (C) 2011 Elsevier B.V. All rights reserved.
|
| [26] |
Comparing SWAT and InVEST models for water yield and nutrient export: When is a simple model good enough for decision support? [R]. |
| [27] |
How ecological feedbacks between human population and land cover influence sustainability [J].https://doi.org/10.1371/journal.pcbi.1006389 URL [本文引用: 1] |
| [28] |
Sustainability assessment and causality nexus through ecosystem service accounting: The case of water purification in Europe [J].https://doi.org/10.1016/j.jenvman.2018.06.072 URL [本文引用: 1] |
| [29] |
Indicators for spatial-temporal comparisons of ecosystem service status between regions: A case study of the Taihu River Basin, China [J].https://doi.org/10.1016/j.ecolind.2015.09.002 URL [本文引用: 1] 摘要
With the development of ecological science, the demand to integrate ecosystem services into ecological management is increasing. Stakeholders are interested in comparing stocks and ability to supply ecosystem services in different regions. However, different areas may have different primary ecosystem services and knowledge of the aggregated value of ecosystem services may be lacking, making comparisons difficult. Relevant indicators that can integrate a group of ecosystem services for comparison are therefore needed. This paper formulated two indicators, ecosystem service supply rate and supply–demand ratio, and applied them in a case study to compare and map the spatial–temporal status of ecosystem services and the ability to supply these in different regions. Using nine regions in the Taihu River Basin in China as an example, data obtained from high-resolution spatial land use, land cover maps and stakeholder interviews were used to identify the spatial–temporal potential supply and flow of ecosystem services and human demand patterns. The results showed that ecosystem service supply rate had declined from 2000 to 2010, indicating that the overall proportion of potential ecosystem services turned into flow in the Taihu River Basin declined. Determination of supply–demand ratio revealed that the status of ecosystem service provision in the basin is in deficit, with the deficit increasing between 2000 and 2010. These findings indicate that ecosystem service supply rate and supply–demand ratio are useful indicators of ecosystem service status and can permit comparisons between regions on both a spatial and temporal scale.
|
| [30] |
Fuzzy two-stage non-point source pollution management model for agricultural systems: A case study for the Lake Tai Basin, China [J].https://doi.org/10.1016/j.agwat.2013.01.006 URL [本文引用: 1] |
| [31] |
Global anthropogenic phosphorus loads to freshwater and associated grey water footprints and waterpollution levels: A high-resolution global study [J].https://doi.org/10.1002/2017WR020448 URL [本文引用: 1] 摘要
Abstract We estimate the global anthropogenic phosphorus (P) loads to freshwater and the associated grey water footprints (GWFs) for the period 2002-2010, at a spatial resolution of 5 5 arc minute, and compare the GWF per river basin to runoff to assess the P-related water pollution level (WPL). The global anthropogenic P load to freshwater systems from both diffuse and point sources is estimated at 1.5 Tg/y. More than half of this total load was in Asia, followed by Europe (19%) and Latin America and the Caribbean (13%). The domestic sector contributed 54% to the total, agriculture 38% and industry 8%. In agriculture, cereals production had the largest contribution to the P load (31%), followed by fruits, vegetables, and oil crops, each contributing 15%. The global total GWF related to anthropogenic P loads is estimated to be 147 1012 m3/y, with China contributing 30%, India 8%, USA 7% and Spain and Brazil 6% each. The basins with WPL>1 (where GWF exceeds the basin's assimilation capacity) together cover about 38% of the global land area, 37% of the global river discharge, and provide residence to about 90% of the global population.
|
| [32] |
Interactions between freshwater ecosystem services and land cover changes in southern bangladesh: A perspective from short-term (seasonal) and long-term (1973-2014) scale [J].https://doi.org/10.1016/j.scitotenv.2018.08.430 URL [本文引用: 1] |
| [33] |
Tools for spatially modeling ecosystem services: Publication trends, conceptual reflections and future challenges [J].https://doi.org/10.1016/j.ecoser.2017.06.011 URL [本文引用: 1] |
| [34] |
Improvements in ecosystem services from investments in natural capital [J].https://doi.org/10.1126/science.aaf2295 URL PMID: 27313045 [本文引用: 1] 摘要
In response to ecosystem degradation from rapid economic development, China began investing heavily in protecting and restoring natural capital starting in 2000. We report on China’s first national ecosystem assessment (2000–2010), designed to quantify and help manage change in ecosystem services, including food production, carbon sequestration, soil retention, sandstorm prevention, water retention, flood mitigation, and provision of habitat for biodiversity. Overall, ecosystem services improved from 2000 to 2010, apart from habitat provision. China’s national conservation policies contributed significantly to the increases in those ecosystem services.
|
| [35] |
Cost-effective land use planning: Optimizing land use and land management patterns to maximize social benefits [J].https://doi.org/10.1016/j.ecolecon.2017.04.024 URL [本文引用: 1] 摘要
Improving water quality and other ecosystem services in agriculturally dominated watersheds is an important policy objective in many regions of the world. A major challenge is overcoming the associated costs to agricultural producers. We integrate spatially-explicit models of ecosystem processes with agricultural commodity production models to analyze the biophysical and economic consequences of alternative land use and land management patterns to achieve Total Maximum Daily Loads targets in a proto-typical agricultural watershed. We apply these models to find patterns that maximize water quality objectives for given levels of foregone agricultural profit. We find it is possible to reduce baseline watershed phosphorus loads by ~20% and sediment loads by ~18% without any reduction in agricultural profits. Our results indicate that meeting more stringent targets will result in substantial economic loss. However, when we add the social benefits from water quality improvement and carbon sequestration to private agricultural net returns we find that water quality improvements up to 50% can be obtained at no loss to societal returns. The cost of meeting water quality targets will vary over time as commodity and ecosystem service prices fluctuate. If crop prices drop or the value of ecosystem services increase, then achieving higher water quality goals will be less costly.
|
| [36] |
Forest restoration efforts drive changes in land-use/land-cover and water-related ecosystem services in China's Han River Basin [J].https://doi.org/10.1016/j.ecoleng.2018.11.001 URL [本文引用: 1] |
| [37] |
National scale evaluation of the InVEST nutrient retention model in the United Kingdom [J]. |
| [38] |
Integrated assessment of agricultural land use policies on nutrient pollution and sustainable development in Taihu Basin, China [J]. |
| [39] |
Dissolved and particulate nutrient export from rural catchments: A case study from Luxembourg [J].https://doi.org/10.1016/j.scitotenv.2005.02.005 URL PMID: 15907510 [本文引用: 1] 摘要
Nutrient enrichment of freshwaters continues to be one of the most serious problems facing the management of surface waters. Effective remediation/conservation measures require accurate qualitative and quantitative knowledge of nutrient sources, transport mechanisms, transformations and annual dynamics of different nitrogen (N) and phosphorus (P) forms. In this paper, nitrate (NO 3-N), soluble reactive phosphorus (SRP) and total phosphorus (TP) concentrations and loads are presented for two adjacent rural basins of 306 km 2 and 424 km 2, and for five sub-basins differing in size (between 1 km 2 and 33 km 2), land use (extent of forest cover between 20% and 93%) and household pressure (from 0 to 40 people/km 2) with the aim of studying the influence of land use and catchment size on nutrient exports. The studied catchments are all situated on Devonian schistous substrates in the Ardennes region (Belgium–Luxembourg), and therefore have similar hydrological regimes. As the study period could not be the same for all basins, annual export coefficients were corrected with the 25 years normalized discharge of the S04re River: two regression analyses (for dry and humid periods) relating monthly nutrient loads to monthly runoff were used to determine correction factors to be applied to each parameter and each basin. This procedure allows for the comparing annual export coefficients from basins sampled in different years. Results show a marked seasonal response and a large variability of NO 3-N export loads between forested (4 kg N ha 61 1 year 61 1), agricultural (27–33 kg N ha 61 1 year 61 1) and mixed catchments (17–22 kg N ha 61 1 year 61 1). For SRP and TP, no significant agricultural impact was found. Land and bank erosion control the total P massflow in the studied catchments (0.4–1.3 kg P ha 61 1 year 61 1), which is mostly in a particulate form, detached and transported during storm events. Soluble reactive P fluxes ranged between 10% and 30% of the TP mass, depending on the importance of point sources in the basins studied. No relation was found between the size of the basins and the export of nitrate, SRP or TP. Nutrient export, specially for NO 3-N and TP, shows significant inter-annual variations, closely linked to inter-annual discharge variations. Flow and load frequency data analysis confirm this association for all the basins on an annual basis. Seasonal or storm specific fluxes strongly deviate from their annual values.
|
| [40] |
A quantitative review of ecosystem service studies: Approaches, shortcomings and the road ahead [J].https://doi.org/10.1111/j.1365-2664.2010.01952.x URL [本文引用: 1] 摘要
1. Ecosystem services are defined as the benefits that humans obtain from ecosystems. Employing the ecosystem service concept is intended to support the development of policies and instruments that integrate social, economic and ecological perspectives. In recent years, this concept has become the paradigm of ecosystem management.2. The prolific use of the term cosystem services in scientific studies has given rise to concerns about its arbitrary application. A quantitative review of recent literature shows the diversity of approaches and uncovers a lack of consistent methodology.3. From this analysis, we have derived four facets that characterise the holistic ideal of ecosystem services research: (i) biophysical realism of ecosystem data and models; (ii) consideration of local trade-offs; (iii) recognition of off-site effects; and (iv) comprehensive but critical involvement of stakeholders within assessment studies.4. These four facets should be taken as a methodological blueprint for further development and discussion. They should critically reveal and elucidate what may often appear to be ad-hoc approaches to ecosystem service assessments.5. Synthesis and applications: Based on this quantitative review, we provide guidelines for further development and discussions supporting consistency in applications of the ecosystem service concept as well as the credibility of results, which in turn can make it easier to generalise from the numerous individual studies.
|
| [41] |
Comparing strengths and weaknesses of three ecosystem services modelling tools in a diverse UK river catchment [J].https://doi.org/10.1016/j.scitotenv.2016.12.160 URL PMID: 28147292 [本文引用: 3] 摘要
Ecosystem services modelling tools can help land managers and policy makers evaluate the impacts of alternative management options or changes in land use on the delivery of ecosystem services. As the variety and complexity of these tools increases, there is a need for comparative studies across a range of settings, allowing users to make an informed choice. Using examples of provisioning and regulating services (water supply, carbon storage and nutrient retention), we compare three spatially explicit tools LUCI (Land Utilisation and Capability Indicator), ARIES (Artificial Intelligence for Ecosystem Services) and InVEST (Integrated Valuation of Ecosystem Services and Tradeoffs). Models were parameterised for the UK and applied to a temperate catchment with widely varying land use in North Wales. Although each tool provides quantitative mapped output, can be applied in different contexts, and can work at local or national scale, they differ in the approaches taken and underlying assumptions made. In this study, we focus on the wide range of outputs produced for each service and discuss the differences between each modelling tool. Model outputs were validated using empirical data for river flow, carbon and nutrient levels within the catchment. The sensitivity of the models to land-use change was tested using four scenarios of varying severity, evaluating the conversion of grassland habitat to woodland (0 30% of the landscape). We show that, while the modelling tools provide broadly comparable quantitative outputs, each has its own unique features and strengths. Therefore the choice of tool depends on the study question.
|
| [42] |
Cross-reference for relating Genetic Soil Classification of China with WRB at different scales [J].https://doi.org/10.1016/j.geoderma.2009.12.017 URL [本文引用: 2] 摘要
Soil classification systems are not consistent between countries or organizations thereby hindering the communication and organizational functions they are intended to promote. World Reference Base for soil resources (WRB) was endorsed and adopted by the International Union of Soil Sciences (IUSS) as the standard for soil correlation and international communication. As a widely used classification system in China, Genetic Soil Classification of China (GSCC) differs from WRB in its underlying understanding about the genetic process. The differences limit communication between Chinese and international soil scientists because there is no standard cross-reference between GSCC and WRB. This paper describes a cross-reference of GSCC to WRB at different scales. The basic soil data set used in the study includes 7292 soil profile data (representative of soil series) collected throughout China. First, a brief history of soil classification in China is provided to familiarize readers with GSCC and its origins. Second, cross-reference at the pedon scale is addressed based on data compiled from 51 monoliths acquired in China by the International Soil Reference and Information Centre (ISRIC) in the 1980s and 1990s. Each of GSCC's 7292 soil series is classified into their equivalent reference soil groups according to the WRB soil reference key. Pedon scale cross referencing is discussed using the database from the Second National Soil Survey of China. Third, the concept and calculation of referencibility is introduced and the process for cross-referencing soil classification systems at national scale is addressed. GIS based analysis generates 60 reference results between GSCC soil great groups and WRB reference group. Results demonstrate that there is great variability in the maximum referencibility between soil great groups of GSCC and WRB soil groups, which ranged from 29.4% to 100%. In terms of the maximum referencibility, it can be divided into three categories: high (80% 100%), intermediate (50% 80%), and low (< 50%). Among the 60 soil great groups of GSCC, 12 could be labeled as high maximum referencibility, 27 categorized as medium maximum referencibility and the remaining 21 are associated with low maximum referencibility. Finally, the main cause of low maximum referencibility is explored and the potential solution to improve cross reference accuracy was proposed.
|
| [43] |
Urban expansion simulation and the spatio-temporal changes of ecosystem services, a case study in Atlanta metropolitan area, USA [J].https://doi.org/10.1016/j.scitotenv.2017.12.062 URL PMID: 29890614 [本文引用: 1] 摘要
Urban expansion can lead to land use changes and, hence, threatens the ecosystems. Understanding the effects of urbanization on ecosystem services (ESs) can provide scientific guidance for land use planning and the protection of ESs. We established a framework to assess the spatial distributions of ESs based on land use changes in the Atlanta Metropolitan area (AMA) from 1985 to 2012. A new comprehensive ecosystem service (CES) index was developed to reflect the comprehensive level of ESs. Associated with the influential factors, we simulated the business as usual scenario in 2030. Four alternative scenarios, including more compact growth (MCG), riparian vegetation buffer (RVB), soil conservation (SC), and combined development (CD) scenarios were developed to explore the optimal land use strategies which can enhance the ESs. The results showed that forest and wetland had the greatest decreases, while low and high intensity built-up lands had the greatest increases. The values of CES and most of ESs decreased significantly due to the sprawling expansion of built-up land. The scenario analysis revealed that the CD scenario performs best in CES value, while it performs the worst in food supply. Compared with the RVB and SC scenarios, MCG scenario is a more optimal land use strategy to enhance the ESs without at the expense of food supply. To integrate multiple ESs into land use planning and decision making, corresponding land management policies and ecological engineering measures should be implemented to enhance: (1) the water yield and water purification in urban core counties, (2) the carbon storage, habitat quality, and recreational opportunity in counties around the core area, and (3) the soil conservation and food supply in surrounding suburban counties. The land use strategies and ecological engineering measures in this study can provide references for enhancing the ESs in the AMA and other metropolitan areas.
|
| [44] |
Linking ecosystem characteristics to final ecosystem services for public policy [J].https://doi.org/10.1111/ele.12389 URL PMID: 25394857 [本文引用: 1] 摘要
Abstract Governments worldwide are recognising ecosystem services as an approach to address sustainability challenges. Decision-makers need credible and legitimate measurements of ecosystem services to evaluate decisions for trade-offs to make wise choices. Managers lack these measurements because of a data gap linking ecosystem characteristics to final ecosystem services. The dominant method to address the data gap is benefit transfer using ecological data from one location to estimate ecosystem services at other locations with similar land cover. However, benefit transfer is only valid once the data gap is adequately resolved. Disciplinary frames separating ecology from economics and policy have resulted in confusion on concepts and methods preventing progress on the data gap. In this study, we present a 10-step approach to unify concepts, methods and data from the disparate disciplines to offer guidance on overcoming the data gap. We suggest: (1) estimate ecosystem characteristics using biophysical models, (2) identify final ecosystem services using endpoints and (3) connect them using ecological production functions to quantify biophysical trade-offs. The guidance is strategic for public policy because analysts need to be: (1) realistic when setting priorities, (2) attentive to timelines to acquire relevant data, given resources and (3) responsive to the needs of decision-makers.
|
| [45] |
Analyzing spatio-temporal changes and trade-offs to support the supply of multiple ecosystem services in Beijing, China [J].https://doi.org/10.1016/j.ecolind.2018.06.049 URL [本文引用: 1] |
| [46] |
Ecological risk assessment of ecosystem services in the Taihu Lake Basin of China from 1985 to 2020 [J].https://doi.org/10.1016/j.scitotenv.2016.02.120 URL [本文引用: 1] |
| [47] |
Assessment of nitrogen reduction by constructed wetland based on InVEST: A case study of the Jiulong River Watershed, China [J].https://doi.org/10.1016/j.marpolbul.2018.05.050 URL [本文引用: 2] |
| [48] |
Improving water quality in China: Environmental investment pays dividends [J].https://doi.org/10.1016/j.watres.2017.04.035 URL PMID: 28431347 [本文引用: 1] 摘要
This study highlights how Chinese economic development detrimentally impacted water quality in recent decades and how this has been improved by enormous investment in environmental remediation funded by the Chinese government. To our knowledge, this study is the first to describe the variability of surface water quality in inland waters in China, the affecting drivers behind the changes, and how the government-financed conservation actions have impacted water quality. Water quality was found to be poorest in the North and the Northeast China Plain where there is greater coverage of developed land (cities+cropland), a higher gross domestic product (GDP), and higher population density. There are significant positive relationships between the concentration of the annual mean chemical oxygen demand (COD) and the percentage of developed land use (cities+cropland), GDP, and population density in the individual watersheds ( p <0.001). During the past decade, following Chinese government-financed investments in environmental restoration and reforestation, the water quality of Chinese inland waters has improved markedly, which is particularly evident from the significant and exponentially decreasing GDP-normalized COD and ammonium (NH 4 + -N) concentrations. It is evident that the increasing GDP in China over the past decade did not occur at the continued expense of its inland water ecosystems. This offers hope for the future, also for other industrializing countries, that with appropriate environmental investments a high GDP can be reached and maintained, while simultaneously preserving inland aquatic ecosystems, particularly through management of sewage discharge.
|

/
| 〈 |
|
〉 |

