胡文燕 , 李梦雅, 黄清雨
HU Wenyan, LI Mengya, HUANG Qingyu
通讯作者:
收稿日期: 2017-07-18
修回日期: 2018-01-10
网络出版日期: 2018-06-28
版权声明: 2018 地理科学进展 《地理科学进展》杂志 版权所有
基金资助:
作者简介:
作者简介:胡文燕(1993-),女,天津人,硕士生,主要从事城市灾害风险研究,E-mail: huwenyan1121@163.com。
展开
摘要
近年来,暴雨内涝频繁发生,常引发严重的城市交通拥堵问题。本文利用自主开发的宏观交通模拟工具,模拟了上海市中心城区50年一遇和100年一遇暴雨强度情景下每条路段的小时交通量,通过计算道路饱和度,研究了不同强度暴雨内涝对中心城区高架出入口和重要道路拥挤程度的影响。结果表明:①100年一遇暴雨内涝对上海市中心城区道路交通服务能力影响显著,可导致7个高架道路出入口关闭,部分出入口严重拥堵;②暴雨内涝对道路拥堵状况影响的差异性明显,变拥挤路段占道路总里程的13.35%,其中一级道路的拥挤程度变化最为明显,如:大连路、武宁路,周家嘴路和长寿路等主要路段服务水平下降。
关键词:
Abstract
In recent years, pluvial flash floods (PFF) have caused serious traffic congestion and disruption in many big cities. This study investigated the traffic congestion pattern due to PFFs in an intra-urban area through a macro traffic simulation method. A macro traffic flow model was built based on trip distribution and the characteristics of roads and routing. We incorporated rainfall data and simulated the hourly traffic volume on each road segment under two PFF scenarios of 50-year and 100-year return periods by the macro traffic flow model. Next, the variation of volume/capacity (V/C) on each road was calculated to derive the spatial pattern of traffic condition under different PFF scenarios. The results were contrasted to demonstrate the change of congestion pattern on the main roads and entrances/exits of the expressways in the city center of Shanghai to analyze the influence of different PFF scenarios on traffic congestion. The results indicate that ①PFFs of 50-year return period may have a marginal effect on the traffic system, but PFFs of 100-year return period can pose great threat to the traffic system in the central urban area of Shanghai. Seven exits and entrances of the expressways are closed due to serious inundation and a large portion of the road network becomes more congested; ②the effect of PFFs on V/C also exhibits spatial disparity over the entire network. Overall, 13.35% of the roads become more congested under 100-year return period. Additionally, the most obvious change of congestion pattern is found on the first-class highways (23.31%), such as Dalian Road, Wuning Road, Zhoujiazui Road, and Changshou Road.
Keywords:
城市暴雨内涝是指发生在短时间内的集中降水,致使城市内产生积水灾害及相关次生灾害的现象(刘家宏等, 2015)。城市交通系统作为承载客货运输及市民出行活动的主要载体,其通畅程度极易受到灾害性天气的影响。城市暴雨强度大,时间集中,往往让交通管理部门和出行者猝不及防,所以极端降雨天气诱发的道路拥堵已成为城市交通管理不可回避的难题。从北京、上海、纽约、伦敦等特大城市所遭受暴雨内涝的影响来看,严重的暴雨内涝会导致交通系统瘫痪,引发诸多交通事故甚至人员伤亡。例如,2012年7月21日,北京市发生特大暴雨,全市平均降水量达170 mm,90余条道路因为严重积水而中断,并且造成了77人死亡,经济损失上百亿元;2013年9月13日下午,一场百年一遇暴雨袭击上海,致使市区80多条道路严重积水,由于短时强降水正值交通高峰时段,故而造成诸多交通线路瘫痪,对市民出行造成了严重影响。因此,暴雨内涝所导致的交通拥堵问题已成为当前城市研究的热点问题。
目前,暴雨内涝对交通影响的研究主要涉及宏观和微观2个方面。在微观尺度的交通模型主要考虑道路、车辆、出行者的细节。如Su等(2016)研究了司机在雨天的驾驶行为,并利用车辆跟驰模型和道路交通模型(SUMO)对北京若干主干道路上的交通拥堵进行了模拟。宏观尺度的交通模型主要将车辆视为流体,研究行驶时间、行驶路径、车流量和密度等。如Tsapakis等(2013)研究了不同暴雨情景(小雨、中雨、大雨)对早中晚不同时间段内的旅行时间影响,结果表明暴雨将导致旅行时间被延长;Mitsakis等(2014)研究了暴雨对交通延误的影响,结果表明暴雨内涝会严重影响城市交通系统,导致车辆路径改变,造成出行时间被延长。以上研究表明,降雨对于城市交通的影响十分显著,但尚存在两方面不足:一是没有明确降雨强度并且降雨强度较小,但是暴雨的突发性、偶然性强,所造成的影响更加严重;二是目前研究只着眼于一条或几条主干道的街区尺度,不能很好地代表整个网络中的交通特征。本文通过宏观交通模拟方法将不同强度的暴雨情景与城市道路网络相结合,识别城市尺度暴雨内涝情景下交通的拥挤程度。
本文以上海市中心城区为研究区,基于自主开发的城市交通模拟工具,将所有车辆视为流体,研究车流量、道路通行能力、道路速度等特性,进而计算不同暴雨重现期下道路的饱和度,以反映城市交通的拥挤程度,研究成果可为交通管理部门以及个人出行提供科学的指导和参考。
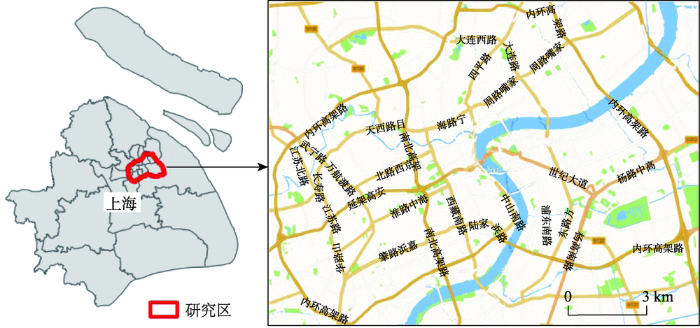
本文研究区为上海市中心城区内环快速路以内区域(图1)。该区域总面积约为120 km2,海拔约3.0~3.5 m,区域排涝能力较弱,受暴雨内涝影响频繁。该区域社会经济活跃,交通网络密集,道路类型复杂,已形成了以快速路和主干道路为骨架的城市道路网络。近年来,该区域居民出行量日益增加,交通供需不平衡问题突出,尤其是在早晚高峰时段和灾害性天气条件下,道路的服务水平下降明显。
本文使用了研究团队开发的《城市暴雨内涝灾害危险性模拟工具》来构建暴雨内涝危险性情景(董军刚, 2014; 黄清雨等, 2016; Huang et al, 2017; 费茉莉等, 2017)。该工具采用上海暴雨强度公式和芝加哥雨型计算特定情景的降雨过程,公式如下:
式中:i为降雨强度;t为降雨历时;a、b、c为暴雨公式参数。
其次,采用适合上海地区的SCS-CN 降雨径流模型,进行暴雨内涝产流模拟,公式如下:
式中:P为降雨量;Q为净雨量,即径流量;S′为流域饱和储水量。
因不易直接获得S',故引入Curve Number(CN)参数,公式如下:
式中:CN值是无量纲参数,与土壤质地、土地利用方式和降雨前土壤湿润状况有关。
接下来,使用水动力模型对内涝汇流进行模拟,描述暴雨内涝汇流过程的圣维南方程组由连续方程和动量方程组成,公式如下:
式中:h为内涝积水深度;t为时间;Qx、Qy分别为x、y方向上的单宽流量;re为暴雨产流。
动量方程公式为:
式中:u、v为x、y方向上的平均流速;g为重力加速度;S0x、S0y为x、y方向上的坡度比降;Sfx、Sfy为x、y方向上的摩阻比降。
利用该工具,本文以2012年为目标年份,获得了上海市中心城区遭遇50年和100年一遇强降雨时的最大积水信息。
城市道路网络是车辆行驶的载体,所以道路数据是交通模拟的基础。上海市中心城区道路情况复杂,单行路居多,并且外围和内部穿插着高架道路,交通流量大,车速情况复杂。在交通模拟过程中,每一辆车都需要按照一定规则在道路上行驶,其中道路的等级、车道数量等都会影响车辆的行驶状态,所以要完善道路信息,包括:道路名称、道路等级、路段编码、车道数量、路段长度、单双行和道路车速。
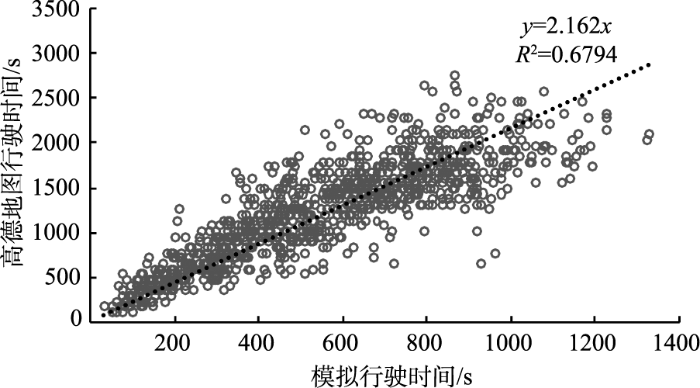
本文根据OpenStreetMap将研究区道路分为5类:快速路、主干道路、一级道路、二级道路、支路。根据道路的等级,确定每条路段的车道数量和车辆限速(陈小鸿, 2004)。但在真实情况下,车辆不可能以限定车速行驶,所以应对行驶时间进行必要的校正。高德地图作为中国应用最广的数字地图导航和位置服务平台之一,具有强大的路径搜索功能,并且路径规划考虑了实际路况,为用户的出行提供了接近真实情况的指导。为此,选取了1000对起始地(O)和目的地(D),使用高德地图的行驶时间对模拟的行驶时间进行了矫正,结果表明,模拟的行驶时间和高德地图提供的行驶时间的线性关系良好(图2)。因此,本文根据行驶时间的线性拟合得到的公式,对速度进行校正,公式为:
图2 模拟行驶时间与高德地图行驶时间的关系
Fig.2 The relationship of the travel time based on traffic simulation and the real travel time based on Amap
式中:V为矫正后的速度;V0为限速。结果如表1所示。
表1 道路类型的限速与校正后车速
Tab.1 The limiting-velocity and the calibrated velocity of different road types
| 快速路/ (m/s) | 主干道路/(m/s) | 一级道路/(m/s) | 二级道路/(m/s) | 支路/ (m/s) | |
|---|---|---|---|---|---|
| 道路限速 | 22.22 | 16.67 | 13.89 | 11.11 | 8.33 |
| 校正车速 | 10.27 | 7.71 | 6.42 | 5.14 | 3.85 |
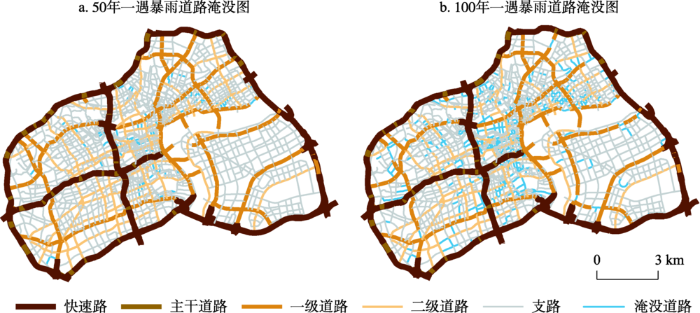
为模拟在暴雨天气下的交通情况,还需对道路网络数据和暴雨内涝信息进行整合。小客车排气筒离地高度约为25~35 cm,一旦积水深度超过此高度,极易导致车辆熄火(Yin et al, 2017);中国部分城市排水防涝应急响应(如北京市、河北省等)也有规定,当道路积水深度超过30 cm时,应及时设立警示标志,提醒车辆和行人谨慎通行,甚至进行必要的交通管制,封闭该路段(黄清雨, 2017)。本文利用ArcGIS软件将不同暴雨重现期下的最大积水深度图与研究区的路网数据进行叠加,删除积水深度大于30 cm的路段(图3),为后续交通模拟做好准备。需要说明的是,由于50年和100年一遇强降雨较少见,交通影响数据较难收集,研究仅针对10年一遇的暴雨进行了车流量验证,结果较为可靠(黄清雨, 2017)。
图3 各重现期下道路淹没图
Fig.3 Simulated flooded roads caused by rainfall of 50-year and 100-year return periods
由于城市内部不同区域的经济发展水平和功能定位不同,因此,不同区域居民的出行特征也不相同,表现出各交通小区之间的出行分布有所差别。本文根据《上海市综合交通年度报告(2015年)》中的上海市小客车出行分布图(图4),将研究区根据交通干道分为6个交通小区。交通小区之间的出行量根据上海市小客车出行量分布图按比例设计,从而得到区域之间的出行量特征比例表(表2)。
图4 上海市小客车区域间出行量等级图①(① A-F为交通小区名称。等级I为该区域间的出行量占总出行量的0.56%;等级II为该区域间的出行量占总出行量的1.12%;等级III为该区域间的出行量占总出行量的1.68%;等级IV为该区域间的出行量占总出行量的2.23%;等级V为该区域间的出行量占总出行量的2.79%。)
Fig.4 Travel volume grade of car trips between distinct regions in Shanghai
表2 区域间出行量占总出行量百分比表/%
Tab.2 The proportion of the travel volume between distinct regions/%
| A | B | C | D | E | F | OUT | |
|---|---|---|---|---|---|---|---|
| A | 1.12 | 2.23 | 1.40 | 0.56 | 1.96 | 2.79 | 2.23 |
| B | 2.23 | 1.12 | 1.12 | 1.40 | 1.96 | 2.23 | 2.23 |
| C | 1.40 | 1.12 | 1.12 | 1.68 | 1.68 | 1.68 | 5.03 |
| D | 0.56 | 1.40 | 1.68 | 1.12 | 1.68 | 1.68 | 0.56 |
| E | 1.96 | 1.96 | 1.68 | 1.68 | 1.12 | 2.79 | 5.03 |
| F | 2.79 | 2.23 | 1.68 | 1.68 | 2.79 | 1.12 | 4.47 |
| OUT | 2.23 | 2.23 | 5.03 | 0.56 | 4.47 | 4.47 | 1.12 |
根据《上海市综合交通年度报告(2015年)》中提供的分区域交通统计数据和机动车占比,对研究区内的机动车出行量进行了估算,并通过多次试验,最终模拟了48500对起始地(O)和目的地(D)的路径。为反映不同时段的交通量,每对OD点分别代表0.75、1.00、1.25、1.50、1.75、2.00、2.25和2.50 pcu(passenger car unit)。根据研究表明,由于极端天气影响而导致平均工作日交通活动的变化不超过3%(Hassan et al, 1999),所以本文忽略了出行量受极端天气的影响,即暴雨情景与晴天情景的出行量相同。为消除研究单元粒度效应的影响,本文采用位置明确的出发地和目的地点数据,而非交通分析小区来表征研究区内部的出行分布。出发地和目的地根据蒙特卡洛模拟方法进行随机配对(Hu et al, 2015),所有车辆在1小时的模拟时间内以校正后的自由流车速随机出发。
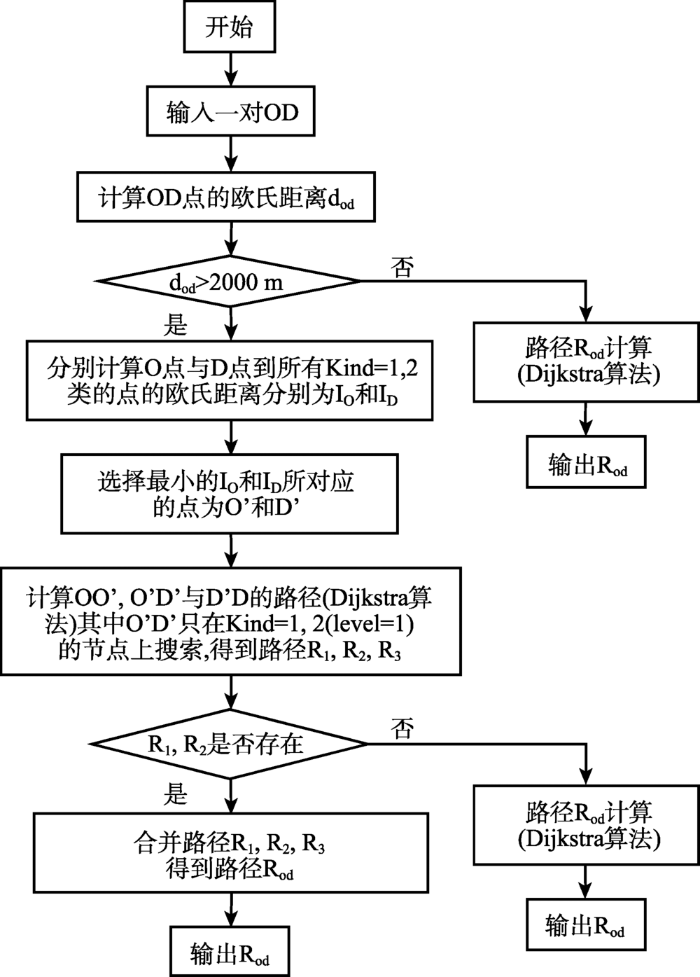
寻找最短路径问题是图论中寻找两点间最短路径的经典问题。本文中,最短路径算法主要用于计算车辆路径。在日常研究中,最短路径指空间距离上的最短、时间最短、费用最小或容量最小等。每种最短路径算法在应用范围、时间复杂度和空间复杂度等方面各有特色(陆锋, 2001)。城市道路网络相比于一般的图,具有一定的特殊性,如:道路网络是稀疏图,与同一个节点所连接的边的数量一般不超过5;道路网络具有层次性,快速路比一般道路重要(张波良等, 2014)。当起终点距离比较近的时候,驾驶者往往只考虑时间最短而忽略道路等级高低;但当起终点距离较远时,驾驶者更倾向于按照道路层次优先原则出行。由于研究区的路网复杂多样,为准确地刻画驾驶员的一般行为,本文以时间为路径权重,选择基于道路等级的堆优化Dijkstra算法寻找路径(图5)。考虑道路层次的路径规划任务主要分解为2步:第一步在主要路网上进行路径计算,路径计算结果只包含主干道信息;第二步在次要道路网上完成路径计算,路径计算结果为从起终点到达主干道的最短路径(张林, 2008)。为实现上述路径搜索目的,必须对路网进行分级处理,本文根据道路等级将道路分为2类(L1,L2):快速路、主干道路和一级道路为L1,二级道路和次干道路为L2。为计算从起终点到达主干道的最短路径,还要将节点进行分类,建立网络拓扑,L1路段与L1路段相交的节点类别为1,L1路段与L2路段相交的节点类别为2,L2与L2路段相交的节点类别为3。
图5 基于道路等级的Dijkstra算法寻找路径流程图
Fig.5 Flow diagram of Dijkstra-routing algorithm based on road levels
(1) 行驶里程、速度、时间验证
在道路数据预处理过程中,为保证模拟结果符合真实情况,我们将车速进行了校准。为验证交通模拟中的车辆行驶里程、速度、时间,本文选择晴天情景下的1000条路径,以路径的起点和终点作为出发地和目的地,在高德地图中搜索对应的路径,并记录搜索结果,包括路径长度和行驶里程(黄清雨, 2017)。高德地图一次给出的参考路径往往有多条,本文仅选择与模拟结果最接近的路径,将其与晴天情况下交通模拟所得到的行驶里程、速度、时间进行对比,结果表明(表3):校正后的行驶里程、速度、时间较为可靠,符合实际情况。
表3 基于高德地图的实际车速与模拟行驶里程、车速、时间对比
Tab.3 The comparison of traveled distance, traveled time and traveled speed based on Amap
| 行驶路程/m | 行驶时间/s | 行驶速度/(m/s) | |
|---|---|---|---|
| 高德地图_平均值 | 8236.17 | 1255.77 | 6.56 |
| 模拟_平均值 | 9021.22 | 1187.65 | 7.60 |
(2) 晴天重要路口车流量模拟结果验证
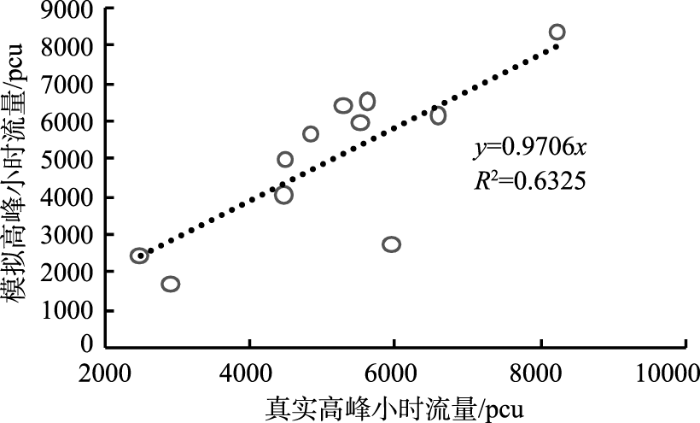
为检验城市交通模拟的结果,本文选用《上海市综合交通年度报告(2015年)》中的地面道路工作日时变特征和交叉路口高峰小时流量,对研究区内11个重要交通路口进行验证。对比了研究区11个路口(长宁路/江苏路、江苏路/延安西路、成都北路/北京西路、四平路/大连路、四平路/曲阳路、江宁路/长寿路、恒丰路/天目西路、西藏北路/海宁路、河南北路/海宁路、大连路/周家嘴路、成都北路/延安中路)模拟交通流量总量与晴天情景下实际交通流总量,发现每对OD点代表0.75、1.25、1.75、2.00和2.50 pcu(passenger car unit)分别对应工作日的6:00、22:00、12:00、10:00或16:00、8:00或18:00(表4)。本文重点研究暴雨内涝对高峰小时流量的影响,即每对OD点代表2.5 pcu,研究区内总交通量为121250 pcu,经过与实际晴天情景下的高峰小时流量对比验证,R2=0.6325,线性关系良好(图6),也说明本文的城市宏观交通模拟方式较为可靠。
表4 晴天情景下实际与模拟道路路口交通量对比
Tab.4 The comparison of the real turning traffic volume and simulated turning traffic volume under sunny scenario
| 时间 | 验证路口模拟小时 交通总量/pcu | 验证路口实际小时 交通总量/pcu |
|---|---|---|
| 6:00 | 16369 | 11104 |
| 8:00 | 54570 | 56445 |
| 10:00 | 43660 | 43490 |
| 12:00 | 38197 | 37938 |
| 16:00 | 43660 | 43490 |
| 18:00 | 54570 | 56445 |
| 22:00 | 27282 | 27760 |
图6 研究区11个路口实际与模拟高峰小时流量关系图
Fig.6 The real and simulated flow of meteors per hour based 11 turnings in the rush hour
由于暴雨内涝造成部分道路积水甚至被关闭,使得其他部分道路的交通承载压力增加,会导致大部分道路变得拥堵,所以研究道路的拥堵程度变得至关重要。交通拥堵是指交通需求超过某条道路的交通容量时,部分交通滞留在道路上的一种交通现象(郭泽斌等, 2013)。拥挤程度的划分受到多种因素影响,所以在评价过程中十分困难。本文在宏观尺度上研究交通的拥堵程度,所以使用饱和度的数值作为评价道路拥挤程度的指标。饱和度(V/C)的值主要取决于2个方面:交通量(V)与通行能力(C)。
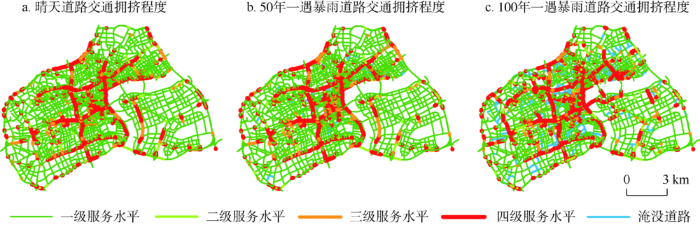
中国一般根据饱和度值将道路拥挤程度、服务水平分为以下4个等级(沈颖等, 2007):①一级服务水平:0≤V/C<0.6,道路交通顺畅、服务水平好;②二级服务水平:0.6≤V/C<0.8,道路稍有拥堵,服务水平较高;③三级服务水平:0.8≤V/C<1.0,道路拥堵,服务水平较差;④四级服务水平:V/C>1.0,道路严重拥堵,服务水平极差。本文交通量和通行能力所在的时间段统一为小时交通量。通过对不同情景下的交通模拟得到高峰时期的交通量;再根据《城市道路设计规范(CJJ37-2012)》得到每一条路段的通行能力;最后计算每一条路段的饱和度值,并根据以上标准进行分类(图7)。
图7 各重现期情景下道路交通拥堵程度
Fig.7 Traffic congestion level under different rainfall scenarios
4.2.1 暴雨天气对高架出入口拥堵程度的影响
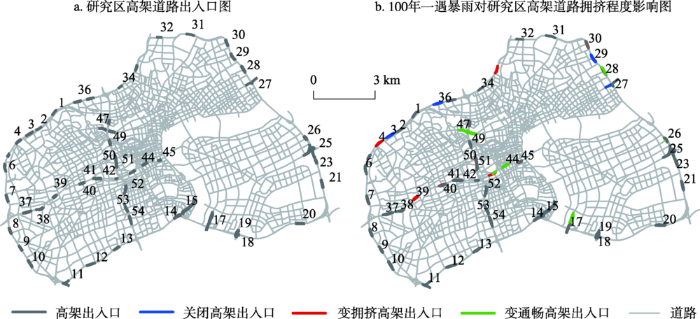
随着城市交通网络的不断扩张,高架道路已成为许多城市的交通大动脉。极端降雨对高架道路交通会产生一定影响,使高架道路交通系统在暴雨天气下瘫痪,尤其是在高架道路出入口处,由于车道少并且车流量大,更易发生拥堵(王笑, 2015)。如图8所示,研究区内共有106个高架出入口,其中内环高架出入口多达67个,且受暴雨内涝影响最为严重。根据研究区高架出入口特点,分析50年一遇和100年一遇暴雨重现期下的道路积水情况,发现50年一遇暴雨对高架出入口的影响较小,但是100年一遇暴雨会造成超过10%的内环高架出入口的积水超过30 cm,导致7个路段关闭(出入口3、入口27、出入口29、出口35、入口36)。故本文主要分析百年一遇的暴雨天气对高架道路出入口交通流量特性的影响。
图8 研究区内高架道路出入口及受100年一遇暴雨影响图
Fig.8 The exit and entrance of expressway and it caused by 100-year rainfall scenarios in study areas
对比晴天和百年一遇降雨天气下高架道路出入口的饱和度变化,发现百年一遇降雨天气下部分出入口的饱和度有所增加,即道路服务能力降低;而部分出入口的饱和度却有所降低,即道路服务能力增加(表5)。由表5可以看出,一些出入口的关闭可能会导致邻近出入口的车流量增加,使得部分路段变得拥堵,如出入口3和出口35、入口36的关闭,由于其他出入口要对其进行分流,会增加出入口4和出入口33的承载能力,使其服务能力下降。此外,延安高架和南北高架交口处的高架出入口饱和度变化明显,由于黄浦区老城区的地势低平,对洪涝的响应能力较差,暴雨情景下多路段积水,导致地面交通无法通行,所以高架的承载能力将会增加,致使出口43、入口50的饱和度增加。
表5 高架道路出入口拥堵程度变化表
Tab.5 The change of the congestion level of the exit and entrance of expressway
| 出入口 代号 | 变拥堵的高架出入口 | 出入口 代号 | 变顺畅的高架出入口 | ||
|---|---|---|---|---|---|
| 晴天饱和度 | 100年一遇暴雨饱和度 | 晴天饱和度 | 100年一遇暴雨饱和度 | ||
| 入口4 | 0.13 | 1.11 | 入口16 | 0.38 | 0.13 |
| 入口30 | 0.69 | 0.91 | 入口43 | 1.83 | 1.58 |
| 入口33 | 1.77 | 2.31 | 入口44 | 0.56 | 0.36 |
| 入口39 | 1.44 | 1.92 | 入口47 | 1.73 | 1.19 |
| 入口46 | 2.19 | 2.94 | 入口48 | 1.16 | 0.93 |
| 入口50 | 1.11 | 1.44 | 出口16 | 0.40 | 0.12 |
| 出口4 | 0.05 | 0.46 | 出口23 | 2.68 | 0.00 |
| 出口33 | 0.59 | 0.95 | 出口28 | 0.55 | 0.34 |
| 出口39 | 2.12 | 2.41 | 出口44 | 0.77 | 0.32 |
| 出口40 | 2.13 | 2.51 | 出口47 | 1.31 | 0.60 |
| 出口43 | 0.40 | 0.65 | 出口48 | 1.47 | 1.19 |
4.2.2 暴雨天气对主要道路拥堵程度的影响
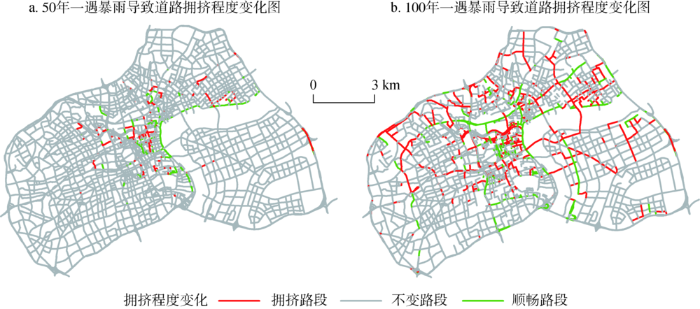
暴雨内涝除对高架道路的出入口造成直接影响外,也会对城市的地面层的主要道路造成一定影响。本文将不同暴雨强度情景下与晴天情景下的各个等级道路的拥挤程度进行对比,将饱和度差值大于0.2和小于-0.2的路段作为变拥挤的路段和变通畅的路段。由图9可以看出,50年一遇的暴雨对道路拥挤程度的影响较小,主要集中在地势低洼的黄浦区北部区域,但是百年一遇的暴雨会导致道路网络整体的服务能力下降,变拥挤和变通畅的路段占道路总里程的百分比分别为13.35%和7.20%。其中,变拥挤和变通畅的主干道路占总主干道路里程的百分比分别为5.42%和4.95%;变拥挤和变通畅的一级道路占总一级道路里程的百分比分别为23.31%和33.12%;变拥挤和变通畅的二级道路占总二级道路里程的百分比分别为16.96%和4.69%;变拥挤和变通畅的支路占总支路里程的百分比分别为13.11%和2.78%。根据司机驾驶特点,司机车辆驾驶过程中一般会选择等级高的道路,所以晴天情景下主干道路和一级道路的拥挤现象最严重。遇到极端降雨时,由于高架道路可进行一部分的车辆分流,所以主干道路只有部分路段的拥挤程度发生变化,如成都北路的北段和中段服务能力下降,延安东路中段服务能力上升;但一级道路的拥挤程度变化十分明显,如大连路、武宁路、周家嘴路和长寿路等部分路段会变得明显拥堵,陆家浜路、四平路和杨树浦路等部分路段却会变得顺畅。
(1) 针对城市道路网络的特点,建立了不同暴雨情景下的城市宏观交通模拟方法,包括道路信息整合,出行量预测与分布和寻径算法设计3部分。根据城市暴雨内涝模拟的最大水深结果整合道路网络信息,通过上海市小客车出行分布图合理分配OD点,采用Dijkstra算法搜索路径;通过城市交通模拟得到不同暴雨强度下每条路段的车流量,并对晴天情境下的车流量、速度等结果进行了验证;根据每条路段的车流量计算了道路的饱和度,进而识别了城市道路网络的拥挤程度。
(2) 本文分析了不同重现期的暴雨内涝对城市道路拥挤程度的影响,结果表明:50年一遇的暴雨内涝对研究区内的道路影响程度不大,但是100年一遇的暴雨内涝对城市快速路出入口、主干路的影响十分明显,导致内环高架大于10%的出入口关闭,部分出入口严重拥堵;另外,100年一遇的暴雨内涝对一些重要道路的影响也十分显著,变拥挤的路段占道路总里程的百分比为13.35%,其中,一级道路的拥挤程度变化最为明显,变拥挤的一级道路占一级道路总里程的百分比为23.31%。
(3) 本文虽然实现了城市尺度上的道路交通模拟,并进一步计算了道路拥挤程度,但对因拥挤程度变化所导致的车速变化以及司机驾驶行为的变化方面还考虑不够。此外,由于缺乏50年一遇、100年一遇的交通影响数据,本文仅针对10年一遇的暴雨进行了车流量验证,对50年一遇和100年一遇的高强度暴雨内涝对交通的影响未进行验证,后续应进一步加强验证。
The authors have declared that no competing interests exist.
| [1] |
上海城市道路分级体系研究 [J].Research on classification system of urban roads in Shanghai [J]. |
| [2] |
城市暴雨内涝灾害风险评估工具集开发与应用研究: 以上海市为例 [D].Research on development and application of urban rainstorm waterlogging disaster risk assessment toolset: A case study of Shanghai [D]. |
| [3] |
城市暴雨内涝模拟模型优化与精度验证 [J].https://doi.org/10.3724/SP.J.1047.2017.00895 URL [本文引用: 1] 摘要
本文采用“Vegetation-Impervious Surface-Soil”模型和线性光谱混合分解方法,获取像元中不透水面、植被、土壤覆盖信息,用于计算SCS模型产流参数综合CN(Curve Number)值;基于土地利用类型,采用经验值与数值实验逐步求精相结合的方法,确定水动力汇流模型参数曼宁系数,并用实测积水数据验证两次参数修正的模拟效果。以上海中心城区为例进行验证,研究结果表明:(1)将采用V-I-S模型得到的不透水面、植被、土壤信息设定CN值,能够降低积水分布的极值化现象,提高SCS产流模型产流量和产流分布精度;(2)采用经验法和数值模拟逐步求精法,按土地利用类型设定曼宁系数,使各时段最大积水深度高于原模型,说明曼宁系数是汇流模型的敏感参数。
Optimization and verification of a novel hydrodynamic model for urban flood simulation [J].https://doi.org/10.3724/SP.J.1047.2017.00895 URL [本文引用: 1] 摘要
本文采用“Vegetation-Impervious Surface-Soil”模型和线性光谱混合分解方法,获取像元中不透水面、植被、土壤覆盖信息,用于计算SCS模型产流参数综合CN(Curve Number)值;基于土地利用类型,采用经验值与数值实验逐步求精相结合的方法,确定水动力汇流模型参数曼宁系数,并用实测积水数据验证两次参数修正的模拟效果。以上海中心城区为例进行验证,研究结果表明:(1)将采用V-I-S模型得到的不透水面、植被、土壤信息设定CN值,能够降低积水分布的极值化现象,提高SCS产流模型产流量和产流分布精度;(2)采用经验法和数值模拟逐步求精法,按土地利用类型设定曼宁系数,使各时段最大积水深度高于原模型,说明曼宁系数是汇流模型的敏感参数。
|
| [4] |
城市道路拥堵程度评判方法研究 [J].https://doi.org/10.3969/j.issn.1002-4786.2013.11.020 URL [本文引用: 1] 摘要
对城市道路拥堵程度进行科学的评判可以为人们的出行和交管部门的决策提供指导。采用平均行程速度和交通饱和度这两个交通流参数作为道路拥堵程度的评判指标,首先设计了获取平均行程速度和交通饱和度的方法,然后应用模糊算法对评判指标和拥堵程度进行量化,建立了相应的隶属度函数与模糊判断规则体系,设计了城市道路拥堵程度的评判方法,最后结合实例进行分析。
Evaluation method of city road congestion degree [J].https://doi.org/10.3969/j.issn.1002-4786.2013.11.020 URL [本文引用: 1] 摘要
对城市道路拥堵程度进行科学的评判可以为人们的出行和交管部门的决策提供指导。采用平均行程速度和交通饱和度这两个交通流参数作为道路拥堵程度的评判指标,首先设计了获取平均行程速度和交通饱和度的方法,然后应用模糊算法对评判指标和拥堵程度进行量化,建立了相应的隶属度函数与模糊判断规则体系,设计了城市道路拥堵程度的评判方法,最后结合实例进行分析。
|
| [5] |
暴雨内涝影响下城市交通动态模拟工具的开发与应用: 以上海市黄浦区为例 [D].Development of a toolset for modeling the urban traffic flow with influence of pluvial flooding: A case study for Huangpu District in Shanghai [D]. |
| [6] |
暴雨内涝危险性情景模拟方法研究: 以上海中心城区为例 [J].https://doi.org/10.3724/SP.J.1047.2016.00506 Magsci [本文引用: 1] 摘要
<p>本文采用地理信息系统技术(GIS)与水文/水动力学相结合的方法,使用修正的SCS模型进行产流模拟,利用局部等体积法和水动力模型进行汇流模拟,建立了基于情景的城市暴雨内涝危险性模拟工具,并对相同雨强情景下不同汇流模型的模拟结果与精度进行了对比分析。结果表明:(1)局部等体积法计算简单,对降雨的时程分配较为敏感,峰前历时和雨强对结果影响显著,较适合于雨型确定的城市暴雨内涝危险性快速模拟;水动力模型计算复杂,与整个降雨历时存在明显关系,模拟精度较高。(2)利用台风“麦莎”带来强降雨导致的积水实测数据,对模拟结果进行对比和验证,表明本文建立的水动力模型法模拟结果与实测降雨积水更为接近,更适合上海中心城区暴雨内涝危险性情景模拟。</p>
Research on the scenario simulation method of rainstorm waterlogging hazard: A case study in the central urban area of Shanghai [J].https://doi.org/10.3724/SP.J.1047.2016.00506 Magsci [本文引用: 1] 摘要
<p>本文采用地理信息系统技术(GIS)与水文/水动力学相结合的方法,使用修正的SCS模型进行产流模拟,利用局部等体积法和水动力模型进行汇流模拟,建立了基于情景的城市暴雨内涝危险性模拟工具,并对相同雨强情景下不同汇流模型的模拟结果与精度进行了对比分析。结果表明:(1)局部等体积法计算简单,对降雨的时程分配较为敏感,峰前历时和雨强对结果影响显著,较适合于雨型确定的城市暴雨内涝危险性快速模拟;水动力模型计算复杂,与整个降雨历时存在明显关系,模拟精度较高。(2)利用台风“麦莎”带来强降雨导致的积水实测数据,对模拟结果进行对比和验证,表明本文建立的水动力模型法模拟结果与实测降雨积水更为接近,更适合上海中心城区暴雨内涝危险性情景模拟。</p>
|
| [7] |
|
| [8] |
最短路径算法: 分类体系与研究进展 [J].Shortest path algorithms: Taxonomy and advance in research [J]. |
| [9] |
道路饱和度计算方法研究 [J].https://doi.org/10.3869/j.issn.1002-4786.2007.01.042 URL [本文引用: 1] 摘要
道路饱和度是研究和分析道路交通服务水平的重要指标,但目前人们仍比较简单地用V/C来计算饱和度,未能根据各类不同道路的标准进行计算.尤其是公路和城市道路,其计算方法并不一致,应根据不同的情况,采用不同的方法进行计算。
Research on calculation method for road saturation [J].https://doi.org/10.3869/j.issn.1002-4786.2007.01.042 URL [本文引用: 1] 摘要
道路饱和度是研究和分析道路交通服务水平的重要指标,但目前人们仍比较简单地用V/C来计算饱和度,未能根据各类不同道路的标准进行计算.尤其是公路和城市道路,其计算方法并不一致,应根据不同的情况,采用不同的方法进行计算。
|
| [10] |
暴雨天气下城市快速路交通流特性研究 [D].Research on the impact of torrential rain on traffic flow characteristics of expressways [D]. |
| [11] |
道路网上最短路径算法综述 [J].A survey on shortest path algorithms in road networks [J]. |
| [12] |
动态车辆导航系统车道级路径引导方法研究 [D].Research on lane level route guidance methods for dynamic vehicle navigation system [D]. |
| [13] |
The impact of unseasonable or extreme weather on traffic activity within Lothian region, Scotland [J].https://doi.org/10.1016/S0966-6923(98)00047-7 URL [本文引用: 1] 摘要
Little has been reported on the variation in traffic activity with either unseasonable or extreme weather conditions. This paper reports on an investigation into such relationships for the former Lothian Region (now split into four administrative districts), in Scotland.Daily traffic activity together with meteorological data was gathered for the period between 1987 and 1991. This data was used to develop a simple model to predict traffic activity based on yearly, monthly and daily variations. A similar model was developed to predict meteorological variables based on monthly variations. The differences in the observed and predicted values were used in the 50% test to determine whether or not unseasonable weather was linked to changes in traffic activity. The changes in the average weekday traffic activity, although significant, were less than 3% for unseasonable sunshine hours, maximum temperature, minimum temperature and rainfall. However at weekends there were reductions of more than 4% in the average traffic activity on both the days with the highest rainfalls and the days with lower than expected minimum temperatures.Similar comparisons were made to determine whether or not there were links between traffic activity and extreme weather conditions. There were similar slight but significant changes in average weekday traffic activity with the extremes of rainfall, sunshine hours, maximum temperature and minimum temperature. However there was an average reduction of 10% in weekday traffic activity when snow was lying. At weekends there was an average reduction of 4% in traffic activity on the days with the highest rainfall and an average reduction of 15% on the days when snow was lying.
|
| [14] |
Decomposing excess commuting: A Monte Carlo simulation approach [J].https://doi.org/10.1016/j.jtrangeo.2015.03.002 URL [本文引用: 1] 摘要
Excess or wasteful commuting is measured as the proportion of actual commute that is over minimum (optimal) commute when assuming that people could freely swap their homes and jobs in a city. Studies usually rely on survey data to define actual commute, and measure the optimal commute at an aggregate zonal level by Linear Programming (LP). Travel time from a survey could include reporting errors and respondents might not be representative of the areas they reside; and the derived optimal commute at an aggregate areal level is also subject to the zonal effect. Both may bias the estimate of excess commuting. Based on the 2006 2010 Census for Transportation Planning Package (CTPP) data in Baton Rouge, Louisiana, this research uses a Monte Carlo approach to simulate individual resident workers and individual jobs within census tracts, estimate commute distance and time from journey-to-work trips, and define the optimal commute based on simulated individual locations. Findings indicate that both reporting errors and the use of aggregate zonal data contribute to miscalculation of excess commuting.
|
| [15] |
Modeling the influence of urbanization on urban pluvial flooding: A scenario-based case study in Shanghai, China [J].https://doi.org/10.1007/s11069-017-2808-4 URL [本文引用: 1] 摘要
Abstract Rapid urbanization has brought great productivity, prosperity and challenges to Shanghai in the last few decades. This paper focuses on the influence of urbanization on urban pluvial flooding, which frequently occurs and causes severe losses, especially in the central urban areas. We quantitatively evaluate the flood risk using scenario simulation methods. The involved scenarios were designed by incorporating two environmental variables (land subsidence and land use/land cover (LULC) change), three time points (2000, 2006 and 2012) and four degrees of rainfall magnitude, with 5-, 10-, 50- and 100-year return periods, respectively. A toolset was developed to model the hydrodynamic process of pluvial flooding in each scenario. The inundation area and average depth were selected as metrics to estimate the severity of flooding, and the corresponding F statistic and root-mean-square deviation were employed to quantify the inundation changes with the impact of all variables. Results suggest that the impacts of land subsidence and LULC change are a function of rainfall magnitude and display a spatial disparity across the entire study area. LULC change is the key factor contributing to the flood risk, which largely affects the inundation extent at a regional scale. Nonetheless, the effects of different land use types are distinctive. The inundation intensifies within industry and transportation land uses and alleviates within green space and waters. Furthermore, except for a slight change captured in the local water depth, the overall flood risk is less sensitive to the impact of land subsidence with varying rainfall magnitudes when compared to the LULC change.
|
| [16] |
Impacts of high-intensity storms on urban transportation: Applying traffic flow control methodologies for quantifying the effects [J].https://doi.org/10.1007/s13762-014-0573-4 URL [本文引用: 1] 摘要
Urban flooding is becoming increasingly destructive in the Mediterranean region as more and more urban infrastructure and socioeconomic activities are exposed to flood risk. The metropolitan area of Athens, Greece, is no exception to this flood-prone regime, presenting a rich record of flood events during the last century. On February 22, 2013, a high-intensity storm that lasted 7 h hit Athens, severely impacting the transportation sector, hindering vehicle circulation and the overall performance of the road network. This paper studies the impacts of high-intensity storms in urban areas by examining the effects of the February 2013 Athens storm and the resultant flood event. Its novelty lies in the impacts quantification approach, applying cutting-edge traffic flow control methodologies in the form of macroscopic fundamental diagrams. It quantifies the storm impacts on vehicular traffic in terms of operational disruptions during the event, by analyzing various traffic-related indicators, such as travel time, delays, speed drop and re-routing of vehicles, using data from the Athens traffic management center and urban freight vehicle fleets. Results show increased travel times, significant changes in routing and substantial speed drops, highlighting the disruptive effects of the flooding event on traffic. The importance of developing a qualitative and quantitative understanding of the effects of such events in urban areas is particularly high, considering the context of the changing climate and the increasing frequency and intensity of extreme weather events.
|
| [17] |
Integrated simulation method for waterlogging and traffic congestion under urban rainstorms [J].https://doi.org/10.1007/s11069-015-2064-4 URL [本文引用: 1] 摘要
Heavy rainstorms are increasingly frequent events in urban areas. Urban rainstorms lead to road waterlogging and low visibility, which affect drivers’ behavior and can thus cause traffic congestion and potential accidents. It is important to study the mechanisms of waterlogging and traffic congestion caused by rainstorms to more effectively predict them and reduce losses. In this paper, an integrated simulation method to analyze the influence of urban rainstorms on waterlogging and traffic congestion was developed. Firstly, waterlogging simulation was conducted to predict the spatiotemporal distribution of water depth on roads based on an urban storm water model. Secondly, psychological questionnaires were distributed to study the drivers’ behavior during a rainstorm. Based on the psychological questionnaires’ results, the vehicles’ speed was estimated under different water depth and visibility conditions. Finally, a microscopic traffic simulation was carried out to predict the traffic condition using the results of the previous two parts. Case studies were conducted on a simplified road model. The effects of different parameters on waterlogging and traffic congestion were analyzed. Then the method was applied to an actual urban area in Beijing, and a detailed waterlogging situation and traffic situation were obtained. Alternate future scenarios of adding drains to mitigate waterlogging and traffic congestion during heavy rainstorms were simulated, and the method’s potential to assist in decision making for urban drainage system design was shown. The integrated simulation method is helpful for early warning and risk management of urban rainstorms on waterlogging and traffic congestion. Copyright Springer Science+Business Media Dordrecht 2016
|
| [18] |
Impact of weather conditions on macroscopic urban travel times [J].https://doi.org/10.1016/j.jtrangeo.2012.11.003 URL [本文引用: 1] 摘要
Weather conditions may significantly impact a series of everyday human decisions and activities. As a result, engineers seek to integrate weather-related data into traffic operations in order to improve the current state of practice. Travel times and speeds are two of the elements of a transportation system that may be greatly affected by the weather resulting in deterioration of roadway network performance. This study aims to investigate the impact of different intensities of rain, snow and temperature levels on macroscopic travel times in the Greater London area (UK) during the period 1 October–10 December 2009. The analysis was carried out for three 2-h periods on weekdays during the morning, afternoon and evening periods. Automatic Number Plate Recognition (ANPR) data obtained from more than 380 travel links are used in the analysis. The main finding is that the impact of rain and snow is a function of their intensity. Specifically, the ranges of the total travel time increase due to light, moderate and heavy rain are: 0.1–2.1%, 1.5–3.8%, and 4.0–6.0% respectively. Light snow results in travel time increases of 5.5–7.6%, whilst heavy snow causes the highest percentage delays spanning from 7.4% to 11.4%. Temperature has nearly negligible effects on travel times. It was also found that the longer links within outer London generally yield greater travel time decreases than those in inner London, and even higher decreases than the shortest links in central London. This research provides planners with additional information that can be used in traffic management to modify planning decisions and improve the transportation system control on a network scale under different weather conditions. In order to determine whether the weather effects are region-specific, continued research is needed to replicate this study in other areas that exhibit different characteristics.
|
| [19] |
Evaluating the cascading impacts of sea level rise and coastal flooding on emergency response spatial accessibility in Lower Manhattan, New York City [J].https://doi.org/10.1016/j.jhydrol.2017.10.067 URL [本文引用: 1] 摘要
This paper describes a scenario-based approach for evaluating the cascading impacts of sea level rise (SLR) and coastal flooding on emergency responses. The analysis is applied to Lower Manhattan, New York City, considering FEMA 100- and 500-year flood scenarios and New York City Panel on Climate Change (NPCC2) high-end SLR projections for the 2050s and 2080s, using the current situation as the baseline scenario. Service areas for different response timeframes (3-, 5- and 8-minute) and various traffic conditions are simulated for three major emergency responders (i.e. New York Police Department (NYPD), Fire Department, New York (FDNY) and Emergency Medical Service (EMS)) under normal and flood scenarios. The modelling suggests that coastal flooding together with SLR could result in proportionate but non-linear impacts on emergency services at the city scale, and the performance of operational responses is largely determined by the positioning of emergency facilities and the functioning of traffic networks. Overall, emergency service accessibility to the city is primarily determined by traffic flow speed. However, the situation is expected to be further aggravated during coastal flooding, with is set to increase in frequency and magnitude due to SLR.
|

/
| 〈 |
|
〉 |
