柳林 , 刘文娟
, 刘文娟
LIU Lin, LIU Wenjuan
收稿日期: 2018-02-02
修回日期: 2018-03-29
网络出版日期: 2018-06-28
版权声明: 2018 地理科学进展 《地理科学进展》杂志 版权所有
基金资助:
作者简介:
作者简介:柳林(1965-),男,湖南湘潭人,博士,教授,主要研究方向为地理信息科学、犯罪时空分析与模拟等,E-mail: lin.liu@uc.edu。
展开
摘要
犯罪预测对于制定警务策略、实施犯罪防控具有重要意义。机器学习和核密度是2类主流犯罪热点预测方法,然而目前还鲜有研究对这2类方法在不同时间周期下的犯罪预测效果进行系统比较,本文试图对此进行补充。本文以2013-2016年5月的公共盗窃犯罪历史数据作为输入,分别对比了在接下来2周、1个月、2个月、3个月4个不同时间周期随机森林方法与基于时空邻近性的核密度方法的犯罪热点预测效果,结果发现:在各时间周期上,随机森林分类热点预测方法的面积和案件量命中率均比时空核密度方法准确性高;并且2种方法均能有效地识别犯罪热点中的高发区域,其中在较小范围较短时间内随机森林识别热点中的高发区效率更高,而在较大范围较长时间周期上时空核密度方法识别高发区更优。
关键词:
Abstract
Crime prediction is of great significance for the formulation of police tactics and the implementation of crime prevention and control in different time periods. Machine learning and density mapping are two common approaches for crime hotspot prediction. However, there exists few published work that systematically compares the predicted results of these two approaches. This study aimed to fill the gap. With crime patterns uncovered from 2013 to May 2016, we predicted hot-spot distribution of theft crimes in the period of first two weeks of June, July, and August in 2016 by random forest algorithm and traditional space-time kernel density method and compared the two sets of predictions. The research area was divided into grid cells of 50 m×50 m. Each cell was predicted as either hot-spot or non-hot-spot area in the next predicting period. Then we overlaid the forecast results and location of real cases to evaluate the accuracy of the two methods. The results show that both the hit rate of area and cases of the random forest classification hot-spot prediction method are higher than that of the space-time kernel density within different periods. Both methods can effectively identify high-crime areas of crime hot spots in prediction. In a relatively short period of time and small area, the random forest classification hotspot prediction method is more effective than the space-time kernel density method. However, in a relatively long term and large area, the space-time kernel density crime risk estimation method yields better result in identifying high crime areas.
Keywords:
随着中国城市化进程的快速推进,城市犯罪问题日渐突出,探索如何有效地开展犯罪防控既是公安部门的工作重点,也是犯罪研究的热点和难点。其中,犯罪预测是进行有效犯罪预防的基础,对于打击犯罪、维护社会稳定具有重要意义。过去犯罪预测常以经验规律为基础,而在当前大数据时代背景下,随着机器学习方法在各研究领域的不断普及和应用,犯罪预测防控研究迎来了新的机遇。
国外在犯罪预测方面,以美国的实证研究最有代表性,涉及治安状况、热点时序、作案地居住地、作案类型、特定人群等多个方面。目前中国的犯罪预测研究以国家治安形势预测(梁晓军, 2001)、区域犯罪趋势预测(王发曾, 1992)等宏观趋势理论探讨居多,有关犯罪热点预测的实证研究还较少(陈鹏等, 2011; 刘大千等, 2012; 阎耀军等, 2013; 李卫红等, 2017)。犯罪热点预测以日常活动理论(Cohen et al, 1979; Clarke et al, 2004)、环境犯罪学(Ratcliffe, 2004; Brantingham, 2008)为背景,认为犯罪的发生离不开时间和空间。研究发现,犯罪案件的发生在空间上不是随机均匀分布,而是呈现出一定的集聚和离散特征(Ratcliffe, 2004; Bowers et al, 2005; Grubesic et al, 2008)。对此,Weisburd(2015)总结了犯罪空间集聚规律,认为在地理空间单元上,大部分犯罪案件集聚在小部分区域,这表明犯罪案件在空间上的分布存在热点和冷点区域(Brantingham et al, 1999; Groff et al, 2002),从而使得一定程度上预测犯罪高发的时间和地点成为 可能。
传统的犯罪风险估算方法通常从犯罪案件历史分布中探测出犯罪热点区域,并假设这种规律将会持续到下一个时间周期(Gorr et al, 2003)。如地形风险模型(Risk Terrain Modeling, RTM)(Caplan et al, 2011),考虑到犯罪地的邻近性和犯罪要素的聚集性,采用犯罪相关环境因素的数据和犯罪历史数据等进行犯罪预测,并且对于长周期稳定的犯罪热点预测比较有效。常用的核密度估计方法利用犯罪案件的空间集聚规律进行犯罪风险制图,被公认为能有效地识别热点区域(Hirschfield et al, 2001; Chainey et al, 2002; Clarke et al, 2005; Chainey et al, 2008; Chainey et al, 2013)。Bowers等(2004)发明的犯罪风险地图(ProMap)本质上也是采用了考虑时间关联性的核密度方法。国内有研究发现,基于时间临近性的核密度方法对未来一年的犯罪热点预测效果比一般的核密度估计效果更好(徐冲等, 2016)。时空核密度方法能较好的可视化犯罪热点的形成,但挖掘数据信息的能力不强。
近年来,利用大数据和机器学习、深度学习的方法进行犯罪预测研究已成为热点,不少研究结合人口经济统计数据、土地利用数据、手机数据等和犯罪历史数据进行了不同时间周期的犯罪预测实证研究(李卫红等, 2017; Kianmehr et al, 2008; Bogomolov et al, 2014; Rummens et al, 2017),采用的方法有随机森林、支持向量机、神经网络、贝叶斯模型等多种算法。在各种机器学习算法中,随机森林算法已被证明在多个领域具有较强非线性关系数据处理能力和较高的预测准确率(Genuer et al, 2010; Kandaswamy et al, 2011; Rodriguez et al, 2012)。随机森林的方法虽然学习效率较高,但对于犯罪热点形成原理的解释尚不足。
综上所述,时空核密度和随机森林2种算法在犯罪热点预测上均表现不俗,但2种预测方法在不同时间周期的犯罪热点预测时,到底哪种方法效果更好,在预测原理上各自的优势如何,尚无研究作过系统比较。而通过对比能加深对于犯罪时空热点分布规律的理解,同时更好地指导未来的犯罪预测研究和警务防控实践。因此,本文采用历史犯罪数据对比不同时间尺度上时空核密度和随机森林算法2类犯罪热点预测方法的准确性和有效性。
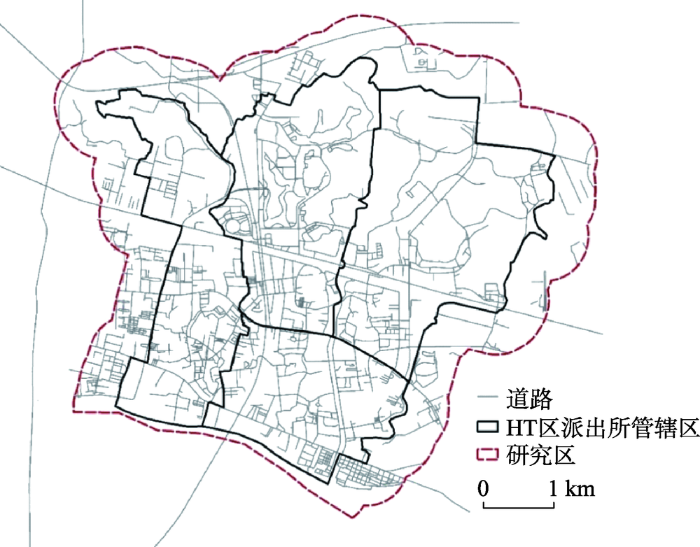
研究区(图1)隶属于中国东南沿海特大城市ZG市HT区。HT区位于ZG市老城区东部,辖内各种交通资源高度聚集,经济持续平稳较快发展。作为全市的中心城区,人口结构复杂,流动性大,社会经济活动繁杂多样。2015年行政区域总面积约137.38 km2,辖有21条行政街。全区户籍人口84.46万人,常住人口154.57万人,2015年全年地区生产总值3438.65亿元,比上年增长8.8%,总量连续9年位居全市首位。同时,该区警务信息化水平较高,数据记录准确全面,可靠性高。
为了减弱边缘效应,研究区以HT区4个派出所(QJ、ZJ、HC、CB)管辖区向外600 m的缓冲区为边界。基本现状数据分别来源于ZG市公安局2013-2016年110接警数据和P-GIS(警务地理信息系统)数据库。110接处警数据记录了每起案件的案件类型,案发时间、地点坐标及接警单位等信息。经自动匹配和人工校正后将110接警数据落到地理空间上,并剔除不在研究区内的案件点。其中公共盗窃警情相比于其他,案件量多,影响范围广,社会潜在危害影响大。
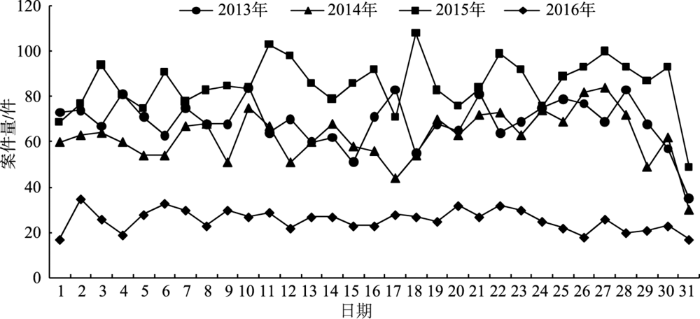
从2013-2016年ZG市HT区公共盗窃案件数量来看,2016年明显少于其他年份,但分月统计显示(图2):4年都呈现出较为相似的趋势性规律,1-2月份案件量陡降,3月份案件量恢复到稳定水平,3-12月份案件量较为平稳,在一定范围内上下波动。各年份的分日统计(图3)特征也较为相似,案件量从1-30日均平缓的上下波动,受年际大小月份影响,2、4、6、9、11月无31日,31号的案件统计数量少于其他月份。
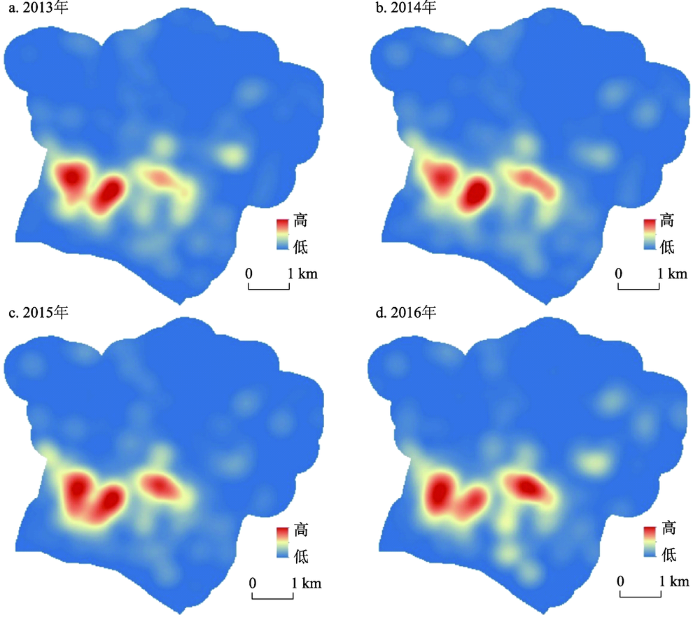
另外统计发现,若以50 m×50 m的网格单元划分研究区,各年全部案件都集聚在7%~8%的网格中。进而对2013-2016年公共盗窃案件按年进行热点分析(图4),发现4年间研究区内公共盗窃案件高发区主要集中在3个部分,热点范围有发生变化,空间位置几乎无太大转移。2013年、2014年、2015年与2016年的犯罪热点高发前20%的区域重叠度分别高达为0.91,0.88,0.89,说明研究区内公共盗窃犯罪热点空间重叠度非常高,犯罪热点在年时间周期上相当稳定,变化很小。
地理学第一定律认为事物在空间上的分布相互联系,且邻近事物之间的联系更紧密,存在集聚、随机、规则分布。基于此原理,核密度(Kernel Density)方法对事物之间的空间联系进行量化计算来反映其分布规律,搜索半径用来划定事物之间的邻近阈值,选取特定的空间衰减函数来描述某事件点与搜索半径覆盖范围内事件点的局部空间关联,表示事物的空间联系紧密度与邻近距离的关系。基于时空邻近性考虑的核密度进一步认为,近期发生的事件相对发生越久远的事件对空间位置的影响更显著,因此加入时间远近大小作为犯罪风险估算的权重。这种方法充分考虑了事物的时空邻近关系与集聚特征形成的联系,从而能根据历史案件累积的空间分布集聚规律来定量估算风险大小,进而较好地识别整体上稳定存在的犯罪高发热点区域。缺点是时空核密度估算热点的高低受历史事件点邻近程度影响,与重复发生的事件点的时空位置可能错位。
随机森林是由Leo Breiman于2001年提出的一种利用多棵树对样本进行训练并预测的分类算法(Breiman, 2001)。其基本原理是在决策树的基础上,综合多个决策的结果。单棵树的分类能力可能很小,但在随机产生大量的决策树后,一个测试样本可以通过每一棵树的分类结果经投票统计后选择最可能的分类。假设有N个样本,每个样本有M个特征,具体实现步骤如下:
(1) 原始训练集为N,应用bootstrap法有放回地随机抽取k个新的自助样本集,并由此构建k棵分类树,每次未被抽到的样本组成了k个袋外数据;
(2) 设有M个变量,则在每一棵树的每个节点处随机抽取m个变量(m<<M),然后在m中选择一个最具有分类能力的变量,变量分类的阈值通过检查每一个分类点确定;
(3) 每棵树最大限度地生长, 不做任何修剪;
(4) 将生成的多棵分类树组成随机森林,用随机森林分类器对新的数据进行判别与分类,分类结果按树分类器的投票多少而定。
随机森林分类算法中生成了多棵决策树,综合多个决策结果可提高分类的灵敏度和准确度。利用随机森林算法进行犯罪预测,能挖掘特征之间和样本之间的相互联系来学习犯罪时空分布的先验规律进行模型训练;此外,在决策树生成过程中引入了随机性,不易出现过拟合现象,对犯罪发生过程中存在的随机因素有较好的容忍度。这种方法具有较高的学习效率和能力,但只能进行热点和非热点的定性判断,不能直接量化估计犯罪发生的可能性大小。
命中率是常见的用来评价犯罪预测准确性的指标之一。本文主要考虑预测面积的命中率、案件量命中率、预测案件密度3个指标。预测面积的命中率即在一定预测面积比下预测为热点的区域中预测正确的面积比例;案件量命中率指的是一定预测面积比例下预测为热点的区域中实际发生案件量与总案件量之比;预测案件密度是一定预测面积比例下预测正确的热点区域内案件量与面积之比。
基于时空邻近性的核密度进行犯罪风险估算在以往的核密度方法的基础上加上了事件点时间关联的计算,因此将2013-2016 年5月的公共盗窃7773起案件点的时间和位置作为输入,采用在ArcGIS10.0 软件中的核密度基础上进行二次开发的工具实现时空邻近相似性核密度犯罪风险估算。本文参照文献徐冲等(2013)选取Gaussian函数作为距离衰减函数及反时间距离权重计算公式构建模型进行实验。其中有两个重要参数需要注意,距离搜索半径参考文献(徐冲等, 2013; 徐冲等, 2016)设为150 m,输出密度风险图的栅格单元大小设为50 m×50 m。以2016 年6、7、8月发生的公共盗窃案件点作为验证数据。
随机森林分类算法直接预测每一个空间单元是否为热点。与时空核密度保持一致,将研究区划分为50 m×50 m的网格,则研究区含网格数共计14720个,每一个单元网格格的犯罪热点预测可以看作一个二分类问题,在下一个预测时间期内预测为热点或者非热点。选择每一个单元中2013年、2014年、2015年与预测目标时间同期的时间段,临近时间内均向前推算若干与预测目标时段长度相同的时间段的历史案件数据建立随机森林预测模型,建立决策树300棵,随机抽取变量数设为4。经过多次计算发现,选取4个临近步长时段,已能达到较好的预测效果。并且对4个临近时段内犯罪案件的发生地以150 m为搜索半径作核密度分析,取每个网格的临近4个时间段的极差标准化核密度值。以每个网格中各时段的犯罪案件量及案件密度为样本,用前一期的犯罪案件作为训练标准设置热点和非热点分类标签,预测这一期是否为犯罪热点。
由于该区域内公共盗窃案件的空间分布集聚特征显著,有案件发生的区域占整个研究区的面积比例极小,并且在研究时段的2周内总共有76起案件发生在研究区的72个网格内,案件密度较小,为方便与其他时段进行比较,统一将有案件发生的区域均视为热点区域。本文对2016年6月份前2周、1个月(6月)、2个月(6、7月)、3个月(6、7、8月)均进行了预测,各时间周期的犯罪案件网格分布情况如表1,以1个月为例对实验操作说明如表2。
表1 不同周期案件量及有案件发生网格情况
Tab.1 Count of grids where crimes occurred and total crime numbers in different time periods
| 热点网格数/个 | 总案件量/起 | 单个网格最大案件量 | 热点网格案件量中位数 | 热点网格案件量平均值 | |
|---|---|---|---|---|---|
| 2016年6月份前2周 | 72 | 76 | 2 | 1 | 1.05 |
| 2016年6月份 | 140 | 164 | 6 | 1 | 1.17 |
| 2016年6、7月份 | 282 | 350 | 12 | 1 | 1.24 |
| 2016年6、7、8月份 | 415 | 554 | 20 | 1 | 1.33 |
表2 2016年6月份犯罪热点分类预测实验说明
Tab.2 Explanation of crime hotspot classification prediction for June, 2016
| 周期性 | 临近性 | |
|---|---|---|
| 输入训练数据 | 2013年5月份案件量 | 2016年1月份案件核密度 |
| 2014年5月份案件量 | 2016年2月份案件核密度 | |
| 2015年5月份案件量 | 2016年3月份案件核密度 | |
| / | 2016年4月份案件核密度 | |
| 输入测试数据 | 2013年6月份案件量 | 2016年2月份案件核密度 |
| 2014年6月份案件量 | 2016年3月份案件核密度 | |
| 2015年6月份案件量 | 2016年4月份案件核密度 | |
| / | 2016年5月份案件核密度 | |
| 输入分类标签 | 2016年5月份热点/非热点 | / |
| 输出分类标签 | / | 2016年6月份热点/非热点 |
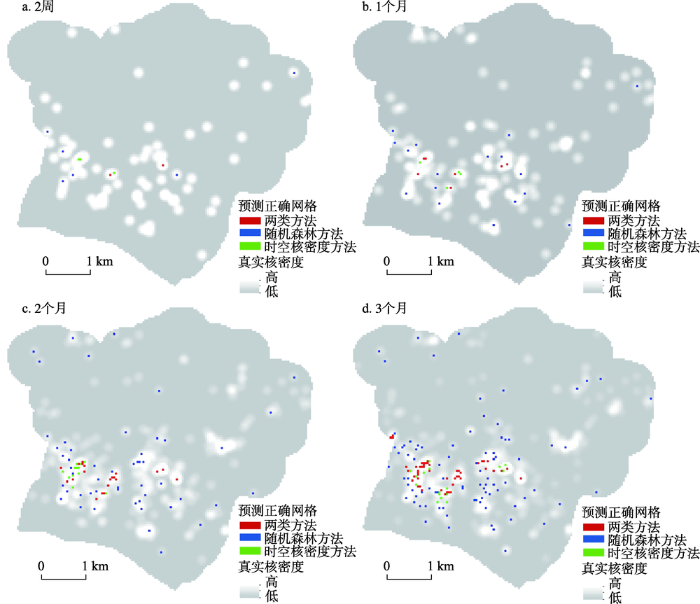
时空核密度风险估算得到的是栅格化密度风险图,而随机森林算法得到的是矢量的矩形网格热点图。为便于对比二者的预测结果,先将栅格图转为矢量网格图,其中实际有案件发生的网格视为实际热点网格,若实际热点网格与预测热点网格重叠则视为预测正确。分别统计预测热点区域的面积和真实案件数量来比较2种方法的预测准确性。由于研究区内案件量少,集聚程度较高,大部分区域没有案件发生,在2016年6月份前2周、1个月(6月)、2个月(6、7月)、3个月(6、7、8月)共4个时间周期内有案件发生的网格单元数量分别为72、140、282、415,分别约占研究区面积的0.5%、1%、2%、3%。对于随机森林预测结果,按照热点得票数对随机森林预测网格进行排序,分别选取4个时间周期投票数靠前的72、140、282、415个网格作为热点区域。相应地,时空核密度算法抽取密度风险最大的前72、140、282、415个栅格单元作为热点区域。对比各时间段时空核密度和随机森林方法预测结果及真实案件分布情况(图5),红色的网格是2种方法均正确预测为热点的区域,绿色的网格是只有时空核密度方法预测正确的热点区域,蓝色的网格是只有随机森林预测方法预测正确的热点区域,底图是对应预测时间段真实案件分布的核密度图。可见,随着预测时间周期的延长,2种方法预测正确的网格数量也随之增加,并且各预测周期内随机森林方法预测的正确热点网格数量均大于时空核密度估算方法。从空间上看,时空核密度方法预测正确的结果空间上更为集聚,而随机森林预测正确的热点区域在整个研究区内分布较为分散。
图5 时空核密度与随机森林预测热点对比图
Fig.5 Comparison of hotspot prediction results of space-time kernel density and random forest methods
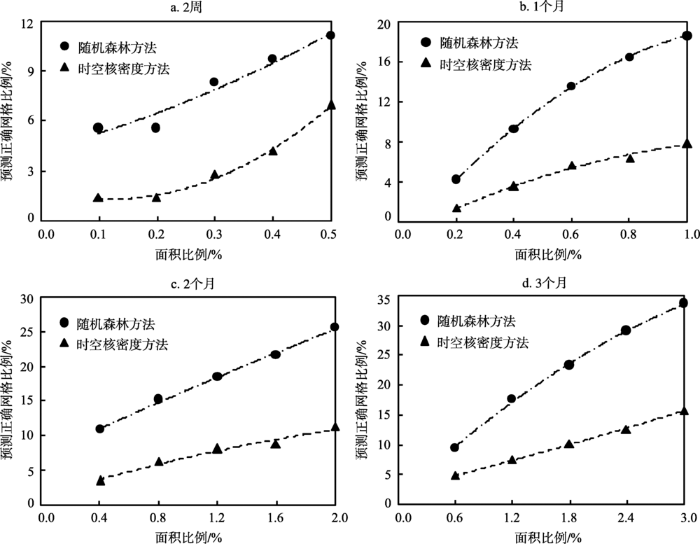
首先对比2种方法预测面积的命中率。如图6所示,横坐标是预测热点的面积与研究区总面积之比,纵坐标表示预测正确的热点网格数与预测热点网格数之比。总体上,2种方法预测面积的命中率随预测时间周期的延长逐渐提高,比如在与真实案件分布等面积预测时,时空核密度方法在2周、1个月、2个月、3个月的预测正确网格比例依次为6.94%、7.86%、11.35%、15.66%;而随机森林方法依次为9.72%、18.57%、25.53%、33.73%。不难看出在预测同等面积热点区域条件下,随机森林方法预测正确的网格面积在各测时间周期上均高于时空核密度方法。
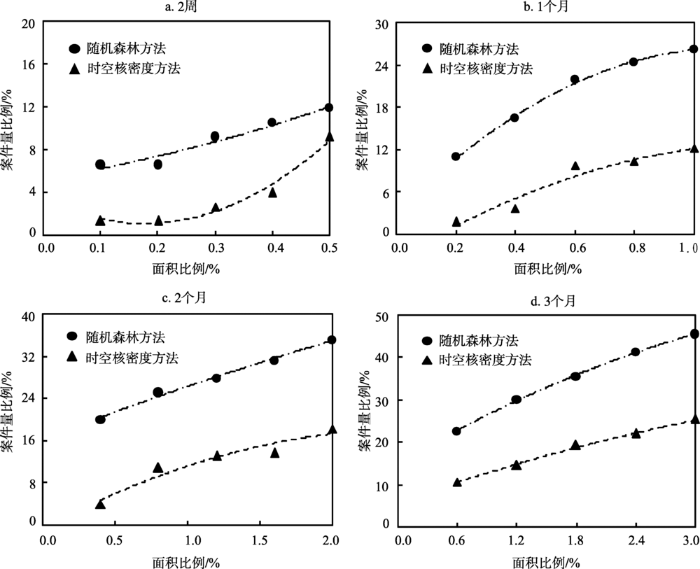
将研究区2016年对应预测时间段内的案件点与预测结果进行叠加统计,进一步对预测案件量的命中率进行评估。落在预测热点区域内的视为正确预测的案件,统计预测正确的案件数占总案件数的比例,可以得到各预测时间周期下2种方法在不同预测面积下正确预测的案件比例。2种方法的案件量预测准确性对比如图7所示。与预测面积的命中率对比结果类似,2种方法在各时段上预测的案件量命中率在长周期时间上要优于短周期。同等预测面积条件下,随机森林方法预测案件量命中率在各个时间长度上均高于时空核密度方法。如在与真实案件分布等面积预测时,时空核密度方法在前2周、1个月、2个月、3个月的预测案件量比例依次9.21%、12.19%、18.28%、25.27%;而随机森林方法依次为10.53%、26.22%、35.14%、45.30%。
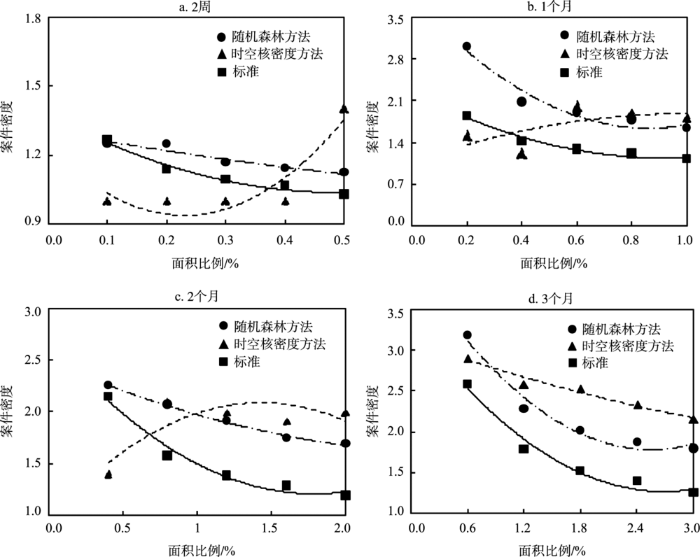
在同样的研究区范围内,受环境因素影响,案件的发生在空间上的分布是不均匀的,同样大小的空间单元内发生的案件量大小也存在差异。案件量较大的地方是热点区域中的高发区,社会治安形势严峻,也是犯罪防控和警务实践关注的重点之一。图8是各时间段预测正确热点区域案件密度与预测面积之间的关系。标准情况是指同等预测面积大小条件下,按案件量从高到低排序,选取研究区内案件量靠前的网格中总案件量与预测面积之比。由图中可以看出,从2周、1个月、2个月到3个月4个时间周期上,在较小较短时间周期内随机森林方法识别案件高发区的效率要高于标准条件,时空核密度方法则要低于标准条件;而在较长时间周期较大预测范围内预测正确的热点区域内案件密度大小顺序依次是时空核密度方法、随机森林方法、标准条件。说明2种方法均能有效识别犯罪热点中的高发区域。其中,在较小范围较短时间内随机森林识别热点中的高发区效率更高,而在较大范围较长时间周期上时空核密度方法识别高发区更优。
图8 各时间周期预测正确热点区域案件密度
Fig.8 Case density of the hit areas in different time periods
国内外有不少学者采用核密度、机器学习等方法进行犯罪热点预测,并采用不同指标对预测效果进行评估,本文2种方法的预测结果可与其他方法间接对比评价。尽管研究区和研究数据不同,与Bowers等(2004)经典的风险地图预测精度相比,其预测的未来一周发生的案件量为70起,栅格单元大小同样为50 m×50 m,共计10816个网格,在风险值前20%的区域预测的案件量命中率为64%。本文实验中2周案件量与之相差无几,而时空核密度方法风险值前20%的区域的案件量命中率达到75%。与Rummens等(2017)的文章中利用人口统计、社会经济、土地利用等数据,采用逻辑回归、神经网络及综合2种方法的预测结果相比,在125 m
本文以ZG市HT区4个派出所的公共盗窃案件数据为案例,对比了不同时间尺度上的时空核密度和随机森林算法这2类主流方法的犯罪热点预测效果,结果发现:2种方法均能有效识别犯罪热点中的高发区域,随机森林分类热点预测方法的面积和案件量命中率均比时空核密度估算准确性高。并且在较短时间较小范围内,随机森林分类热点预测方法比时空核密度犯罪风险估算的方法识别热点中的高发区效率更高;而在较大范围较长时间周期上时空核密度犯罪风险估算的方法识别热点中的高发区更优。
长期预测主要服务于宏观政策的制定,而短期预测能为特定时间内的警力资源部署提供支持,对于犯罪防控均具有重要意义。不同警务策略的制定除了时间有效性考虑,还受到空间可及范围的制约,本文的犯罪热点预测对比结果对于长短周期的警务防控策略以及一定空间范围的警务管控均有一定的实践参考意义。但值得讨论的是,不同的研究区不同的犯罪案件类型的空间分布特征差异较大,采用何种原理的预测方法更好还难以直接定论。因此,本文的预测对比结果是否适用于其他研究区案件类型还需要采取进一步的实验验证,可能会在犯罪案件的发生及时空热点的形成规律研究等方面有新的发现。
The authors have declared that no competing interests exist.
| [17] |
When is a hotspot a hotspot? A procedure for creating statistically robust hotspot maps of crime [A]// |
| [18] |
The utility of hotspot mapping for predicting spatial patterns of crime [J].https://doi.org/10.1057/palgrave.sj.8350066 URL [本文引用: 1] |
| [19] |
Crime analysis for problem solvers in 60 small steps [J]. |
| [20] |
Routine activity and rational choice [M]. |
| [21] |
Social change and crime rate trends: A routine activity approach [J].https://doi.org/10.2307/2094589 URL [本文引用: 1] 摘要
In this paper we present a "routine activity approach" for analyzing crime rate trends and cycles. Rather than emphasizing the characteristics of offenders, with this approach we concentrate upon the circumstances in which they carry out predatory criminal acts. Most criminal acts require convergence in space and time of likely offenders, suitable targets and the absence of capable guardians against crime. Human ecological theory facilitates an investigation into the way in which social structure produces this convergence, hence allowing illegal activities to feed upon the legal activities of everyday life. In particular, we hypothesize that the dispersion of activities away from households and families increases the opportunity for crime and thus generates higher crime rates. A variety of data is presented in support of the hypothesis, which helps explain crime rate trends in the United States 1947-1974 as a byproduct of changes in such variables as labor force participation and single-adult households.
|
| [22] |
Variable selection using random forests [J].https://doi.org/10.1016/j.patrec.2010.03.014 URL [本文引用: 1] 摘要
This paper proposes, focusing on random forests, the increasingly used statistical method for classification and regression problems introduced by Leo Breiman in 2001, to investigate two classical issues of variable selection. The first one is to find important variables for interpretation and the second one is more restrictive and try to design a good parsimonious prediction model. The main contribution is twofold: to provide some experimental insights about the behavior of the variable importance index based on random forests and to propose a strategy involving a ranking of explanatory variables using the random forests score of importance and a stepwise ascending variable introduction strategy.
|
| [23] |
Introduction to crime forecasting [J].https://doi.org/10.1016/S0169-2070(03)00089-X URL [本文引用: 1] |
| [24] |
Forecasting the future of predictive crime mapping [J].
ABSTRACT While the use of mapping in criminal justice has increased over the last 30 years, most applications are retrospective -that is, they examine criminal phenomena and related factors that have al-ready occurred. While such retrospective mapping efforts are useful, the true promise of crime mapping lies in its ability to identify early warning signs across time and space, and inform a proactive approach to police problem solving and crime prevention. Recently, attempts to develop predictive models of crime have increased, and while many of these efforts are still in the early stages, enough new knowledge has been built to merit a review of the range of methods employed to date. This chapter identifies the various methods, describes what is required to use them, and assesses how accurate they are in predicting future crime concentrations, or "hot spots." Factors such as data require-ments and applicability for law enforcement use will also be explored, and the chapter will close with recommendations for further research and a discussion of what the future might hold for crime forecasting.
|
| [25] |
Spatial-temporal interaction of urban crime [J].https://doi.org/10.1007/s10940-008-9047-5 URL [本文引用: 1] 摘要
Over the past decade, a renewed interest in the analysis of crime hot-spots has emerged in the social and behavioral sciences. Spurred by improvements in computing power, data visualization and geographic information systems, numerous innovative approaches have materialized for identifying areas of elevated crime in urban environments. Unfortunately, many hot-spot analysis techniques treat the spatial and temporal aspects of crime as distinct entities, thus ignoring the necessary interaction of space and time to produce criminal opportunities. The purpose of this paper is to explore the utility of statistical measures for identifying and comparing the spatio-temporal footprints of robbery, burglary and assault. Functional and visual comparisons for spatio-temporal clusters are analyzed across a range of space ime values using a comprehensive database of crime events for Cincinnati, Ohio. Empirical results suggest that robbery, burglary and assault have dramatically different spatio-temporal signatures.
|
| [26] |
Mapping and analyzing crime data: Lessons from research and practice [J].https://doi.org/10.1111/1467-9787.00274 URL [本文引用: 1] 摘要
Mapping and Analysing Crime Data: Lessons from Research and Practice - 2001 by Kate Bowers, Alex Hirschfield, Ian Turton, Stan Openshaw, Andrew Costello, Jerry H. Ratcliffe, Michael J. McCullagh, Spencer Chainey, Kate Bowers, Martin Newton, Richard Nutter, James L. Lebeau, Steven Merrall, Doug Williamson, Sara McLafferty, Philip McGuire, Timothy Ross, John Mollenkopf, Victor Goldsmith, Steve Quinn, Nancy G. La Vigne, Elizabeth R. Groff, Ken Pease, Alex Hirschfield. Read Mapping and Analysing Crime Data: Lessons from Research and Practice now at Questia.
|
| [27] |
AFPPred: A random forest approach for predicting antifreeze proteins from sequence- derived properties [J].https://doi.org/10.1016/j.jtbi.2010.10.037 URL PMID: 21056045 [本文引用: 1] 摘要
Some creatures living in extremely low temperatures can produce some special materials called “antifreeze proteins” (AFPs), which can prevent the cell and body fluids from freezing. AFPs are present in vertebrates, invertebrates, plants, bacteria, fungi, etc. Although AFPs have a common function, they show a high degree of diversity in sequences and structures. Therefore, sequence similarity based search methods often fails to predict AFPs from sequence databases. In this work, we report a random forest approach “AFP-Pred” for the prediction of antifreeze proteins from protein sequence. AFP-Pred was trained on the dataset containing 300 AFPs and 300 non-AFPs and tested on the dataset containing 181 AFPs and 9193 non-AFPs. AFP-Pred achieved 81.33% accuracy from training and 83.38% from testing. The performance of AFP-Pred was compared with BLAST and HMM. High prediction accuracy and successful of prediction of hypothetical proteins suggests that AFP-Pred can be a useful approach to identify antifreeze proteins from sequence information, irrespective of their sequence similarity.
|
| [28] |
Effectiveness of support vector machine for crime hot-spots prediction [J].https://doi.org/10.1080/08839510802028405 URL [本文引用: 1] 摘要
Crime hot-spot location prediction is important for public safety. The output from the prediction can provide useful information to improve the activities aimed at detecting and preventing safety and security problems. Location prediction is a special case of spatial data mining classification. For instance, in the public safety domain, it may be interesting to predict location(s) of crime hot spots. In this study, we present a support vector machine (SVM)-based approach to predict the location as an alternative to existing modeling approaches. Support vector machine forms the new generation of machine-learning techniques used to find optimal separability between classes within datasets. We compare the performance of two types of SVMs techniques: two-class SVMs and one-class SVMs. We also compared SVM with a neural network-based approach and spatial auto-regression-based approach. Experiments on two different spatial datasets demonstrate that the former approach performs slightly better and the latter one gives reasonable results. Furthermore, in this study, we provide a general framework to customize the spatial data classification task for other spatial domains that have datasets similar to the analyzed crime datasets.
|
| [1] |
时空犯罪热点预测模型研究 [J].Research about spatial-temporal forecasting of crime hotspots [J]. |
| [29] |
Crime mapping and the training needs of law enforcement [J]. |
| [30] |
A temporal constraint theory to explain opportunity-based spatial offending patterns [J].https://doi.org/10.1177/0022427806286566 URL 摘要
Abstract This article will examine the evidence supporting the notion that a proportion of offending is driven by the availability of opportunities presented in the routine activities of offenders’ lives. It then proceeds to summarize Miller’s time measurement theory in order to describe a basic language with which to discuss the movement of people through time and space. Armed with a notation for space-time interactions, the article explores the criminological implications of temporal constraints as a mechanism to explain a number of key concepts from environmental criminology. It is hypothesized here that the temporal constraints of daily life are the main cause of unfamiliarity with areas beyond the offender’s immediate least-distance path. As a result, temporal constraints, in conjunction with the locations of offender nodes, are a major determinant in spatio-temporal patterns of property crime.
|
| [2] |
改进的GA-BP神经网络模型在财产犯罪预测中的应用 [J].https://doi.org/10.13203/j.whugis20160911 URL [本文引用: 2] 摘要
发现犯罪时空分布规律并预测犯罪发生,是提高警务策略有效预防、控制犯罪的重要方法。在分析财产犯罪时空规律的基础上,利用BP神经网络模型自动学习训练各因子与财产犯罪的非线性关系,建立了财产犯罪预测模型。针对BP神经网络模型易陷入局部最优和模型不稳定的缺陷,提出了利用遗传算法(GA)选择各因子最优的初始化权重和参数,并以此作为BP神经网络模型的初始化权重矩阵,通过对历史数据的学习及训练建立了改进后的GA-BP神经网络模型。利用某市2007~2012年财产犯罪、人口、GDP、土地利用等35个综合影响因子数据,对改进前后的模型进行了预测对比试验。结果表明,改进后的GA-BP神经网络模型成功克服了BP模型的缺陷,收敛迭代最小次数从117次改进到8次;10次计算收敛迭代次数最大误差从370次提高到5次;模型预测精度(RMES)从0.043 0提高到0.019 95。
Property crime forecast based on improved GA-BP Neural Network Model [J].https://doi.org/10.13203/j.whugis20160911 URL [本文引用: 2] 摘要
发现犯罪时空分布规律并预测犯罪发生,是提高警务策略有效预防、控制犯罪的重要方法。在分析财产犯罪时空规律的基础上,利用BP神经网络模型自动学习训练各因子与财产犯罪的非线性关系,建立了财产犯罪预测模型。针对BP神经网络模型易陷入局部最优和模型不稳定的缺陷,提出了利用遗传算法(GA)选择各因子最优的初始化权重和参数,并以此作为BP神经网络模型的初始化权重矩阵,通过对历史数据的学习及训练建立了改进后的GA-BP神经网络模型。利用某市2007~2012年财产犯罪、人口、GDP、土地利用等35个综合影响因子数据,对改进前后的模型进行了预测对比试验。结果表明,改进后的GA-BP神经网络模型成功克服了BP模型的缺陷,收敛迭代最小次数从117次改进到8次;10次计算收敛迭代次数最大误差从370次提高到5次;模型预测精度(RMES)从0.043 0提高到0.019 95。
|
| [31] |
An assessment of the effectiveness of a random forest classifier for land- cover classification [J].https://doi.org/10.1016/j.isprsjprs.2011.11.002 URL [本文引用: 1] 摘要
Land cover monitoring using remotely sensed data requires robust classification methods which allow for the accurate mapping of complex land cover and land use categories. Random forest (RF) is a powerful machine learning classifier that is relatively unknown in land remote sensing and has not been evaluated thoroughly by the remote sensing community compared to more conventional pattern recognition techniques. Key advantages of RF include: their non-parametric nature; high classification accuracy; and capability to determine variable importance. However, the split rules for classification are unknown, therefore RF can be considered to be black box type classifier. RF provides an algorithm for estimating missing values; and flexibility to perform several types of data analysis, including regression, classification, survival analysis, and unsupervised learning. In this paper, the performance of the RF classifier for land cover classification of a complex area is explored. Evaluation was based on several criteria: mapping accuracy, sensitivity to data set size and noise. Landsat-5 Thematic Mapper data captured in European spring and summer were used with auxiliary variables derived from a digital terrain model to classify 14 different land categories in the south of Spain. Results show that the RF algorithm yields accurate land cover classifications, with 92% overall accuracy and a Kappa index of 0.92. RF is robust to training data reduction and noise because significant differences in kappa values were only observed for data reduction and noise addition values greater than 50 and 20%, respectively. Additionally, variables that RF identified as most important for classifying land cover coincided with expectations. A McNemar test indicates an overall better performance of the random forest model over a single decision tree at the 0.00001 significance level.
|
| [32] |
The use of predictive analysis in spatiotemporal crime forecasting: Building and testing a model in an urban context [J].https://doi.org/10.1016/j.apgeog.2017.06.011 URL [本文引用: 2] 摘要
Police databases hold a large amount of crime data that could be used to inform us about current and future crime trends and patterns. Predictive analysis aims to optimize the use of these data to anticipate criminal events. It utilizes specific statistical methods to predict the likelihood of new crime events at small spatiotemporal units of analysis. The aim of this study is to investigate the potential of applying predictive analysis in an urban context. To this end, the available crime data for three types of crime (home burglary, street robbery, and battery) are spatially aggregated to grids of 200 by 200m and retrospectively analyzed. An ensemble model is applied, synthesizing the results of a logistic regression and neural network model, resulting in bi-weekly predictions for 2014, based on crime data from the previous three years. Temporally disaggregated (day versus night predictions) monthly predictions are also made. The quality of the predictions is evaluated based on the following criteria: direct hit rate (proportion of incidents correctly predicted), precision (proportion of correct predictions versus the total number of predictions), and prediction index (ratio of direct hit rate versus proportion of total area predicted as high risk). Results indicate that it is possible to attain functional predictions by applying predictive analysis to grid-level crime data. The monthly predictions with a distinction between day and night produce better results overall than the bi-weekly predictions, indicating that the temporal resolution can have an important impact on the prediction performance.
|
| [3] |
“十五”期间犯罪预测与侦查工作机制创新 [J].
本文通过对泸州市改革开改以来刑事犯罪的回顾,对“十五”期间西部内陆地区犯罪走势进行推演预测,提出未来五年的公安侦查工作必须大力强化机制创新、超前预测、科技强侦、情报信息网络、实战技能训练五个方面的意识。
"Shiwu" qijian fanzui yuce yu zhencha gongzuo jizhi chuangxin [J].
本文通过对泸州市改革开改以来刑事犯罪的回顾,对“十五”期间西部内陆地区犯罪走势进行推演预测,提出未来五年的公安侦查工作必须大力强化机制创新、超前预测、科技强侦、情报信息网络、实战技能训练五个方面的意识。
|
| [4] |
国内外犯罪地理学研究进展评析 [J].
国外犯罪地理发展过程体现出内容体系不断完善、方法技术日益成熟、学科融合趋势明显三个显著特征。针对国外犯罪地理的具体内容,分别论述了犯罪制图的发展过程与犯罪热点辨识的方法演进,概括了国外犯罪地理领域影响最大的社会解组理论和日常活动理论的主要内容和发展现状,进而简要的评析了国外犯罪地理研究的发展趋势及不足。文章接着通过对所收集到的国内相关研究的总结,将我国犯罪地理学的发展归纳为理论初探、缓慢发展和微观转向三个阶段,并简述了每个阶段内主要的研究成果及发展特点。最后提出了进一步促进我国犯罪地理研究发展的几点建议。
Review of studies on criminal geography [J].
国外犯罪地理发展过程体现出内容体系不断完善、方法技术日益成熟、学科融合趋势明显三个显著特征。针对国外犯罪地理的具体内容,分别论述了犯罪制图的发展过程与犯罪热点辨识的方法演进,概括了国外犯罪地理领域影响最大的社会解组理论和日常活动理论的主要内容和发展现状,进而简要的评析了国外犯罪地理研究的发展趋势及不足。文章接着通过对所收集到的国内相关研究的总结,将我国犯罪地理学的发展归纳为理论初探、缓慢发展和微观转向三个阶段,并简述了每个阶段内主要的研究成果及发展特点。最后提出了进一步促进我国犯罪地理研究发展的几点建议。
|
| [5] |
城市犯罪发展趋势预测 [J].Chengshi fanzui fazhan qushi yuce [J]. |
| [6] |
基于临近相似性考虑的犯罪热点密度图预测准确性比较: 以DP半岛街头抢劫犯罪为例 [J].https://doi.org/10.1329/j.cnki.sgs.2016.01.007 URL Magsci [本文引用: 2] 摘要
在无时空考虑的密度估计算法基础上,分别加入了案件点之间的时间临近相似性、空间临近相似性和时空临近相似性的考虑,利用DP半岛2006~2007年的街头抢劫犯罪数据为基础计算无时空临近相似性、时间临近相似性、空间临近相似性和时空临近相似性4种不同算法所得到的犯罪热点图,并以之预测2008年的街头抢劫。通过Natural breaks(Jenks)分级方法和等比例面积选取两种方式来划定热点区域进行预测并进行PAI指数得分比较,结果表明时空临近相似性的密度估计算方法在犯罪预测的优势比较显著。
The comparison of predictive accuracy of crime hotspot density maps with the consideration of the near similarity:A case study of robberies at DP Peninsula [J].https://doi.org/10.1329/j.cnki.sgs.2016.01.007 URL Magsci [本文引用: 2] 摘要
在无时空考虑的密度估计算法基础上,分别加入了案件点之间的时间临近相似性、空间临近相似性和时空临近相似性的考虑,利用DP半岛2006~2007年的街头抢劫犯罪数据为基础计算无时空临近相似性、时间临近相似性、空间临近相似性和时空临近相似性4种不同算法所得到的犯罪热点图,并以之预测2008年的街头抢劫。通过Natural breaks(Jenks)分级方法和等比例面积选取两种方式来划定热点区域进行预测并进行PAI指数得分比较,结果表明时空临近相似性的密度估计算方法在犯罪预测的优势比较显著。
|
| [7] |
DP半岛街头抢劫犯罪案件热点时空模式 [J].The spatio-temporal patterns of street robbery in DP Peninsula [J]. |
| [8] |
犯罪预测时空定位信息管理系统的构建 [J].
任何犯罪都离不开特定的时间和地点.通过历史数据发掘,可以获得对犯罪预测具有历史惯性意义的时间可能性系数和空间可能性系数.历史是既定的客观,而现实则变动不居,未来更是充满诸多新的和不确定的变量,所以单凭纯客观历史数据外推出来的线性结果,尚不足以形成可靠的预测.设立主观修正系数,将现实生活中随机、动态的变量纳入预测系统之中并与之拟合,便可以得到我们期望的预测犯罪行为发生概率的可能性系数.通过计算机技术将所有时间节点和空间坐标中的犯罪可能性系数,在网格化的电子地图中一一显示,便形成犯罪预测时空定位信息管理系统.
fanzui yuce shikong dingwei xinxi guanli xitong de goujian [J].
任何犯罪都离不开特定的时间和地点.通过历史数据发掘,可以获得对犯罪预测具有历史惯性意义的时间可能性系数和空间可能性系数.历史是既定的客观,而现实则变动不居,未来更是充满诸多新的和不确定的变量,所以单凭纯客观历史数据外推出来的线性结果,尚不足以形成可靠的预测.设立主观修正系数,将现实生活中随机、动态的变量纳入预测系统之中并与之拟合,便可以得到我们期望的预测犯罪行为发生概率的可能性系数.通过计算机技术将所有时间节点和空间坐标中的犯罪可能性系数,在网格化的电子地图中一一显示,便形成犯罪预测时空定位信息管理系统.
|
| [9] |
Once upon a crime: towards crime prediction from demographics and mobile data [C]// |
| [10] |
Domestic burglary repeats and space-time clusters [J].https://doi.org/10.1177/1477370805048631 URL [本文引用: 1] |
| [11] |
Prospective hot-spotting: The future of crime mapping [J].https://doi.org/10.1093/bjc/azh036 URL [本文引用: 2] |
| [12] |
A theoretical model of crime hot spot generation [J].
ABSTRACT Analysis of crime hot spots (spatial concentrations) and burning times (temporal concentrations) has become a major component of the work of criminologists, crime analysts and crime prevention practitioners over the past decade. This paper lays out several specific elements of a model of crime hot spot formation grounded in the fields of human ecology, routine activities theory, life style theory, rational choice theory and pattern theory. A preliminary theory of hot spot and burning time formation is advanced and illustrated using police calls for service data from Vancouver, Canada. Crime prevention proposals are derived and future research needs are specified. (PsycINFO Database Record (c) 2012 APA, all rights reserved)
|
| [13] |
|
| [14] |
Random forests [J].https://doi.org/10.1023/A:1010933404324 URL [本文引用: 1] |
| [15] |
Risk terrain modeling: Brokering criminological theory and GIS methods for crime forecasting [J].https://doi.org/10.1080/07418825.2010.486037 URL [本文引用: 1] 摘要
The research presented here has two key objectives. The first is to apply risk terrain modeling (RTM) to forecast the crime of shootings. The risk terrain maps that were produced from RTM use a range of contextual information relevant to the opportunity structure of shootings to estimate risks of future shootings as they are distributed throughout a geography. The second objective was to test the predictive power of the risk terrain maps over two six‐month time periods, and to compare them against the predictive ability of retrospective hot spot maps. Results suggest that risk terrains provide a statistically significant forecast of future shootings across a range of cut points and are substantially more accurate than retrospective hot spot mapping. In addition, risk terrain maps produce information that can be operationalized by police administrators easily and efficiently, such as for directing police patrols to coalesced high‐risk areas.
|
| [16] |
GIS and Crime Mapping [M]. |
| [33] |
The law of crime concentration and the criminology of place [J].https://doi.org/10.1111/1745-9125.12070 URL [本文引用: 1] |

/
| 〈 |
|
〉 |
