郝志新
HAO Zhixin
通讯作者:
收稿日期: 2018-02-3
修回日期: 2018-03-20
网络出版日期: 2018-04-20
版权声明: 2018 地理科学进展 《地理科学进展》杂志 版权所有
基金资助:
展开
摘要
依据近期发表的古丝绸之路沿线若干地区(点)的温度重建序列,结合干湿变化等代用记录,分析了过去千年古丝绸之路沿线温度变化的基本特征,以及这些地区(点)在“中世纪气候异常期”(MCA,约950-1250年)和“小冰期”(LIA,约1450-1850年)的干湿特征异同。主要结论为:①过去2000年古丝绸之路的温度变化经历了1-3世纪温暖、4-7世纪前期寒冷、7世纪后期-11世纪初温暖、11世纪中期-12世纪初偏冷、12世纪中期-13世纪中期温暖、13世纪末-19世纪中期寒冷和20世纪快速增暖的百年际波动过程;但不同区域间的年代至百年尺度变化位相不完全同步,波动幅度也存在差异。②各地干湿特征在MCA和LIA也存在一定差异:中国的关中平原及河西走廊在MCA间的干湿变率较LIA大;中亚干旱区MCA期间气候偏干,LIA期间偏湿;欧洲中北部以及斯堪的纳维亚半岛南部等地在MCA间气候较LIA偏干,且中部地区LIA间的干湿变率较MCA大;芬兰和斯堪的纳维亚半岛北部以及俄罗斯等地MCA间的气候较LIA更湿润。
关键词:
Abstract
Based on the recently published multi-proxies temperature reconstruction series (longer than 1000 years) along the Ancient Silk Road, combined with the dry and wet condition variation reconstructions, the general characteristics of temperature changes were analyzed and the regional differences of dry and wet condition variations were compared for the Medieval Climate Anomaly (MCA, AD950-AD1250) and Little Ice Age (LIA, AD1450-AD1850). The main conclusions are: the centennial temperature variations during the past 2000 years experienced warm epochs in the 1st-3rd century, the latter part of the 7th century to the early of the 11th century, the mid-12th century to mid-13th century, and since the 20th century; and cold epochs during the 4th century to the early 7th century, the middle of the 11th century to the early 12th century, and the end of the 13th century to the mid-19th century. The phases of warm and cold condition and fluctuations at decadal-centennial temporal scales differed among the various regions. The wet and dry condition variations during the MCA and LIA also exhibited regional differences, which was larger during the MCA than the LIA on the Guanzhong Plain and in the Hexi Corridor of China, and the climate was dry during the MCA and wet during the LIA in the arid region of Central Asia. The climate was drier during the MCA than the LIA in the south of Scandinavia and the middle and northern parts of Europe, and in the central part of this region the variation was large during the LIA. In contrast, Finland, northern Scandinavia, and Russia had wetter climate during the MCA.
Keywords:
古丝绸之路主要指连接东西方文明的陆上贸易和文化交流通道,东起中国的洛阳、长安(今西安),经中国西北横贯欧亚大陆的中纬度地区,西至地中海沿岸和欧洲西部沿海地区(荣新江, 2015)。随着“一带一路”倡议的逐步推进,这些区域的地缘与资源环境问题也成为当前学术界关注的一个新“热点”(刘卫东, 2015; Li et al, 2017)。古丝绸之路沿线地理环境复杂,气候类型多样,人类活动历史悠久。有研究显示:古丝绸之路一些重要节点的兴衰(如楼兰古国、高昌国衰落等)可能与气候变化密切相关(葛全胜, 2011;Li et al, 2016);并发现:气候转暖转湿,聚落分布向小绿洲和河流中下游扩展,转冷则缩回至山麓盆地和河流上游(Jia et al, 2017);因而其千年气候环境变化历史研究也备受关注。2017年9月,国际过去全球变化计划(Past Global Changes project,PAGES)和德国基尔大学(Kiel University)还就此联合举办了题为“丝路兴衰:古丝绸之路区域社会文化变化的环境因素”国际研讨会,并将“古气候记录和环境变化史”列为核心主题(http://www.pastglobalchanges.org/calendar/2017/127-pages/1708-silk-road-wshop-17);中国近期启动的一些科学计划也将这一问题列为重要研究内容(陈发虎等, 2017),并分析了沿线主要国家近期气候变化的基本特征(Chen et al, 2016; 徐新良等, 2016)。然而迄今为止,除欧洲中、西部有较多的千年气候变化序列外,其他大多数区域只有一些零星的气候变化高分辨率重建结果,尚缺乏对古丝绸之路历史时期气候变化的全面研究。为此,本文拟对古丝绸之路沿线区域(包括中国的西北地区、中亚、地中海东部、欧洲大陆)现有零星的历史气候变化研究成果进行总结和分析,旨在梳理这些研究已取得的主要科学认识,了解过去千年古丝绸之路温度变化的基本特征,讨论“中世纪气候异常期”(Medieval Climate Anomaly, MCA, 约950-1250年)和“小冰期”(Little Ice Age, LIA, 约1450-1850年)(IPCC, 2013)这2个百年尺度冷、暖阶段对应的干湿特征。这不仅可为了解相关区域当代资源环境问题的历史演化过程提供简要参考,而且对进一步深入开展上述问题研究也具有重要学术价值。
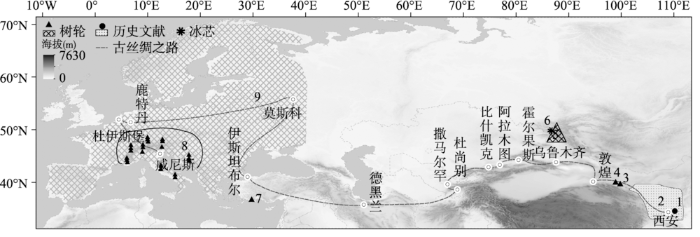
至今为止,古丝绸之路沿线的千年温度变化高分辨率重建序列主要集中在中国西北和欧州中西部地区,欧亚之交的土耳其西南部也有利用树轮资料重建的覆盖近千年温度变化序列,其中中国西北东部(包括关中地区)还有利用历史物候记载重建的7-14世纪温度变化结果(图1)。表1给出这些温度变化高分辨率记录的简要信息。此外,还有一些研究(Lamb, 1977; Finné et al, 2011)综合利用各种气候变化代用证据对欧洲过去2000年温度的百年尺度变化阶段进行过分析。综合分析这些结果,可得各个区域的温度变化基本特征如下。
表1 古丝绸之路沿线千年温度变化高分辨率重建序列简介
Tab.1 Summary information of high-resolution proxy-based temperature reconstruction for the past millennium along the Ancient Silk Road
| 序号 | 地区/点 | 代用证据 | 区域范围或 样点经纬度 | 样点海拔/m | 重建指标 | 温度变化解释方差 | 重建时段 | 时间分辨率/a | 来源 | |
|---|---|---|---|---|---|---|---|---|---|---|
| 1 | 关中地区 | 历史文献 | 33.6ºN~35.8ºN, 106.3ºE~110.6ºE | 10-4月平均气温 | 35%(年际) | AD600-AD902 | 1~30 | Liu et al, 2016 | ||
| 2 | 西北地区 东部 | 历史文献 | 33.5ºN~39.5ºN, 102ºE~112ºE | 年平均气温 | 85%(30年 低通滤波) | AD960-AD1368 | 30 | 郝志新等, 2009 | ||
| 3 | 祁连山 中段 | 树轮宽度 | 38.43ºN, 99.93ºE | 3400-3550 | 12-4月平均气温 | 22%(年际) | AD900-AD2000 | 1 | Liu et al, 2005 | |
| 4 | 祁连山 | 树轮宽度 | 38.69ºN~38.72ºN, 99.67ºE~99.70ºE | 3300-3578 | 1-8月平均最低气温 | 59%(年际) | AD670-AD2012 | 1 | Zhang et al,2014 | |
| 5 | 阿尔泰山 | 树轮宽度,多个样点综合 | 45ºN~50ºN, 85ºE~90ºE | 6-8月平均气温 | 24%(年际) | AD104-AD2011 | 1 | Büntgen et al, 2016 | ||
| 6 | 别卢哈山 | 冰芯氧同位素(δ18O)含量 | 49.8ºN, 86.6ºE | 4062 | 3-11月平均气温 | 68%(年代际) | AD1250-AD2001 | 10 | Eichler et al, 2009 | |
| 7 | 土耳其西 南部 | 树轮碳同位素(δ13C)变化 | 36.6ºN, 30.0ºE, | 1850-2020 | 1-5月平均气温 | 27%(年际) | AD1125-AD2006 | 1 | Heinrich et al, 2013 | |
| 8 | 欧洲中部 | 树轮宽度,多个样点综合 | 40ºN~50ºN, 5ºE~20ºE | 6-8月平均气温 | 51%(年际);84%(60年低通滤波) | 500BC-AD2000 | 1 | Büntgen et al, 2011 | ||
| 9 | 欧洲大部 | 树轮、文献等多种证据集成 | 35ºN~70ºN, 10ºW~40ºE | 6-8月平均气温 | 66%(年至31年带通滤波) | 138BC-AD2003 | 1 | Luterbacher et al, 2016 |
图1 利用代用资料重建的古丝绸之路沿线千年温度变化高分辨率序列空间分布①(①图中数字1-9为
Fig.1 Locations of high-resolution proxy-based temperature reconstruction for the past millennium along the Ancient Silk Road
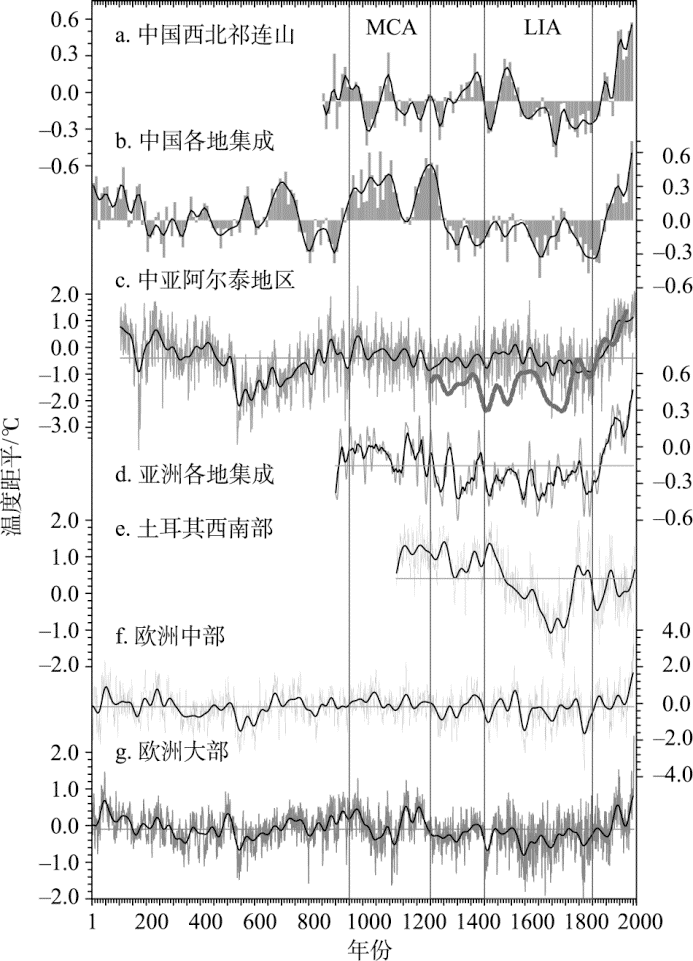
中国西北地区有自然及农时物候等文献记录,可用于数百年时段的区域温度变化重建和古今温度差异的对比分析,同时也有树轮可用于连续的千年温度变化序列重建。其中源于历史文献记载的温度重建结果显示,唐代关中地区的气候可能较20世纪后期更为温暖,公元600-800年间,关中地区冬半年(10-4月平均)温度较1961-1990年均值高0.4℃以上(Liu et al, 2016)。此后至10世纪中期,气候转冷;但至960年前后,中国西北东部的温度又大致回暖至1951-1980年水平,然后继续在波动中逐渐趋暖。其中960s-1040s,气候增暖;至1040s-1110s,该区域温度可能较1951-1980年均值约高0.5~1.0℃;1110s以后气候迅速转冷;但至12世纪末,再次转暖,不过转暖过程持续时段较短;至1260年之后,温度迅速下降,自13世纪末进入寒冷期(郝志新等, 2009)。来自祁连山森林上限树轮重建温度变化序列(Liu et al, 2005; Zhang et al, 2014)也显示,该地区9世纪末-10世纪、11世纪后期、14世纪后期-15世纪前期、16世纪及20世纪气候相对温暖,其中暖峰分别出现在890s、930s、1090s、1410s、1520s-1540s、1940s-1950s和1980s-1990s;其余时段,特别是16世纪末-19世纪气候寒冷,其中冷谷分别出现在1010s、1150s、1210s、1280s-1290s、1450s-1480s、1700s-1720s、1790s和1820s-1840s(图2a)。
图2 古丝绸之路沿线地区的千年温度变化(a, c, e, f, g)及其与中国(b)和亚洲(d)温度变化的对比
(a. 中国西北的祁连山地(
Fig.2 Temperature variations during the past millennium along the Ancient Silk Road (a, c, e, f, g), and over China (b) and Asia (d)
(a. Qilian mountain of Northwestern China (the mean of series 3 and 4 in
上述证据表明,中国的关中至河西走廊地区存在与北半球多数区域MCA对应的温暖气候;但同中国(图2b;Ge et al, 2013)、亚洲(图2d;Shi et al, 2015)及其他大洲的温度变化序列(PAGES 2k Consortium, 2013)对比表明:这一地区在MCA并未持续温暖,其间曾数次出现数十年至百年的寒冷时段,且950-1250年间的时段平均温度及其间最暖百年的温度可能均较20世纪低。因为树轮重建的祁连山温度变化序列显示,在1100年以后,气温曾出现显著下降,这与根据历史文献记载的西北地区东部自1110s起气候迅速转冷的特征基本一致。文献记载显示:在1170s前后,西夏境内的“贺兰山尊,冬夏降雪”;海拔更高的“积雪大山”(即祁连山)更是“冬夏降雪,雪体不融”,仅“南边雪化”;且当时大麦、燕麦至九月才成熟收获;据此估计该区域最冷年代的气温应较1951-1980年均值约低1.0℃(郝志新等, 2009)。上述树轮记录(图2a)也显示,自1100年气温快速下降以后,尽管在12世纪末和13世纪中期前后,气候曾出现短暂回暖,但整个12-13世纪气候一直处于较寒冷水平。而16世纪末-19世纪气候寒冷则与北半球总体处于LIA的特点基本对应。
中亚至地中海东部地区有树轮、冰芯、湖泊沉积、洞穴石笋等自然证据。其中位于中亚的阿尔泰山已积累了多个地点的树轮资料,集成这些资料重建的夏季(6-8月)气温序列(图2c;Büntgen et al, 2016)显示,该地区公元2-4世纪尽管曾出现过多个极端低温年份,但气候总体温暖;5-6世纪前期,温度在波动中快速下降。536-660年,气候显著寒冷,被称为“晚古典时代小冰期”(Late Antique Little Ice Age;LALIA),与当时欧洲的大规模人口迁徙、疫病流行、社会动荡、政治混乱和文化衰落等特征相对应(Büntgen et al, 2011)。此后,气候在波动中回暖;9-12世纪,气候总体温暖,但其间曾在940年前后出现过短暂的剧烈降温。12世纪末起,气候相对转冷,并维持在相对寒冷的水平上波动至15世纪后期,其中冷谷分别出现在1200年、1250年、1320年、1380年和1450年前后。16世纪再度回暖至过去2000年平均水平,但在1540年和1590年前后曾出现显著降温。自17世纪初起,气候又再度转冷,并维持在较寒冷水平上波动直至19世纪中期。19世纪后期起,气候快速回暖,持续至20世纪。对比显示,尽管历史上曾多次出现与20世纪后期温暖年份相似的极端高温年,但20世纪后期是这一地区自公元2世纪以来的最温暖时段;且这一地区MCA和LIA间的温度相差仅约0.3℃,不如其他地区显著;当然这可能与该重建序列方差解释量仅24%(表1),因而无法揭示温度变化的大部分变幅有关。利用俄罗斯南部别卢哈山(Belukha)冰芯δ18O重建的1250年以来温度年代际变化记录也显示:在1450年和1540年前后,温度曾显著下降,1650-1760年为显著冷期,而1850年之后气候又迅速增暖(Eichler et al, 2009);这与阿尔泰山树轮资料所显示的冷暖波动过程基本一致,只是其温度变幅更大,且自LIA冷谷至20世纪末的增暖趋势也更为显著,而这也可能与其所处位置的海拔更高有关。
欧亚之交的土耳其也有利用树轮重建的1125-2006年温度变化序列(图2e;Heinrich et al, 2013),结果显示:12-15世纪,这一地区尽管曾在1270年、1330年、1380年和1440年前后出现年代尺度的显著降温事件,但其间的气候却相对温暖,且持续时间也相对较长;直至16世纪起,才出现明显的百年尺度降温过程,因此其进入小冰期的时间也较晚,其中冷谷分别在1690s和1740s。此后至1800年前后,气候回暖;然后呈现典型的多年代尺度波动直至21世纪初;但整个20世纪却未像全球其他大多数区域一样持续快速增暖,仅20世纪末期温度有显著上升。这可能是该区域树轮资料的空间代表性有限所致(Touchan et al, 2007)。尽管如此,该序列所揭示的12-15世纪末几次年代尺度显著降温事件以及小冰期的最寒冷时段,与上述阿尔泰地区曾出现的转冷事件和寒冷期基本一致。
地中海东部及以东毗邻区虽然高分辨气候变化序列匮乏,但有近百个地点的湖泊、海湾、沼泽等沉积物和洞穴石笋资料。(Finné等(2011))综合分析了这些记录后确认,这一地区气候存在较为显著的百年尺度冷暖波动,其中公元初前后气候温暖,这一暖期大致持续至4世纪;其后的5-6世纪显著偏冷;600-850年间,这一地区温暖气候证据较多,且没有明确的寒冷事件,这与当时中国的隋唐暖期基本一致。850-950年,气候再度寒冷,但程度相对较弱。MCA出现在950-1300年间,气候显著温暖。LIA出现在1400-1870年间,是过去2000年中持续时间最长的显著冷期。1870年以后,气候快速转暖。但由于这些记录时间分辨率常达数十年以上,且多数记录存在一定的测年误差,因此只能指示百年时段的冷暖阶段变化,而无法定量估计各冷暖期的温度变幅和其间的年代至多年代尺度温度波动。
欧洲具有丰富的气候变化代用资料,如树轮、植被分布、农作物种植范围及收获期、冰川与冰缘活动、湖泊纹层沉积物等,且相关研究也较为深入。(Lamb(1977))曾总结了欧洲地区20世纪80年代前所获取的代用证据,初步描绘了过去2000年的冷暖阶段变化。结果显示:自公元前1世纪起,欧洲(特别是西欧及其周边地区)气候温暖,并持续了数百年;约至公元4世纪中期转为寒冷,此后则数度波动(其中5-6世纪、7世纪后期-8世纪前期、9世纪中期-10世纪前期寒冷,其他时段则短暂回暖),直至10世纪以后又再度明显转暖,11-13世纪温暖,14世纪从温暖转为寒冷,15-19世纪寒冷,20世纪又再度回暖;温暖时段与寒冷时段之间的温度差异大致为1~2℃。(Lamb(1977))还采用“中世纪暖期”(Medieval Warm Period/Epoch, Medieval Climatic Optimum, Little Climatic Optimum,约10-13世纪)和“小冰期”(约15-19世纪)等术语描述这种百年尺度的冷暖阶段,其中小冰期中最寒冷时段为1550-1700年。此后,又有学者将Lamb划分的公元前1世纪至公元4世纪中期的温暖及其后的寒冷期(约4世纪末-10世纪前期)分别称为“罗马暖期”(Roman Warm Period)和“黑暗时代冷期”(Dark Ages Cold Period)(Bianchi et al, 1999; Patterson et al, 2010);得出欧洲过去2000年温度变化呈2暖(罗马暖期、中世纪暖期)、2冷(黑暗时代冷期、小冰期)及其后20世纪再度显著增暖的基本特征。
最近20年,欧洲又获取了大量的高分辨率气候变化代用证据(Luterbacher et al, 2012; PAGES 2k Consortium, 2013, 2017),且多次集成重建了欧洲大部的过去2000年分辨率达年至年代的温度变化序列。最新的欧洲夏季温度变化重建结果(图2g;Luterbacher et al, 2016)显示,公元1-3世纪、8-10世纪和12世纪后期-13世纪前期、20世纪欧洲夏季气候温暖,且1世纪、10世纪和12世纪后期-13世纪前期的温暖程度与20世纪基本相当,其中1世纪甚至还较20世纪高约0.1℃;而4-7世纪和14-19世纪寒冷。这一结果也与早先重建的欧洲中部夏季温度变化(图2f;Büntgen et al, 2011)基本一致,仅在1020-1060年和1190-1230年2个时段二者有显著差异。这不仅证明欧洲大多数地区的温度长期变化可能具有较好一致性;同时也再次证实了(Lamb(1977))划分的百年尺度冷暖阶段变化特征。
表2进一步给出根据上述2个欧洲夏季温度变化序列的30年FFT平滑曲线(图2f, 2g)划分的持续百年以上冷暖期的重叠时段,以及其间各个暖期欧洲大部的最暖百年、冷期的最冷百年和显著的30年暖峰与冷谷。结果显示:第1个暖期为33-288年,大致与罗马暖期对应。其中最暖百年出现在暖期之初的33-132年,温度较1850-1950年高约0.3℃;且整个时段存在多年代尺度波动和弱转冷趋势;3个暖峰(33-62年、111-140年和228-257年)温度分别较1850-1950年高约0.6℃、0.3℃和0.2℃,冷谷(150-179年)则低约0.3℃。第1个冷期为308-660年,基本对应“晚古典时代小冰期”,也与中国的魏晋南北冷期(约250-550年)大部分重叠;含2个显著冷谷和1个短暂暖峰。其间最冷百年(536-635年)温度较1850-1950年低约0.4℃;2个冷谷(329-358年和536-565年)分别低约0.5℃和0.7℃;暖峰(481-510年)则高约0.3℃。
表2 欧洲过去2000年夏季温度变化序列揭示的冷暖期及其暖峰与冷谷
Table 2 Cold and warm periods revealed by the summer temperature reconstruction series during the past 2000 years in Europe
| 持续百年以上的冷暖期 | 暖期1 | 冷期1 | 暖期2 | 冷期2 | 暖期3 | 冷期3 | 20世纪暖期 |
|---|---|---|---|---|---|---|---|
| 起讫时间/AD 温度距平/ºC | 33-288 0.1 | 308-660 -0.2 | 670-1028 0.1 | 1029-1136 -0.3 | 1137-1251 0.3 | 1275-1860 -0.3 | 1901-2000 0.2 |
| 最暖百年/AD 温度距平/ºC | 33-132 0.3 | 427-526 0.0 | 911-1010 0.3 | 1037-1136 -0.3 | 1137-1236 0.3 | 1353-1452 -0.1 | |
| 最暖30年/AD 温度距平/ºC | 33-62 0.6 | 481-510 0.3 | 726-755 0.2 | 1077-1106 0.0 | 1141-1170 0.5 | 1400-1429 0.0 | 1924-1953 0.5 |
| 111-140 0.3 | 964-993 0.5 | 1198-1217 0.5 | 1532-1561 0.0 | 1985-2003 0.8 | |||
| 228-257 0.2 | 1752-1782 -0.1 | ||||||
| 最冷百年/AD 温度距平/ºC | 138-237 -0.1 | 536-635 -0.4 | 773-872 -0.1 | 1032-1131 -0.3 | 1151-1250 0.3 | 1579-1678 -0.5 | |
| 最冷30年/AD 温度距平/ºC | 150-179 -0.3 | 329-358 -0.5 | 796-825 -0.3 | 1029-1058 -0.4 | 1329-1358 -0.4 | 1955-1984 0.0 | |
| 536-565 -0.7 | 1107-1136 -0.5 | 1453-1482 -0.6 | |||||
| 1579-1608 -0.8 | |||||||
| 1672-1701 -0.6 | |||||||
| 1812-1841 -0.6 |
欧洲大部分地区的第2个暖期出现在670-1028年,包含2个温暖时段和其间的偏冷时段。其中第1温暖时段约在670-780年间,时段温度平均较1850-1950年高约0.1℃,其间暖峰(726-755年)则高0.2℃以上;此后至870年前后则气候转冷,其间冷谷(796-825年)温度较1850-1950年低约0.3℃;这与中国唐代盛期的温暖气候及其后的转冷基本一致。第2温暖时段在10世纪前后,与MCA前期基本对应,其中最暖百年为911-1010年,温度较1850-1950年高约0.3℃,其中暖峰(964-993年)则高0.5℃。1029-1136年,欧洲大部分地区气候相对偏冷,温度较1850-1950年低约0.3℃;其间2个冷谷出现在1029-1058年和1107-1136年间,温度则分别低0.4℃和0.5℃,而其中的第1个冷谷还与奥尔特太阳黑子极小期(Oort Minimum;1010-1050 年)大致对应。值得注意的是,这一时期欧洲中部(图2f)的温度大致与过去2000年平均水平相当,并未明显寒冷,这可能是温度波动的区域差异所致。因为(Luterbacher等(2016))的研究还显示:在11世纪,欧洲北部温暖程度更显著,但中部和西南部,夏季气温相对偏低;在13世纪中期和15世纪中期,欧洲东北部降温显著,其他区域却不甚明显;而在17世纪末和19世纪上半叶,显著降温区则主要分布在欧洲南部。
欧洲大部分地区的第3个暖期出现在1137-1251年间,位于MCA后期,与中世纪太阳黑子极大期(Medieval Maximum, 约1100-1250 年)基本对应;尽管其持续时间相对较短,却可能是欧洲地区温暖程度最显著的暖期。因为其间温度平均较1850-1950年高约0.3℃,大致与罗马暖期的最暖百年相当,较20世纪平均还高约0.1℃;其中2个暖峰(1141-1170年和1198-1217年)均较1850-1950年高约0.5℃,与20世纪的最暖30年温度也基本一致。此后气候转冷,于1275年前后进入过去2000年间持续最长的寒冷期,至1860年前后才结束,其间涵盖了整个LIA。这一冷期持续时间长,温度存在较显著的多年代至百年尺度波动:冷谷出现在1329-1358年、1453-1482年、1579-1608年、1672-1701年和1812-1841年间,分别较1850-1950年低0.4℃、0.6℃、0.8℃、0.6℃和0.6℃;最冷百年为1579-1678年,较1850-1950年低约0.5℃。即使是其中的相对暖峰,其温度也仅与1850-1950年均值相当。1860年以后,欧洲气候在波动中快速转暖,其中20世纪温度较1850-1950年高0.2℃;其间暖峰1924-1953年高约0.5℃,相对寒冷的1955-1984年与1850-1950年均值相当;此后温度又快速上升,至21世纪初超出了过去2000年的最暖水平。
古丝绸之路沿线干湿气候型有半湿润、半干旱、干旱、夏干冬湿和终年常湿润等,特别是其中横跨中、西亚干旱区,降水变化的区域与季节差异极大。且因代用证据常受局地降水影响,样点(区)的降水、干湿或旱涝气候重建结果的空间、季节代表性有限,且空间覆盖度不一,因而本文重点关注代用资料相对丰富的区域,包括:中国关中平原与河西走廊、中亚和欧洲等。
重建的960-2010年关中平原干湿指数序列(郝志新等, 2017)显示,关中平原的干湿变化以年际至百年的多尺度波动为主要特征,存在3~7a、准10a、准30a、准70a及准100a周期;因而MCA(950-1250年)和LIA(1450-1850)之间,关中平原的干湿指数并无显著差异。然而,进一步统计却显示:在MCA间,关中平原旱年(干湿指数<2.5)的发生频率为26.8%,涝年(干湿指数>3.5)为24.4%,极端旱年(干湿指数<2.0)的发生频率仅0.7%,极端涝年(干湿指数>4.0)为4.8%;而LIA间,旱、涝年的发生频率均为20.9%,极端旱、涝年分别达7.2%和6.5%;说明MCA间,关中平原的干湿变率较LIA大,出现旱、涝频率更高;但LIA却更易出现极端旱涝事件。
河西走廊是丝绸之路的主要廊道。根据祁连山中部树轮资料重建的该地775-2006年降水序列(Zhang et al, 2011)显示,降水变化同样存在显著的2~3年、34~58年和73~147年等年际至百年尺度的周期波动,因此MCA和LIA之间的降水均值也基本一致;但进一步统计也表明:在MCA间,河西走廊旱(低于序列均值的0.65倍方差)、涝(高于序列均值的0.65倍均方差)年的发生频率分别为24.6%和27.6%,极端旱、涝(分别低于、高于序列的均值1.645倍方差)的发生频率分别为6.6%和4.7%;而LIA的旱、涝年的发生频率分别仅为18.5%和17.5%,极端旱、涝年发生频率分别为6.2%和0.7%。同样说明:MCA间,河西走廊的干湿变率较LIA大,出现旱、涝频率更高;但LIA出现极涝事件频率却较低。
中亚是受西风带环流控制的干旱区,对17个地点、覆盖范围为50ºE~105ºE且长度达千年以上的干湿变化代用资料分析表明,整个中亚干旱区年代际至百年尺度的干湿变化具有较好同步性。据此选用其中分辨率达10年的5个代表性地点干湿代用指标进行集成重建的亚洲中部干旱区过去1000年湿润指数序列显示,在MCA大部分时段(1000-1250年),这一地区气候显著偏干;而在LIA起始阶段(1450-1550年),气候显著转湿,此后一直维持相对偏湿状态直至1850年前后LIA结束(Chen et al, 2010)。可见,中亚地区在MCA和LIA期间的干湿存在差异。MCA期间中亚气候偏干,这与北美中纬度地区、非洲北部等许多地区在MCA期间气候偏干的特征一致(Diaz et al, 2011);而LIA期间中亚气候则偏湿。
欧洲超过2000年的降水与干湿重建主要集中在欧洲中部树轮资料样点密集区域,Büntgen等(2011)重建的过去2500年欧洲中部(约6°E~12°E,48°N~52°N)4-6月降水量序列显示:相对于20世纪平均值,公元250年之前,欧洲中部降水较多,但总体呈减少趋势;公元250-550年,降水曾出现一次明显的先增后减波动,年代际波动幅度达100 mm左右;6世纪中叶-10世纪初,降水在波动中呈增加趋势,此后至10世纪后期则快速减少;但自10世纪末起,欧洲中部降水又呈显著的年代至世纪尺度波动,且波动幅度也显著缩小,其中在12-14世纪与18世纪降水相对偏多,11世纪、15-17世纪和19-20世纪相对偏少。对比这一序列在MCA和LIA间的降水均值发现,LIA的降水均值较MCA多7.9%,均方差大19.3%;说明欧洲中部地区LIA的气候可能较MCA更为湿润,但变率更大。
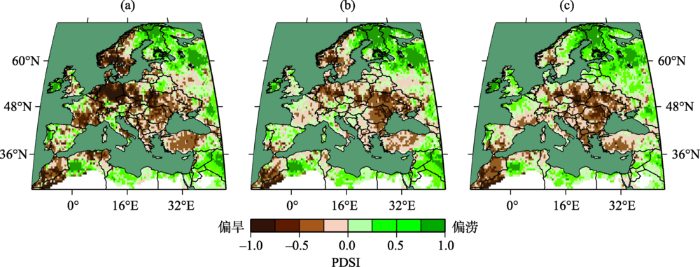
近1000年欧洲的树轮资料更为丰富,据此Cook等(2015)据此重建了全欧及地中海沿岸的亚洲、非洲区域格点帕尔默干旱指数(PDSI)图集,揭示了1315、1540、1616、1714、1893和1921年等欧洲几次重大旱涝灾害的空间分布。结果显示:除1315年大涝几乎波及整个欧洲外,其余5次干旱事件的发生区域存在差异,欧洲东北部在中西欧大旱时仍然相对湿润。对比1000-1200年、1550-1750年和1850-2012年3个时段的PDSI多年平均结果(图3)发现:在所有3个典型时段内,东欧的罗马尼亚和乌克兰等地均偏干;1000-1200年欧洲大陆中北部以及斯堪的纳维亚半岛南部比1550-1750年和1850-2012年更干,芬兰和斯堪的纳维亚半岛北部以及俄罗斯等则略湿;这也同样说明:欧洲大陆中北部以及斯堪的纳维亚半岛南部的广大区域MCA期间气候较LIA偏干。
图3 欧洲1000-1200年(a)、1550-1750年(b)和1850-2012年(c)的PDSI多年平均值(
Fig.3 The mean of Palmer drought severity index (PDSI) for 1000-1200 (a), 1550-1750 (b), and 1850-2012 (c) for Europe (
通过上述分析,可知过去2000年古丝绸之路经历了多次数十年至百年尺度的冷暖变化,其中1-3世纪、7世纪后期-11世纪初、12世纪中期-13世纪中期气候温暖;11世纪中期-12世纪初气候偏冷;4-7世纪前期气候寒冷、13世纪末-19世纪中期气候寒冷;20世纪气候快速增暖。古丝绸之路沿线各地均存在与北半球多数区域MCA与LIA大致对应的暖期和冷期,但不同区域间的年代至百年尺度变化位相不完全同步,波动幅度也存在差异。其中:中国的关中至河西走廊地区公元600-800年气候温暖,MCA的起止时间均较其他地区略早。中亚地区600-800年气候相对寒冷,MCA与LIA期间的温度差异相对较小。欧洲则是7世纪后期-11世纪初、12世纪中期-13世纪中期气候温暖,13世纪末至19世纪中期气候显著寒冷。同时,各地干湿特征在MCA和LIA也存在差异,其中中国的关中平原及河西走廊在MCA间的干湿变率较LIA大;中亚干旱区MCA期间气候偏干,LIA期间偏湿;欧洲中北部以及斯堪的纳维亚半岛南部等地在MCA间气候较LIA偏干,且中部地区LIA间的干湿变率较MCA大;芬兰和斯堪的纳维亚半岛北部以及俄罗斯等地MCA间的气候较LIA更湿润。这些认识可为了解古丝绸之路沿线区域资源环境与人类活动相互作用问题的历史演化过程提供简要参考,同时对进一步深入开展上述问题研究也具有重要意义。
然而,需要指出的是:至目前为止,除欧洲中、西部有较多的千年气候变化重建序列外,其他大多数区域只有一些零星的气候变化高分辨率重建结果,同时在广大的西亚和东欧地区,高分辨率气候变化重建结果极为匮乏;因而,本文只是对这一问题的初步分析,其结果仍存在不确定性和时空局限性,需要在未来相关研究中予以加强。
The authors have declared that no competing interests exist.
| [1] |
丝绸之路与泛第三极地区人类活动、环境变化和丝路文明兴衰 [J].Human activities, environmental changes, and rise and decline of Silk Road Civilization in Pan-Third Pole Region [J]. |
| [2] |
中国历朝气候变化 [M].Climate change in Chinese dynasties [M]. |
| [3] |
宋元时期中国西北东部的冷暖变化 [J].
<p>根据历史文献中的作物种植界线、种植制度变化、植物及异常气象水文物候等记载,并辅以树轮、湖泊沉积等自然证据指示的冷暖变化状况,分析了宋元时期(960~1368A.D.)我国西北地区东部的冷暖变化特征。主要结论是: 960A.D.前后,西北东部地区冷暖程度与今(即 1951~1980年)基本一致; 960s~1040s,气候逐渐增暖; 1040s~1110s,气候较今暖; 1110s以后,气候转冷; 12世纪末,气候又再次明显转暖; 1260A.D.之后,温度下降,自13世纪末进入寒冷期。西北东部的这一冷暖变化过程不但与毗邻地区湖泊、特别是树轮等所指示的冷暖变化过程较为一致,而且与中国东部地区的冷暖变化也基本一致,但13世纪后期的降温幅度较中国东部更为明显。</p>
Temperature variations during the Song and Yuan Dynasties (960-1368A. D.) in the eastern part of North West China [J].
<p>根据历史文献中的作物种植界线、种植制度变化、植物及异常气象水文物候等记载,并辅以树轮、湖泊沉积等自然证据指示的冷暖变化状况,分析了宋元时期(960~1368A.D.)我国西北地区东部的冷暖变化特征。主要结论是: 960A.D.前后,西北东部地区冷暖程度与今(即 1951~1980年)基本一致; 960s~1040s,气候逐渐增暖; 1040s~1110s,气候较今暖; 1110s以后,气候转冷; 12世纪末,气候又再次明显转暖; 1260A.D.之后,温度下降,自13世纪末进入寒冷期。西北东部的这一冷暖变化过程不但与毗邻地区湖泊、特别是树轮等所指示的冷暖变化过程较为一致,而且与中国东部地区的冷暖变化也基本一致,但13世纪后期的降温幅度较中国东部更为明显。</p>
|
| [4] |
关中平原过去1000年干湿变化特征 [J].Dryness and wetness variations for the past 1000 years in Guanzhong Plain [J]. |
| [5] |
“一带一路”战略的科学内涵与科学问题 [J].https://doi.org/10.11820/dlkxjz.2015.05.001 URL [本文引用: 1] 摘要
“一带一路”指“丝绸之路经济带”和“21世纪海上丝绸之路”,是中国为推动经济全球化深入发展而提出的国际区域经济合作新模式.其核心目标是促进经济要素有序自由流动、资源高效配置和市场深度融合,推动开展更大范围、更高水平、更深层次的区域合作,共同打造开放、包容、均衡、普惠的区域经济合作架构.“一带一路”框架包含了与以往经济全球化完全不同的理念,即“和平合作、开放包容、互学互鉴、互利共赢”,这正是丝绸之路文化内涵的体现.本文分析了“一带一路”战略与经济全球化及世界格局变化的关系;剖析了其空间内涵,认为“一带一路”具有多重空间内涵和跨尺度特征,是统筹中国全面对外开放的国家战略.最后,提出了推进“一带一路”建设为地理学提出的几个重要议题,包括地缘政治、国别地理、对外直接外资理论、交通运输优化组织等.
Scientific understanding of the Belt and Road Initiative of China and related research themes [J].https://doi.org/10.11820/dlkxjz.2015.05.001 URL [本文引用: 1] 摘要
“一带一路”指“丝绸之路经济带”和“21世纪海上丝绸之路”,是中国为推动经济全球化深入发展而提出的国际区域经济合作新模式.其核心目标是促进经济要素有序自由流动、资源高效配置和市场深度融合,推动开展更大范围、更高水平、更深层次的区域合作,共同打造开放、包容、均衡、普惠的区域经济合作架构.“一带一路”框架包含了与以往经济全球化完全不同的理念,即“和平合作、开放包容、互学互鉴、互利共赢”,这正是丝绸之路文化内涵的体现.本文分析了“一带一路”战略与经济全球化及世界格局变化的关系;剖析了其空间内涵,认为“一带一路”具有多重空间内涵和跨尺度特征,是统筹中国全面对外开放的国家战略.最后,提出了推进“一带一路”建设为地理学提出的几个重要议题,包括地缘政治、国别地理、对外直接外资理论、交通运输优化组织等.
|
| [6] |
丝绸之路与东西文化交流 [M].Silk Road and cultural interaction between East and West [M]. |
| [7] |
“丝绸之路经济带”沿线主要国家气候变化特征 [J].https://doi.org/10.18402/resci.2016.09.12 URL Magsci [本文引用: 1] 摘要
基于美国国家气候中心发布的全球气象站点日数据,利用克里金插值、线性趋势法、累计距平曲线法、Mann-Kendall显著性检验和多尺度区域统计等方法,系统阐述了“丝绸之路经济带”主要国家1980-2014年气温和降水的变化趋势和空间分布特征。结果表明,研究区近35 年以0.4℃/10a的速率呈现明显升温态势,30.1%的区域升温显著,0.03%的区域降温显著。各国普遍在20世纪末进入偏暖阶段。降水以减少为主,却仅有0.19%的区域减少显著,零星分布于沙特阿拉伯和中国的西部。南亚1991年后进入降水偏多阶段,其余地区多在1999年后进入降水偏少阶段。该成果能够为相关国家在“一带一路”战略的统领下解决和应对气候变化问题提供科学依据和有益参考。
Spatio-temporal characteristics of climate change in the Silk Road Economic Belt [J].https://doi.org/10.18402/resci.2016.09.12 URL Magsci [本文引用: 1] 摘要
基于美国国家气候中心发布的全球气象站点日数据,利用克里金插值、线性趋势法、累计距平曲线法、Mann-Kendall显著性检验和多尺度区域统计等方法,系统阐述了“丝绸之路经济带”主要国家1980-2014年气温和降水的变化趋势和空间分布特征。结果表明,研究区近35 年以0.4℃/10a的速率呈现明显升温态势,30.1%的区域升温显著,0.03%的区域降温显著。各国普遍在20世纪末进入偏暖阶段。降水以减少为主,却仅有0.19%的区域减少显著,零星分布于沙特阿拉伯和中国的西部。南亚1991年后进入降水偏多阶段,其余地区多在1999年后进入降水偏少阶段。该成果能够为相关国家在“一带一路”战略的统领下解决和应对气候变化问题提供科学依据和有益参考。
|
| [8] |
Holocene periodicity in North Atlantic climate and deep-ocean flow south of Iceland [J].https://doi.org/10.1038/17362 URL [本文引用: 1] 摘要
Nature is the international weekly journal of science: a magazine style journal that publishes full-length research papers in all disciplines of science, as well as News and Views, reviews, news, features, commentaries, web focuses and more, covering all branches of science and how science impacts upon all aspects of society and life.
|
| [9] |
Cooling and societal change during the Late Antique Little Ice Age from 536 to around 660 AD [J].https://doi.org/10.1038/ngeo2652 URL [本文引用: 1] 摘要
Climatic changes during the first half of the Common Era have been suggested to play a role in societal reorganizations in Europe and Asia. In particular, the sixth century coincides with rising and falling civilizations, pandemics, human migration and political turmoil. Our understanding of the magnitude and spatial extent as well as the possible causes and concurrences of climate change during this period is, however, still limited. Here we use tree-ring chronologies from the Russian Altai and European Alps to reconstruct summer temperatures over the past two millennia. We find an unprecedented, long-lasting and spatially synchronized cooling following a cluster of large volcanic eruptions in 536, 540 and 547 AD (ref.), which was probably sustained by ocean and sea-ice feedbacks, as well as a solar minimum. We thus identify the interval from 536 to about 660 AD as the Late Antique Little Ice Age. Spanning most of the Northern Hemisphere, we suggest that this cold phase be considered as an additional environmental factor contributing to the establishment of the Justinian plague, transformation of the eastern Roman Empire and collapse of the Sasanian Empire, movements out of the Asian steppe and Arabian Peninsula, spread of Slavic-speaking peoples and political upheavals in China. 2016 Macmillan Publishers Limited. All rights reserved.
|
| [10] |
2500 years of European climate variability and human susceptibility [J].https://doi.org/10.1126/science.1197175 URL [本文引用: 2] |
| [11] |
Moisture changes over the last millennium in arid Central Asia: A review, synthesis and comparison with monsoon region [J].https://doi.org/10.1016/j.quascirev.2010.01.005 URL [本文引用: 1] 摘要
There is a strong chance that 20th century warming will cause differences in precipitation distribution, hydrological cycle and effective moisture changes over the globe. Arid central Asia (ACA), a unique dry-land area whose atmospheric circulation is dominated today by the westerlies, is one of the specific regions that are likely to be strongly impacted by global warming. An understanding of past variations in effective moisture in such regions is an important prerequisite for the prediction of future hydrological change. Here we evaluate spatial and temporal patterns of effective moisture variations documented by different proxies from 17 records in ACA, and synthesize a decadal-resolution moisture curve for ACA over the past millennium, using 5 of the 17 records selected on the basis of reliable chronologies and robust proxies. The high- and low-resolution data all show that, over the past millennium, ACA has been characterized by a relatively dry Medieval Warm Period (MWP; the period from 1000 to 1350 AD), a wet Little Ice Age (LIA; from 1500 to 1850 AD) and increasing moisture during recent decades. As a whole, the LIA in the ACA was not only relatively humid but also had high precipitation. Over the past millennium, the multi-centennial moisture changes in ACA show a generally inverse relationship with the temperature changes in the Northern Hemisphere, China, and western central Asia. The effective moisture history in ACA also shows an out-of-phase relationship with that in monsoon Asia (especially during the LIA). We propose that the humid LIA in ACA, possibly extending to Mediterranean Sea and Western Europe, may have resulted from increased precipitation due to more frequent mid-latitude cyclone activities as a result of the strengthening and equator-ward shift of the westerly jet stream, and the predominantly negative North Atlantic Oscillation conditions, coupled with a decrease in evapotranspiration caused by the cooling at that time.
|
| [12] |
Water and ecological security: Dealing with hydroclimatic challenges at the heart of China's Silk Road [J].https://doi.org/10.1007/s12665-016-5385-z URL [本文引用: 1] 摘要
The Tarim Basin is the heart of China’s Silk Road Economic Belt. The contradiction between economic growth and environmental protection is particularly evident in the basin region. For the past...
|
| [13] |
Old World megadroughts and pluvials during the Common Era [J].https://doi.org/10.1126/sciadv.1500561 URL PMID: 4640589 [本文引用: 3] 摘要
An atlas of megadroughts in Europe and in the Mediterranean Basin during the Common Era provides insights into climate variability. Climate model projections suggest widespread drying in the Mediterranean Basin and wetting in Fennoscandia in the coming decades largely as a consequence of greenhouse gas forcing of climate. To place these and other “Old World” climate projections into historical perspective based on more complete estimates of natural hydroclimatic variability, we have developed the “Old World Drought Atlas” (OWDA), a set of year-to-year maps of tree-ring reconstructed summer wetness and dryness over Europe and the Mediterranean Basin during the Common Era. The OWDA matches historical accounts of severe drought and wetness with a spatial completeness not previously available. In addition, megadroughts reconstructed over north-central Europe in the 11th and mid-15th centuries reinforce other evidence from North America and Asia that droughts were more severe, extensive, and prolonged over Northern Hemisphere land areas before the 20th century, with an inadequate understanding of their causes. The OWDA provides new data to determine the causes of Old World drought and wetness and attribute past climate variability to forced and/or internal variability.
|
| [14] |
Spatial and temporal characteristics of climate in Medieval Times Revisited [J].https://doi.org/10.1175/BAMS-D-10-05003.1 URL [本文引用: 1] 摘要
Developing accurate reconstructions of past climate regimes and enhancing our understanding of the causal factors that may have contributed to their occurrence is important for a number of reasons; these include improvements in the attribution of climate change to natural and anthropogenic forcing, gaining a better appreciation for the range and magnitude of low-frequency variability and previous climatic regimes in comparison with the modern instrumental period, and developing greater insights into the relationship between human society and climatic changes. This paper examine upto- date evidence regarding the characteristics of the climate in medieval times (A.D. ~950 1400). Long and high-resolution climate proxy records reported in the scientific literature, which form the basis for the climate reconstructions, have greatly expanded in the last few decades, with greater numbers of sites that now cover more areas of the globe. Some comparisons with the modern climate record and discussion of potential mechanisms associated with the patterns of medieval climate are presented here, but our main goal is to provide the reader with some appreciation of the richness of past natural climate variability in terms of its spatial and temporal characteristics.
|
| [15] |
Temperature response in the Altai region lags solar forcing [J].
The role of the sun on Earth's climate variability is still much debated. Here we present an ice core oxygen isotope record from the continental Siberian Altai, serving as a high-resolution temperature proxy for the last 750 years. The strong correlation between reconstructed temperature and solar activity suggests solar forcing as a main driver for temperature variations during the period 1250...
|
| [16] |
Climate in the eastern Mediterranean, and adjacent regions, during the past 6000 years: A review [J].https://doi.org/10.1016/j.jas.2011.05.007 URL [本文引用: 2] 摘要
The eastern Mediterranean, with its long archaeological and historical records, provides a unique opportunity to study human responses to climate variability. We review paleoclimate data and reconstructions from the region with a focus on the last 6000 years. We aim to provide an up-to-date source of information on climate variability and to outline present limitations and future opportunities. The review work is threefold: (1) literature review, (2) spatial and temporal analysis of proxy records, and (3) statistical estimation of uncertainties in present paleoclimate reconstructions (temperature, C). On a regional scale the review reveals a wetter situation from 6000 to 5400 yrs BP (note: all ages in this paper are in calibrated years before present (i.e. before 1950), abbreviated yrs BP, unless otherwise stated). This is followed by a less wet period leading up to one of fully-developed aridity from c. 4600 yrs BP. There is a need for more high-resolution paleoclimate records, in order to (i) better understand regional patterns and trends versus local climate variability and to (ii) fill the gap of data from some regions, such as the Near East, Greece and Egypt. Further, we evaluate the regional occurrence of a proposed widespread climate event at 4200 yrs BP. This proposed climate anomaly has been used to explain profound changes in human societies at different locations in the region around this time. We suggest that although aridity was widespread around 4200 yrs BP in the eastern Mediterranean region, there is not enough evidence to support the notion of a climate event with rapidly drying conditions in this region.
|
| [17] |
Temperature changes over the past 2000 yr in China and comparison with the Northern Hemisphere [J].https://doi.org/10.5194/cp-9-1153-2013 URL [本文引用: 3] 摘要
We use principal component regression and partial least squares regression to separately reconstruct a composite series of temperature variations in China, and associated uncertainties, at a decadal resolution over the past 2000 yr. The reconstruction is developed using proxy temperature data with relatively high confidence levels from five regions across China, and using a temperature series from observations by the Chinese Meteorological Administration, covering the period from 1871 to 2000. Relative to the 1851-1950 climatology, our two reconstructions show four warm intervals during AD 1 AD 200, AD 551 AD 760, AD 951 AD 1320, and after AD 1921, and four cold intervals during AD 201 AD 350, AD 441 AD 530, AD 781 AD 950, and AD 1321 AD 1920. The temperatures during AD 981 AD 1100 and AD 1201 AD 1270 are comparable to those of the Present Warm Period, but have an uncertainty of +0.28 C to 0.42 C at the 95 % confidence interval. Temperature variations over China are typically in phase with those of the Northern Hemisphere (NH) after 1000, a period which covers the Medieval Climate Anomaly, the Little Ice Age, and the Present Warm Period. In contrast, a warm period in China during AD 541 AD 740 is not obviously seen in the NH.
|
| [18] |
Winter-to-spring temperature dynamics in Turkey derived from tree rings since AD 1125 [J].https://doi.org/10.1007/s00382-013-1702-3 URL [本文引用: 1] 摘要
In the eastern Mediterranean in general and in Turkey in particular, temperature reconstructions based on tree rings have not been achieved so far. Furthermore, centennial-long chronologies of stable isotopes are generally also missing. Recent studies have identified the tree species Juniperus excelsa as one of the most promising tree species in Turkey for developing long climate sensitive stable carbon isotope chronologies because this species is long-living and thus has the ability to capture low-frequency climate signals. We were able to develop a statistically robust, precisely dated and annually resolved chronology back to AD 1125. We proved that variability of 13 C in tree rings of J. excelsa is mainly dependent on winter-to-spring temperatures (January ay). Low-frequency trends, which were associated with the medieval warm period and the little ice age, were identified in the winter-to-spring temperature reconstruction, however, the twentieth century warming trend found elsewhere could not be identified in our proxy record, nor was it found in the corresponding meteorological data used for our study. Comparisons with other northern-hemispherical proxy data showed that similar low-frequency signals are present until the beginning of the twentieth century when the other proxies derived from further north indicate a significant warming while the winter-to-spring temperature proxy from SW-Turkey does not. Correlation analyses including our temperature reconstruction and seven well-known climate indices suggest that various atmospheric oscillation patterns are capable of influencing the temperature variations in SW-Turkey.
|
| [19] |
Climate change 2013: The physical science basis. Contribution of working group I to the fifth assessment report of the Intergovernmental Panel on Climate Change [M]. |
| [20] |
Coincidence of abandoned settlements and climate change in the Xinjiang oases zone during the last 2000 years [J].https://doi.org/10.1007/s11442-017-1424-2 URL [本文引用: 1] 摘要
在绿洲的放弃的解决和气候变化的关系上的学习能为理解人的回答到现在和未来提供一本历史的参考书在干旱地区的全球温暖。554 的一个总数在 Xinjiang Uygur 自治区域放弃了历史的解决,中国,被用来在过去的 2000 年检验在放弃的解决和温度变化之间的关系。分析在 Xinjiang 的绿洲从汉王朝(206BC-220AD ) 盖住皇朝的时代到 Qing 王朝(1644AD-1911AD ) 。解决的更大的密度在比对与更小的绿洲相比的气候变化更稳定、不太敏感的 2000 km 2 , 大的绿洲被发现。解决在温暖的时期期间在小绿洲和河的中间、更低的活动范围繁荣并且在冷时期期间退缩了到山麓盆和在上游的冲积扇子。这些结果证明到气候的绿洲农业的回答变化。
|
| [21] |
Climate: Present, past and future, volume 2: Climatic history and the future [M]. |
| [22] |
Finding harmony between the environment and humanity: An introduction to the thematic issue of the Silk Road [J].https://doi.org/10.1007/s12665-017-6428-9 URL [本文引用: 1] 摘要
The Silk Road initiative is both exciting and controversial, as it may bring environmental degradation and water resources concerns, and at the same time it promotes swift economic growth in poverty-s
|
| [23] |
Drought promoted the disappearance of civilizations along the ancient Silk Road [J].https://doi.org/10.1007/s12665-016-5925-6 URL [本文引用: 1] 摘要
Understanding the reasons of the disappearance of oasis civilizations along the ancient Silk Road will provide useful references for human’s adaptation to environmental changes in the extreme arid regions in the nowadays and future. Although some studies have associated the demise of complex societies with deteriorating climate in the world, the demise of the civilizations along the ancient Silk Road has remained unresolved. Here, this paper used the nearly 200002years of climate characteristics revealed by Guliya ice cores, combined with the reconstruction of temperature from tree rings located in the west Kunlun Mountains around the Tarim Basin to examine the climate variations in the Northwestern China in the historical periods. Then this paper compared the demise time of the ancient oases civilizations along the ancient Silk Road from the relevant annals of states and counties. The results showed that climate change may be responsible for the rise and demise of past oasis civilizations in the ancient Silk Road. The periods of fourth to fifth centuries and the seventh to eighth centuries were characterized by long-term drought accompanied by cold climate; five ancient oases and seven ancient oases were demised, respectively, during these periods. Cold–dry climate could cause a deficiency in water resources for irrigation; thus, agricultural production fell and the society was destabilized. Recently, creation of a new “Silk Road economic belt” is realized. Modern oases will face more serious threat under the climate change. The region’s irrigation area increased 67.202% over the past 3002years. The agricultural sector consumes 9302% of regional renewable water resources. Once the drought occurred, many modern oases—like their ancient counterparts—may well trigger more civil uprising and violent conflict in the already water-stressed regions.
|
| [24] |
Temperature variations recovered from tree-rings in the middle Qilian Mountain over the last millennium [J].https://doi.org/10.1360/03yd0063 URL [本文引用: 1] 摘要
During the past 1000 years, there had been sev-eral widespread climate events on the earth, such asthe ‘Medieval Warm Period’, the ‘Little Ice Age’ andthe recent warming from the later part of the nine-teenth century onward[1,2]. To better understand
|
| [25] |
Phenological records in Guanzhong area in central China between 600 and 902 AD as proxy for winter half-year temperature reconstruction [J].https://doi.org/10.1007/s11430-016-5325-5 URL [本文引用: 1] 摘要
Phenological data obtained from historical documents constitute highly important ecological evidence for the pre-instrumental period, and can be used in analyzing climatic change in history. In this study, 87 phenological records about seasonality of non-biological events (e.g., first frost date), agriculture and ornamental plants (e.g., first flowering date) over 77 years were extracted from historical documents from the Sui and Tang dynasties in China to reconstruct the winter half-year (from October to next April) temperatures in the Guanzhong Area (located in central China) from 600 to 902 AD. Transfer functions between temperature and phenophases with significant correlations were established by using modern observation data. Temperatures from the study period were reconstructed by applying the transfer functions to historical phenological data. The reconstruction indicates that the winter half-year temperatures during 600–902 AD were 0.23°C higher than the reference period (1961–1990). The temperature changed with two distinct stages. During the 600s–800s, temperatures were approximately 0.38°C higher than at present but then temperatures decreased in the subsequent period (800–902 AD). These results are similar to ones from previous studies on the mean temperature and the divisions between warm and cold periods during the study period, though differences were found in the degree of warmness/coldness. This reconstruction provides a valuable contribution to a better understanding of climatic variability during the Sui and Tang dynasties in China.
|
| [26] |
A review of 2000 years of Paleoclimatic evidence in the Mediterranean [M] |
| [27] |
European summer temperatures since Roman times [J].
The spatial context is criticalwhen assessing present-day climate anomalies, attributing them to potential forcings and making statements regarding their frequency and severity in a long-term perspective. Recent international initiatives have expanded the number of high-quality proxy-records and developed new statistical reconstruction methods. These advances allow more rigorous regional past temperature reconstructions and, in turn, the possibility of evaluating climate models on policy-relevant, spatiotemporal scales. Here we provide a new proxy-based, annually-resolved, spatial reconstruction of the European summer (June-August) temperature fields back to 755 CE based on Bayesian hierarchical modelling (BHM), together with estimates of the European mean temperature variation since 138 BCE based on BHM and composite-plus-scaling (CPS). Our reconstructions compare well with independent instrumental and proxy-based temperature estimates, but suggest a larger amplitude in summer temperature variability than previously reported. Both CPS and BHM reconstructions indicate that the mean 20th century European summer temperature was not significantly different from some earlier centuries, including the 1st, 2nd, 8th and 10th centuries CE. The 1st century (in BHM also the 10th century) may even have been slightly warmer than the 20th century, but the difference is not statistically significant. Comparing each 50 yr period with the 1951-2000 period reveals a similar pattern. Recent summers, however, have been unusually warm in the context of the last two millennia and there are no 30 yr periods in either reconstruction that exceed the mean average European summer temperature of the last 3 decades (1986-2015 CE). A comparison with an ensemble of climate model simulations suggests that the reconstructed European summer temperature variability over the period 850-2000 CE reflects changes in both internal variability and external forcing on multi-decadal time-scales. For pan-European temperatures we find slightly better agreement between the reconstruction and the model simulations with high-end estimates for total solar irradiance. Temperature differences between the medieval period, the recent period and the Little Ice Age are larger in the reconstructions than the simulations. This may indicate inflated variability of the reconstructions, a lack of sensitivity and processes to changes in external forcing on the simulated European climate and/or an underestimation of internal variability on centennial and longer time scales.
|
| [28] |
Continental-scale temperature variability during the past two millennia [J].https://doi.org/10.1038/ngeo1797 URL [本文引用: 2] 摘要
Past global climate changes had strong regional expression. To elucidate their spatio-temporal pattern, we reconstructed past temperatures for seven continental-scale regions during the past one to two millennia. The most coherent feature in nearly all of the regional temperature reconstructions is a long-term cooling trend, which ended late in the nineteenth century. At multi-decadal to centennial scales, temperature variability shows distinctly different regional patterns, with more similarity within each hemisphere than between them. There were no globally synchronous multi-decadal warm or cold intervals that define a worldwide Medieval Warm Period or Little Ice Age, but all reconstructions show generally cold conditions between AD 1580 and 1880, punctuated in some regions by warm decades during the eighteenth century. The transition to these colder conditions occurred earlier in the Arctic, Europe and Asia than in North America or the Southern Hemisphere regions. Recent warming reversed the long-term cooling; during the period AD 1971-2000, the area-weighted average reconstructed temperature was higher than any other time in nearly 1,400 years.
|
| [29] |
A global multiproxy database for temperature reconstructions of the Common Era [J].URL PMID: 5505119 [本文引用: 1] 摘要
Reproducible climate reconstructions of the Common Era (1 CE to present) are key to placing industrial-era warming into the context of natural climatic variability. Here we present a community-sourced database of temperature-sensitive proxy records from the PAGES2k initiative. The database gathers 692 records from 648 locations, including all continental regions and major ocean basins. The records are from trees, ice, sediment, corals, speleothems, documentary evidence, and other archives. They range in length from 50 to 2000 years, with a median of 547 years, while temporal resolution ranges from biweekly to centennial. Nearly half of the proxy time series are significantly correlated with HadCRUT4.2 surface temperature over the period 1850 2014. Global temperature composites show a remarkable degree of coherence between high- and low-resolution archives, with broadly similar patterns across archive types, terrestrial versus marine locations, and screening criteria. The database is suited to investigations of global and regional temperature variability over the Common Era, and is shared in the Linked Paleo Data (LiPD) format, including serializations in Matlab, R and Python.
|
| [30] |
Two millennia of North Atlantic seasonality and implications for Norse colonies [J].https://doi.org/10.1073/pnas.0902522107 URL PMID: 20212157 [本文引用: 1] 摘要
Abstract delta(18)O values of mollusks recovered from near-shore marine cores in northwest Iceland quantify significant variation in seasonal temperature over the period from approximately 360 B.C. to approximately A.D. 1660. Twenty-six aragonitic bivalve specimens were selected to represent intervals of climatic interest by using core sedimentological characteristics. Carbonate powder was sequentially micromilled from shell surfaces concordant with growth banding and analyzed for stable oxygen (delta(18)O) and carbon (delta(13)C) isotope values. Because delta(18)O values record subseasonal temperature variation over the lifetime of the bivalves, these data provide the first 2,000-year secular record of North Atlantic seasonality from ca. 360 cal yr B.C. to cal yr A.D. 1660. Notable cold periods (360 B.C. to 240 B.C.; A.D. 410; and A.D. 1380 to 1420) and warm periods (230 B.C. to A.D. 140 and A.D. 640 to 760) are resolved in terms of contrast between summer and winter temperatures and seasonal temperature variability. Literature from the Viking Age (ca. 790 to 1070) during the establishment of Norse colonies (and later) in Iceland and Greenland permits comparisons between the delta(18)O temperature record and historical records, thereby demonstrating the impact of seasonal climatic extremes on the establishment, development, and, in some cases, collapse of societies in the North Atlantic.
|
| [31] |
A multi-proxy reconstruction of spatial and temporal variations in Asian summer temperatures over the last millennium [J].https://doi.org/10.1007/s10584-015-1413-3 URL [本文引用: 3] 摘要
To investigate climate variability in Asia during the last millennium, the spatial and temporal evolution of summer(June uly ugust; JJA) temperature in eastern and south-central Asia is reconstructed using multi-proxy records and the regularized expectation maximization(RegE M) algorithm with truncated total least squares(TTLS), under a point-by-point regression(PPR) framework. The temperature index reconstructions show that the late 20 th century was thewarmest period in Asia over the past millennium. The temperature field reconstructions illustrate that temperatures in central, eastern, and southern China during the 11 th and 13 th centuries, and in western Asia during the 12 th century, were significantly higher than those in other regions, and comparable to levels in the 20 th century. Except for the most recent warming, all identified warm events showed distinct regional expressions and none were uniform over the entire reconstruction area. The main finding of the study is that spatial temperature patterns have, on centennial timescales, varied greatly over the last millennium. Moreover, seven climate model simulations, from the Coupled Model Intercomparison Project Phase 5(CMIP5), over the same region of Asia, are all consistent with the temperature index reconstruction at the 99 % confidence level. Only spatial temperature patterns extracted as the first empirical orthogonal function(EOF) from the GISS-E2-R and MPI-ESM-P model simulations are significant and consistent with the temperature field reconstruction over the past millennium in Asia at the 90 % confidence level. This indicates that both the reconstruction and the simulations depict the temporal climate variability well over the past millennium. However, the spatial simulation or reconstruction capability of climate variability over the past millennium could be still limited. For reconstruction, some grid points do not pass validation tests and reveal the need for more proxies with high temporal resolution, accurate dating,and sensitive temperature signals, especially in central Asia and before AD 1400.
|
| [32] |
May-June precipitation reconstruction of southwestern Anatolia, Turkey during the last 900 years from tree rings [J].https://doi.org/10.1016/j.yqres.2007.07.001 URL [本文引用: 1] 摘要
A May090009June precipitation reconstruction (AD 10970900092000) has been developed for southwestern Anatolia in Turkey, the longest reported to date in this region. The reconstruction was derived from a regional Juniperus excelsa chronology that was built from material sampled at four sites in the Antalya and Mersin Districts. The regional tree-ring chronology accounts for 51% of the variance of instrumentally observed May090009June precipitation. The years AD 1518 to 1587 are the most humid period in the reconstruction, coinciding with a major shift in European climate. The driest 70-year period in the reconstruction is AD 1195 to 1264. The period AD 15910900091660 represents the third driest and was characterized by instability climatically, politically, and socially in Anatolia.
|
| [33] |
Millennial minimum temperature variations in the Qilian Mountains, China: Evidence from tree rings [J].https://doi.org/10.5194/cpd-10-341-2014 URL [本文引用: 1] 摘要
A 1342 yr-long tree-ring chronology was developed from Qilian junipers inthe central Qilian Mountains of the north-eastern Tibetan Plateau, China.The climatic implications of this chronology were investigated using simplecorrelation, partial correlation and response function analyses. Thechronology was significantly positively correlated with temperaturevariables during the pre- and current growing seasons, especially withminimum temperature. The variability of the mean minimum temperature fromJanuary to August since 670 AD was then reconstructed based on the tree-ringchronology. The reconstruction explained 58.5% of the variance in theinstrumental temperature records during the calibration period (1960–2011)and captured the variation patterns in minimum temperature at the annual tocentennial time scales over the past millennium. The most recent 50 yrwere the warmest period, while 1690–1880 was the coldest period since670 AD. Comparisons with other temperature series from neighbouring regions andfor the Northern Hemisphere as a whole supported the validity of ourreconstruction and suggested that it provided a good regional representationof temperature change in the north-eastern Tibetan Plateau. The results ofmulti-taper spectral analysis showed the occurrence of significantquasi-periodic behaviour at a number of periods (2–3, 28.8–66.2,113.6–169.5, and 500 yr), which were consistent with those associatedwith El Ni09o-Southern Oscillation (ENSO), Pacific Decadal Oscillation(PDO) and solar activity. Some reconstructed cold events may have closerelationship with the volcanic eruptions.
|
| [34] |
Annual precipitation reconstruction since AD 775 based on tree rings from the Qilian Mountains, northwestern China [J].https://doi.org/10.1002/joc.2085 URL [本文引用: 1] 摘要
Abstract A millennium-long tree-ring-width chronology from the middle Qilian Mountains in northwestern China has been used to reconstruct annual precipitation variation (from the prior August to current July) since AD 775. The reconstruction explains 37.8% of variance of the observed data. Based on the mean and standard deviation of the reconstructed series, several prolonged severe dry and wet periods were indentified: drought spells in AD 1144–1154 (11 years) and 1925–1932 (8 years) and wet spells in AD 985–999 (15 years), 1089–1097 (9 years) and 1979–1991 (12 years). Both multi-taper spectral analysis (MTM) and wavelet analysis suggest that periods of the reconstructed precipitation are consistent with those associated with the Asian Summer Monsoon and perhaps solar activity. Copyright 08 2010 Royal Meteorological Society
|

/
| 〈 |
|
〉 |